A body is moving unidirectionally under the influence of a source of constant power supplying energy. Which of the diagrams shown in figure. Correctly shows the displacement-time curve for its motion ?
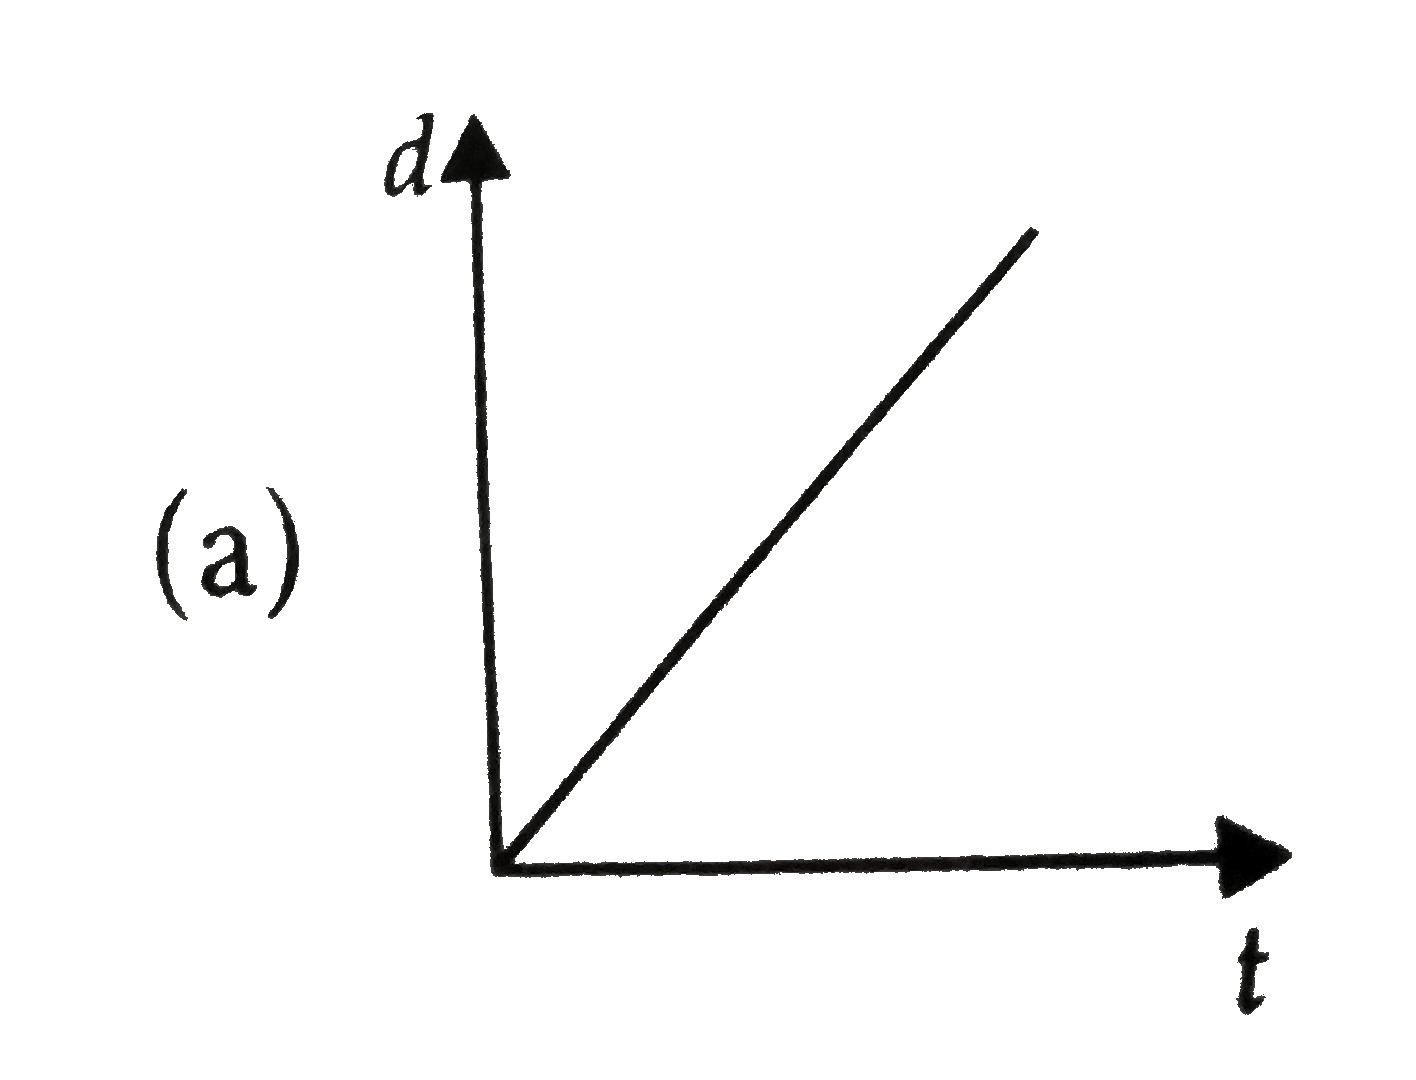
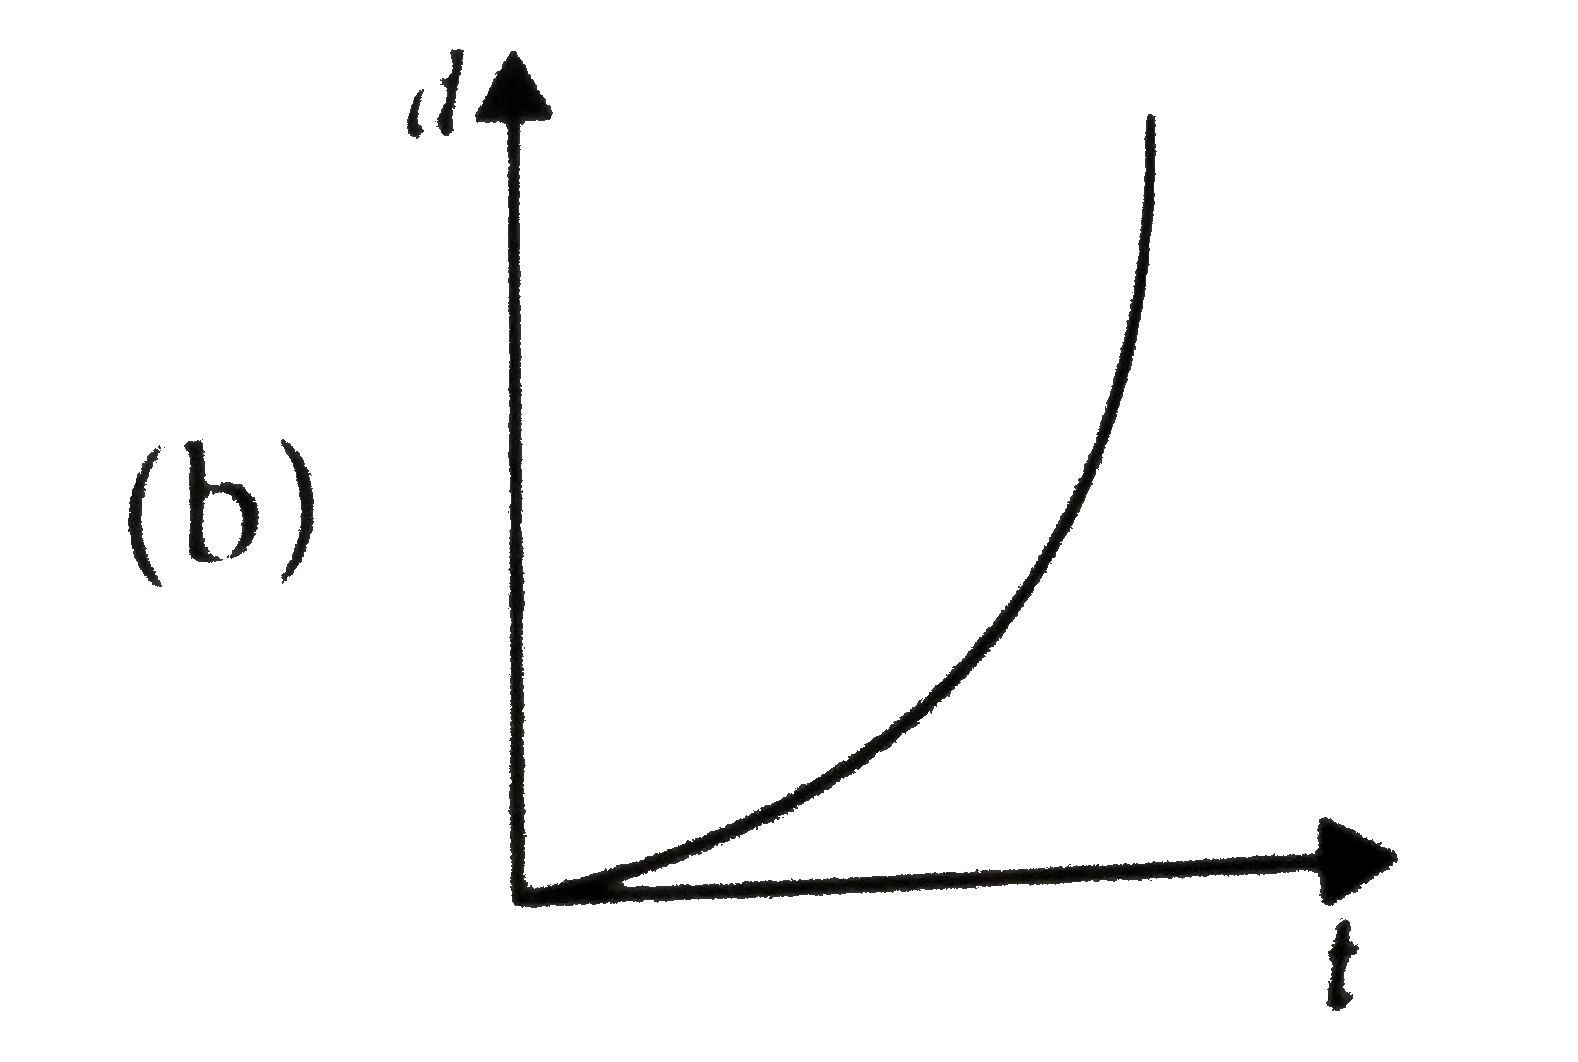
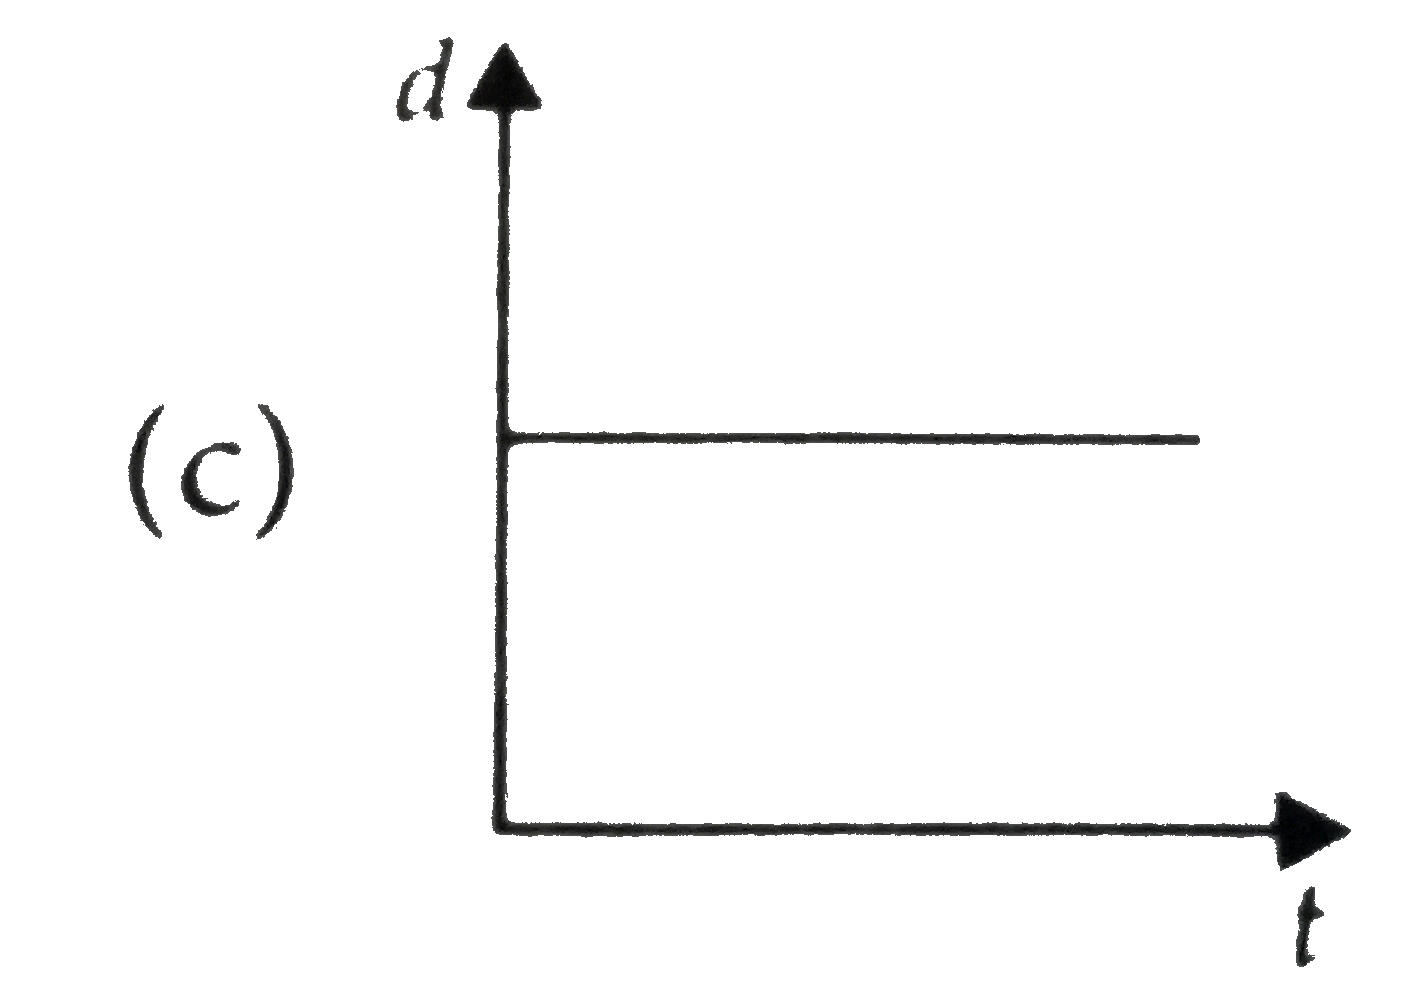
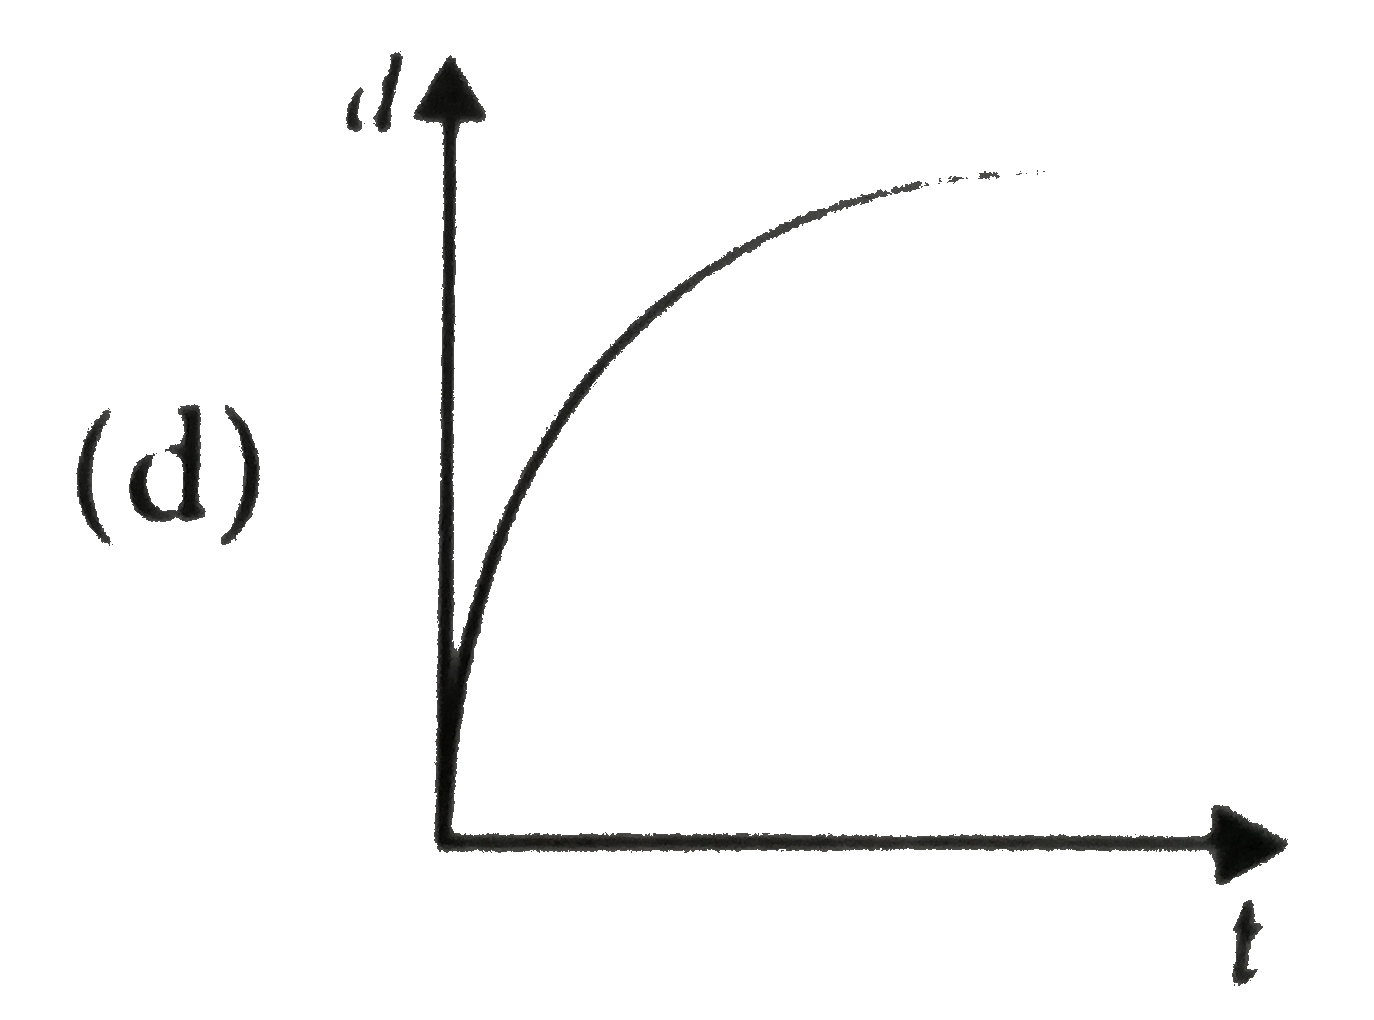
The correct Answer is:B
To determine the correct displacement-time curve for a body moving under the influence of a constant power source, we can follow these steps:
1. Understanding Power:
- Power (P) is defined as the rate of doing work or the rate of energy transfer. Mathematically, it can be expressed as:
P=Wt=F⋅dt
where W is work done, F is force, d is displacement, and t is time.
2. Relating Power to Force and Velocity:
- We can also express power in terms of force and velocity:
P=F⋅v
where v is the velocity of the body. Since power is constant, F⋅v=constant.
3. Using the Relationship of Force and Acceleration:
- According to Newton's second law, F=m⋅a, where m is the mass and a is acceleration. Since mass is constant, we can write:
P=m⋅a⋅v
4. Expressing Acceleration in Terms of Displacement:
- From the relationship a=dvdt and v=dsdt, we can express acceleration as:
a=d2sdt2
5. Deriving the Displacement-Time Relationship:
- Since power is constant, we can derive a relationship between displacement and time. By substituting a into the power equation, we find:
P=m⋅d2sdt2⋅dsdt
- Rearranging gives us:
d2sdt2⋅dsdt=Pm
6. Integrating the Equation:
- Integrating this equation leads to a relationship that shows displacement s is proportional to t3/2:
s∝t3/2
7. Identifying the Correct Graph:
- The relationship s∝t3/2 indicates that as time increases, displacement increases at a rate proportional to t3/2. This means the graph will be a curve that starts at the origin and rises more steeply as time progresses.
- Among the provided options, we need to identify the graph that reflects this relationship.
Conclusion:
The correct displacement-time curve for the motion of the body under constant power is the one that resembles the function s∝t3/2, which is a curve that increases more steeply as time increases.
- Power (P) is defined as the rate of doing work or the rate of energy transfer. Mathematically, it can be expressed as:
P=Wt=F⋅dt
where W is work done, F is force, d is displacement, and t is time.
- We can also express power in terms of force and velocity:
P=F⋅v
where v is the velocity of the body. Since power is constant, F⋅v=constant.
- According to Newton's second law, F=m⋅a, where m is the mass and a is acceleration. Since mass is constant, we can write:
P=m⋅a⋅v
- From the relationship a=dvdt and v=dsdt, we can express acceleration as:
a=d2sdt2
- Since power is constant, we can derive a relationship between displacement and time. By substituting a into the power equation, we find:
P=m⋅d2sdt2⋅dsdt
- Rearranging gives us:
d2sdt2⋅dsdt=Pm
- Integrating this equation leads to a relationship that shows displacement s is proportional to t3/2:
s∝t3/2
- The relationship s∝t3/2 indicates that as time increases, displacement increases at a rate proportional to t3/2. This means the graph will be a curve that starts at the origin and rises more steeply as time progresses.
- Among the provided options, we need to identify the graph that reflects this relationship.
The correct displacement-time curve for the motion of the body under constant power is the one that resembles the function s∝t3/2, which is a curve that increases more steeply as time increases.
Topper's Solved these Questions
- WORK , ENERGY AND POWERBOOK - NCERT FINGERTPS ENGLISHCHAPTER - WORK , ENERGY AND POWEREXERCISE - ASSERTION & REASON
15 Videos
- WORK , ENERGY AND POWERBOOK - NCERT FINGERTPS ENGLISHCHAPTER - WORK , ENERGY AND POWEREXERCISE - Motion Of Work And Kinetic Energy : The Work-Energy Theorem
4 Videos
- WORK , ENERGY AND POWERBOOK - NCERT FINGERTPS ENGLISHCHAPTER - WORK , ENERGY AND POWEREXERCISE - Assertion And Reason
15 Videos
- WAVESBOOK - NCERT FINGERTPS ENGLISHCHAPTER - WAVESEXERCISE - Assertion And Reason
15 Videos
Similar Questions
A body is moving undirectionally under the influence of a source of constatn power. It displacement in time t is proportional to (i) t1/2 (ii) t (iii) t3/2 (iv) t2
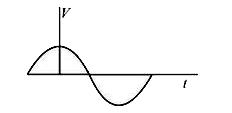
View SolutionVoltage across a capacitor varies as shown in the diagram. Which diagram correctly represents the current time curve?
View Solution
Knowledge Check
A raindrop falling from a height h above ground, attains a near terminal velocity when it has fallen through a height (3/4)h. Which of the diagrams shown in figure correctly shows the change in kinetic and potential energy of the drop during its fall up to the ground ?
A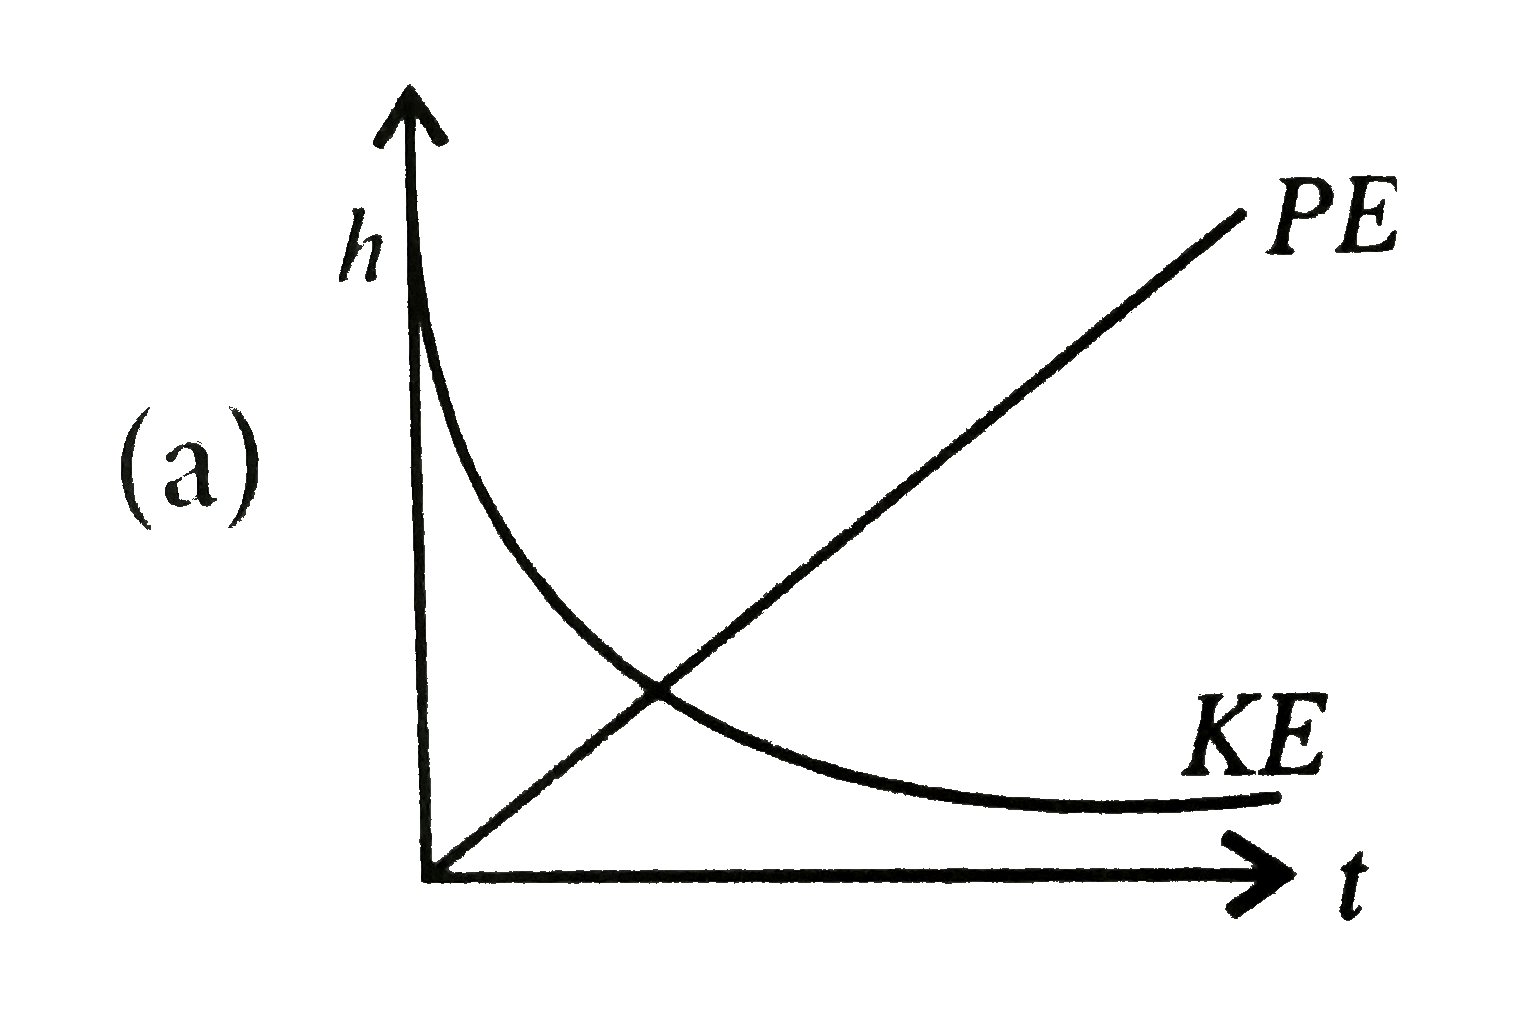 B
B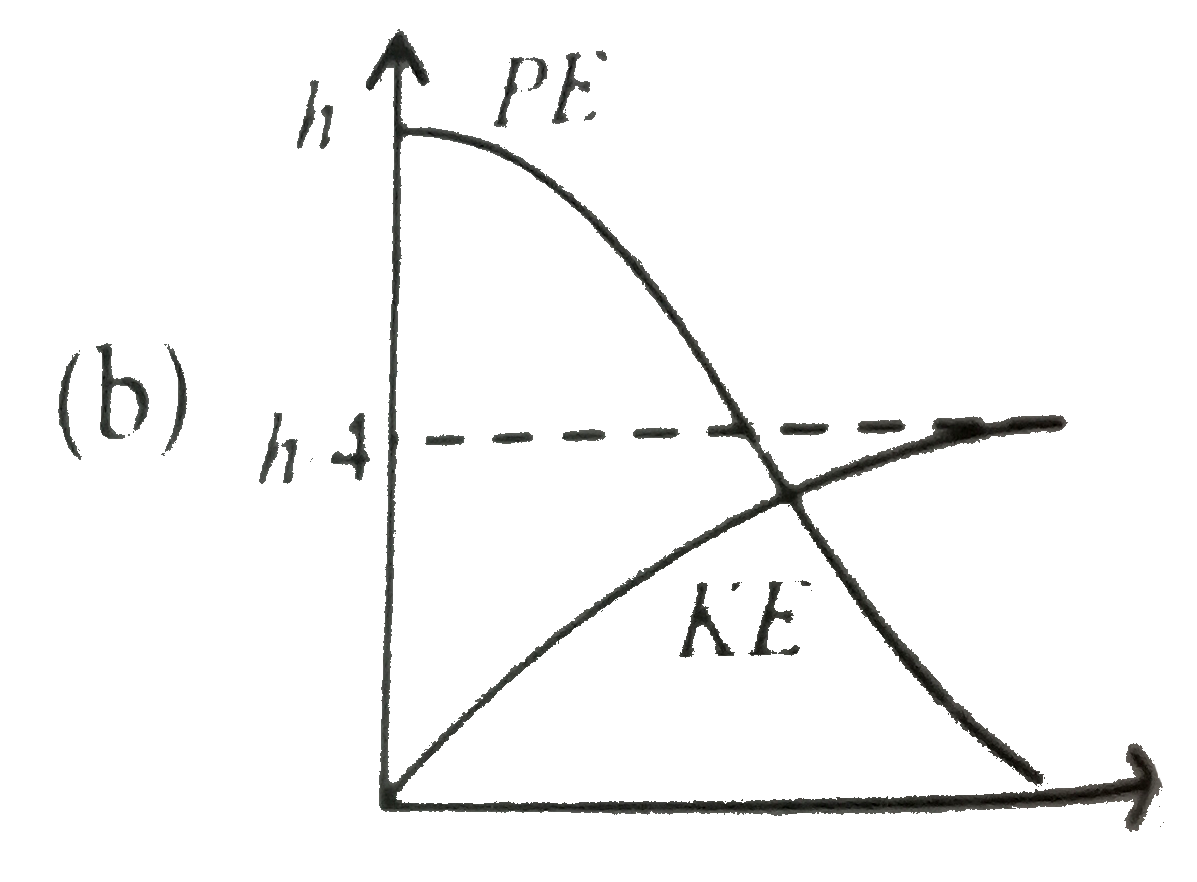 C
C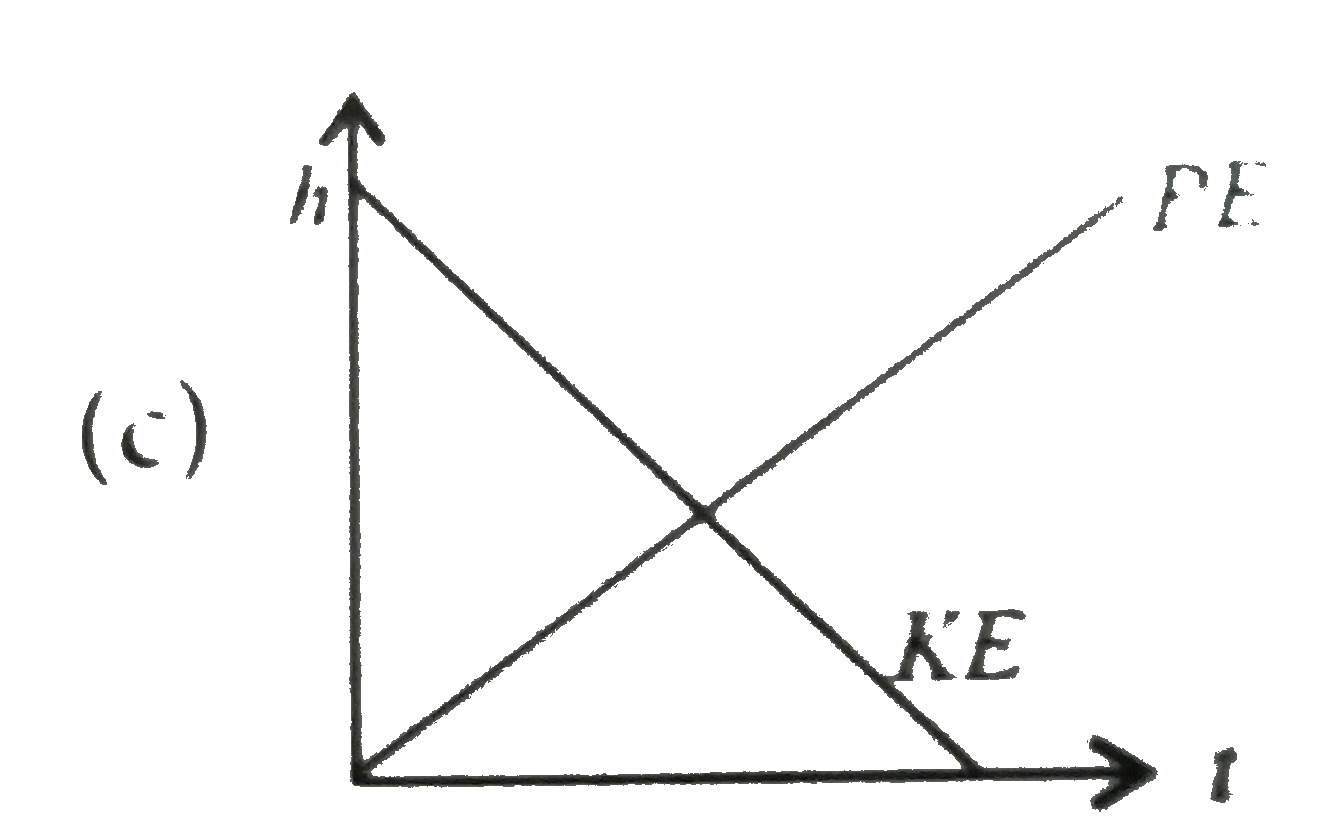 D
D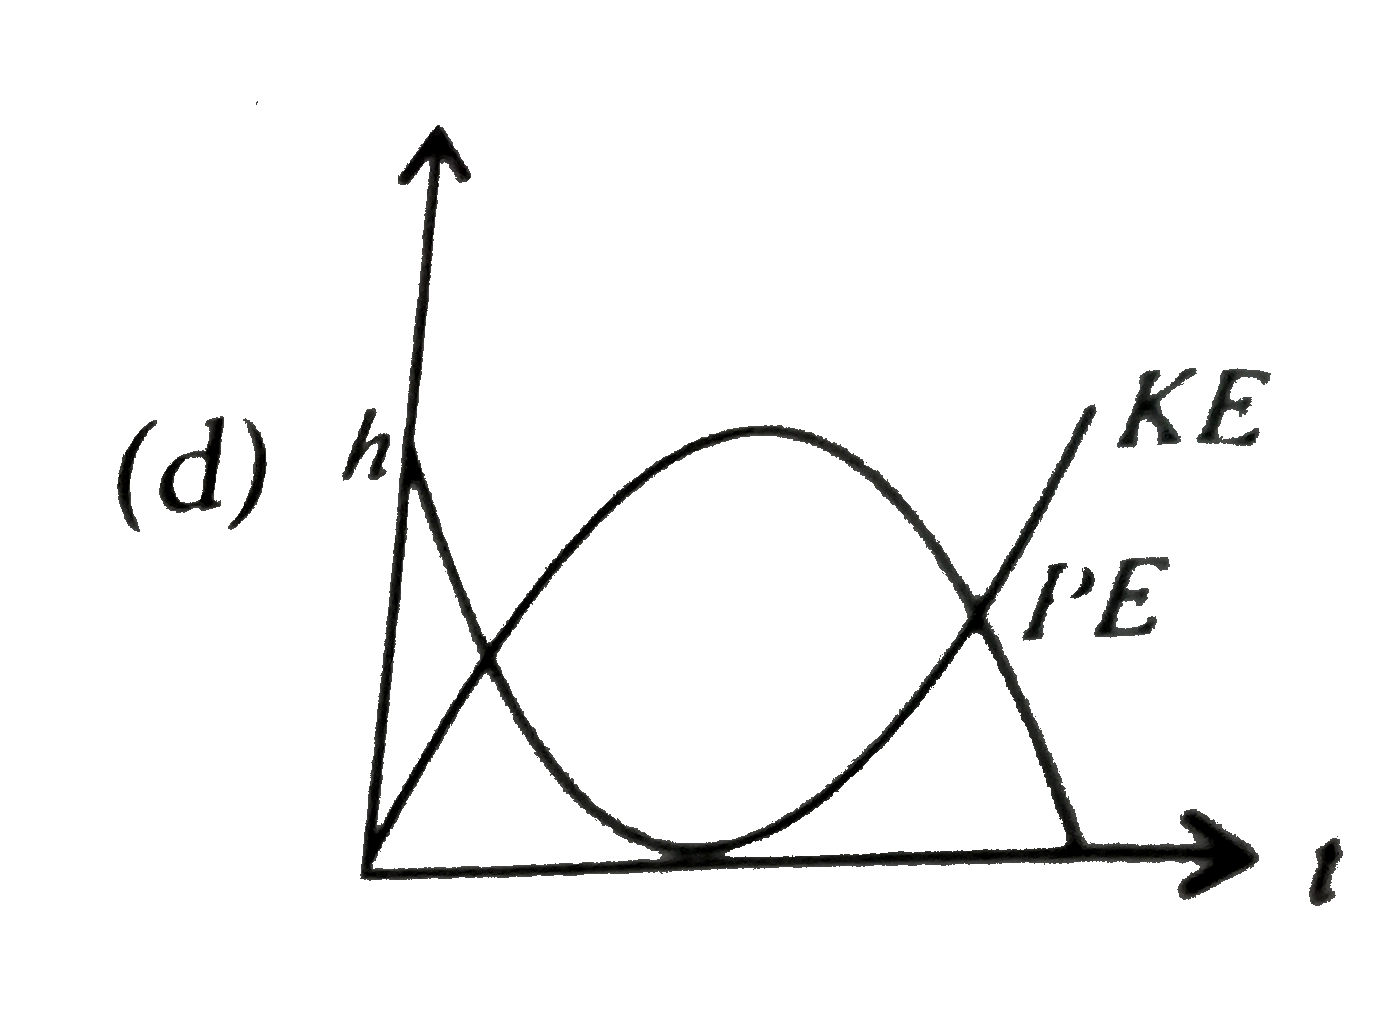
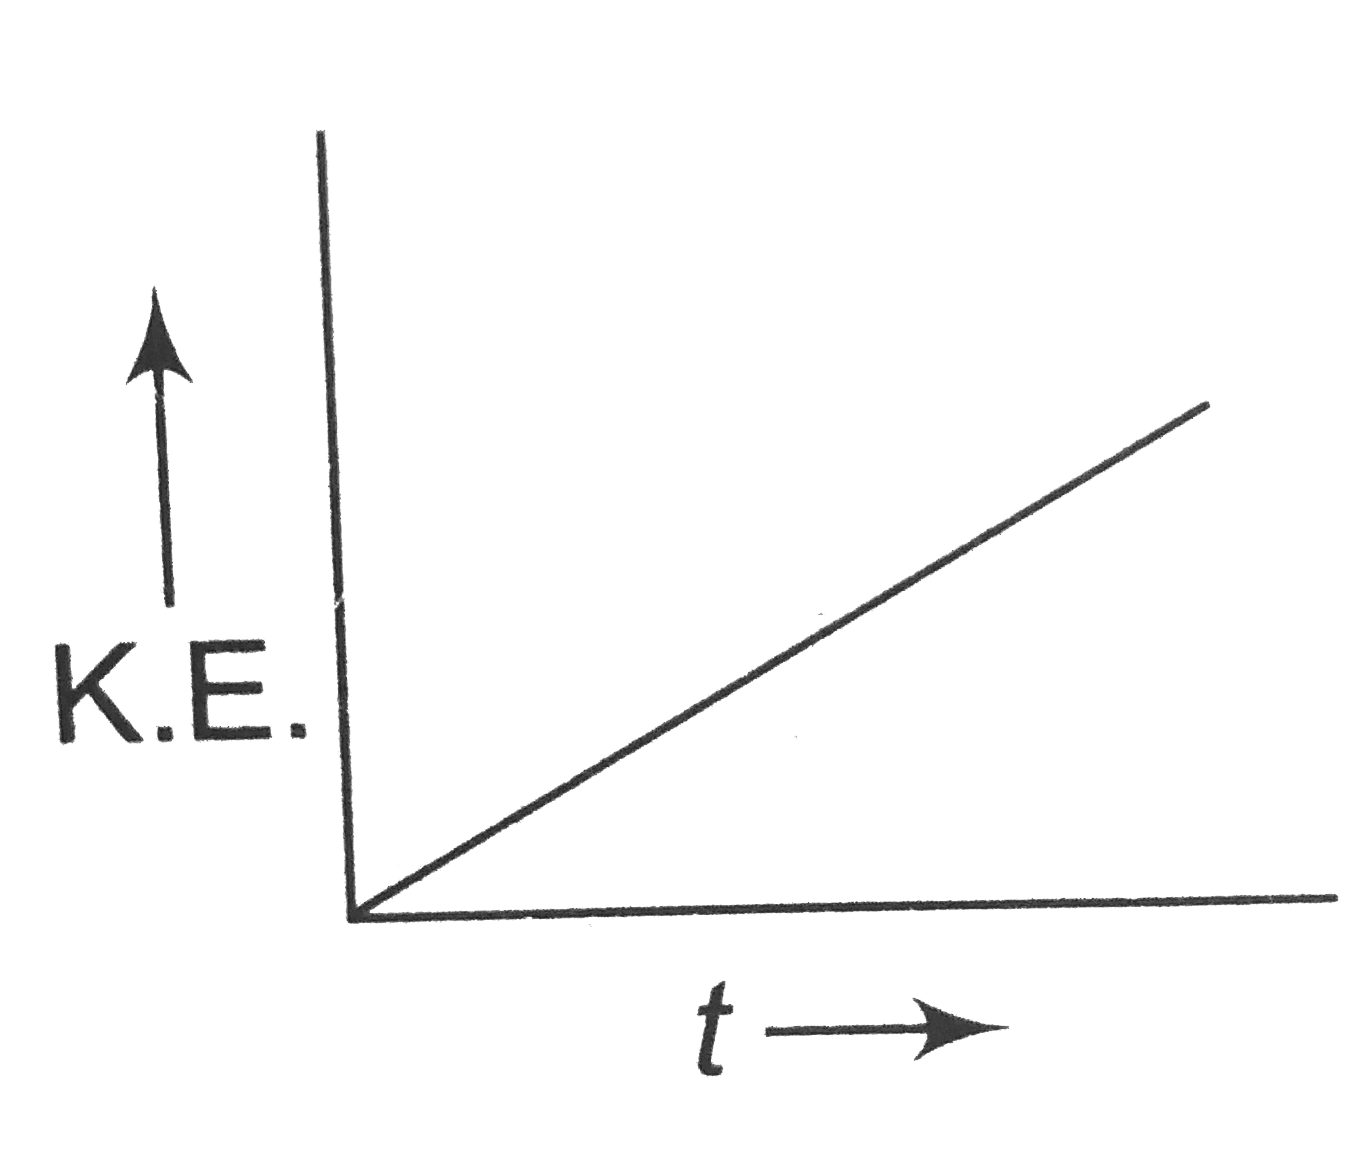
The kinetic energy of a body moving along a straight line varies with time as shown in figure. The force acting on the body:
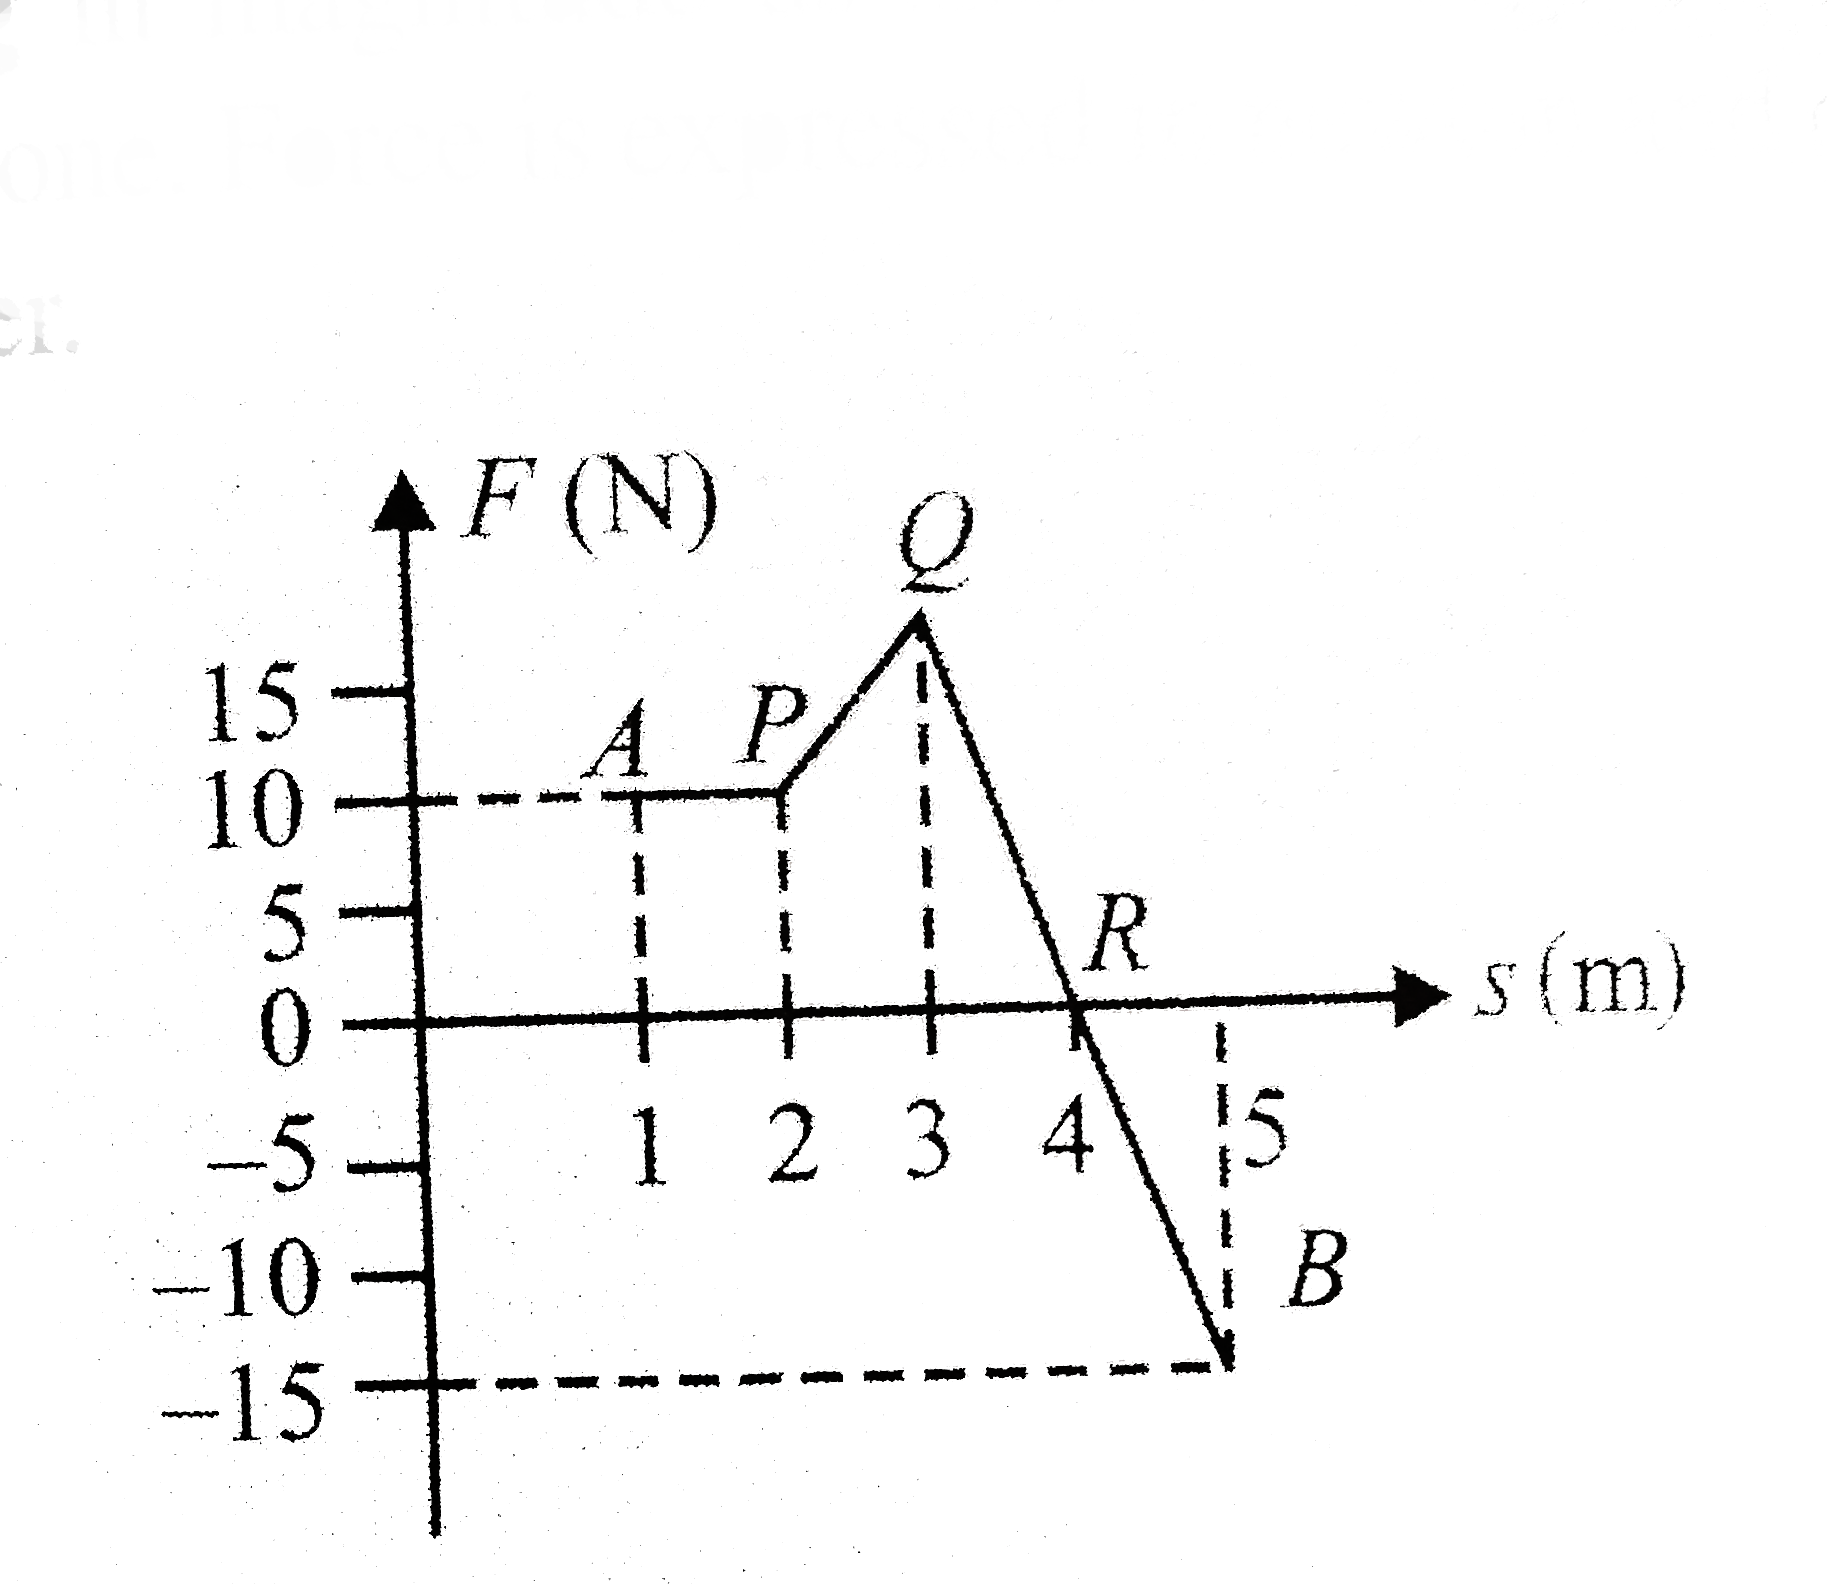
View SolutionA body moves from point A to B under the action of a force, varying in magnitude as shown in figure. Obtain the work done. Force is expressed in newton and displacement in meter.
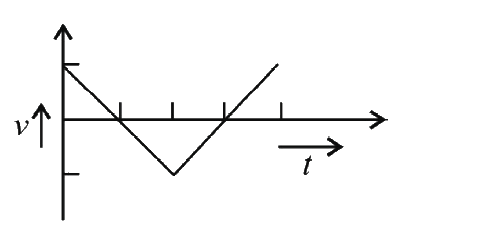
View SolutionThe graph in figure shows the velocity v versus time t for a body. Which of the graphs shown in figure represents the correesponding acceleration versus time graphs ?
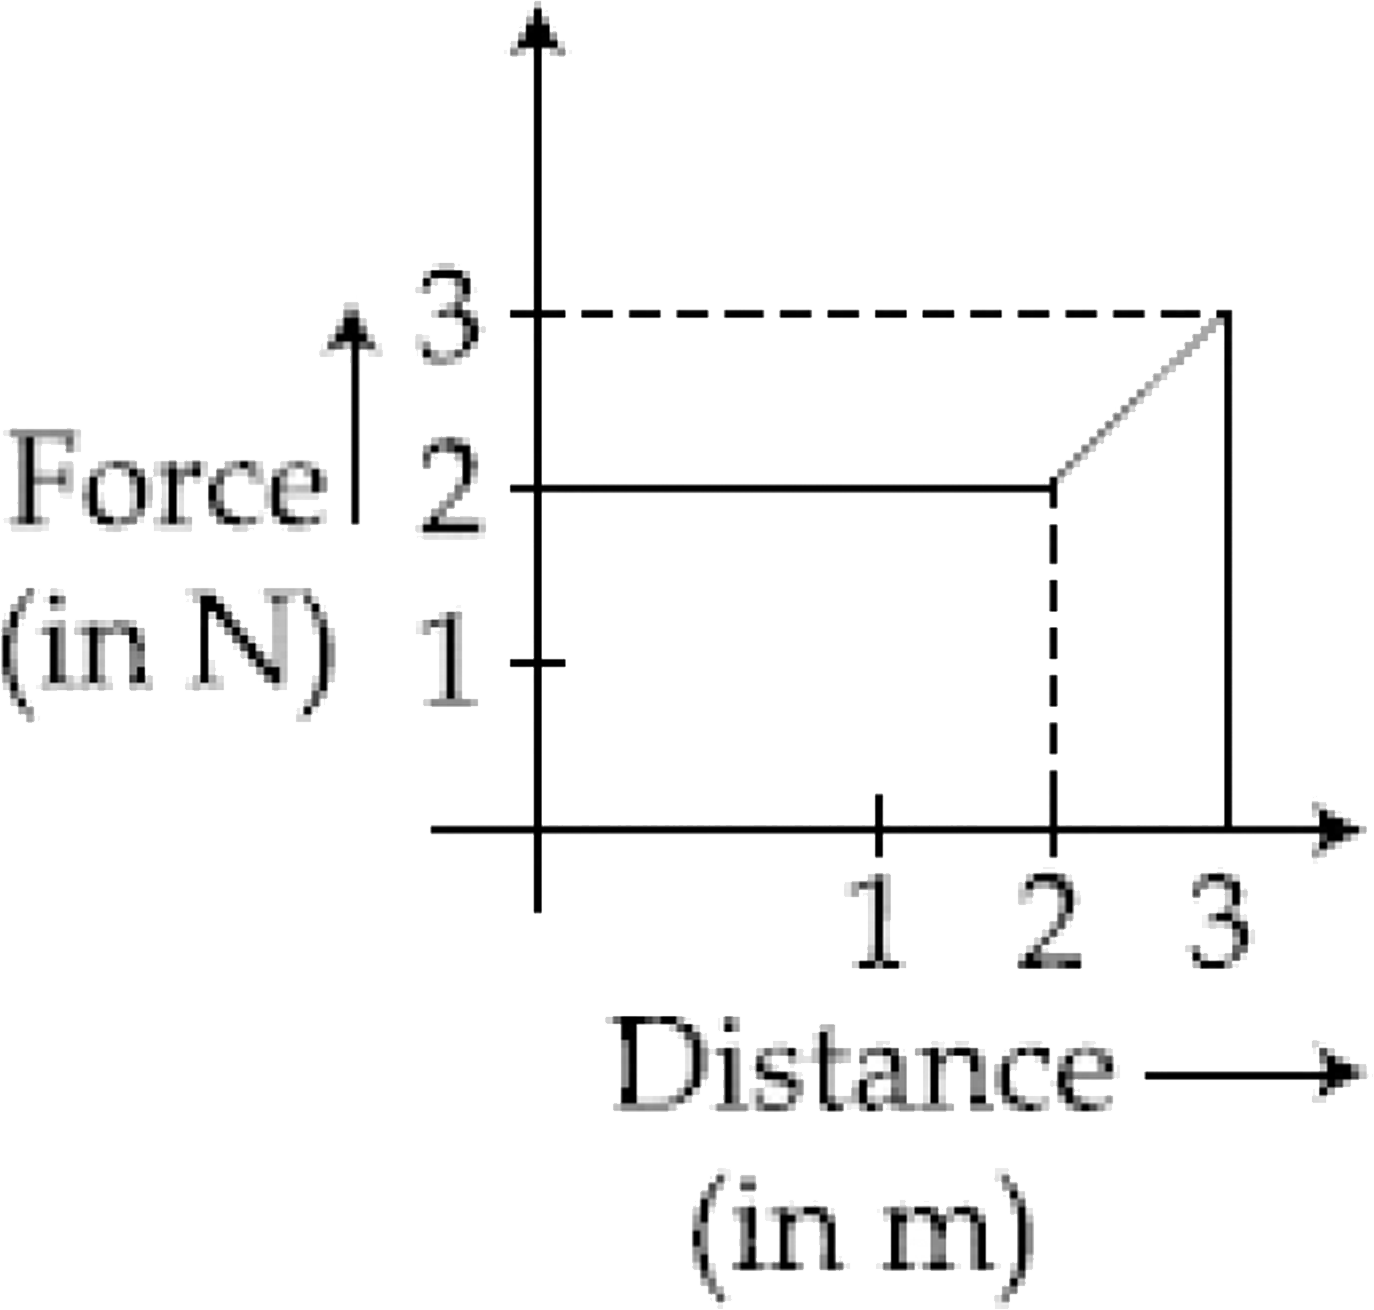
View SolutionA particle moves in one dimension from rest under the influence of a force that varies with the distance travelled by the particle as shown in the figure. The kinetic energy of the particle after it has travelled 3m is:
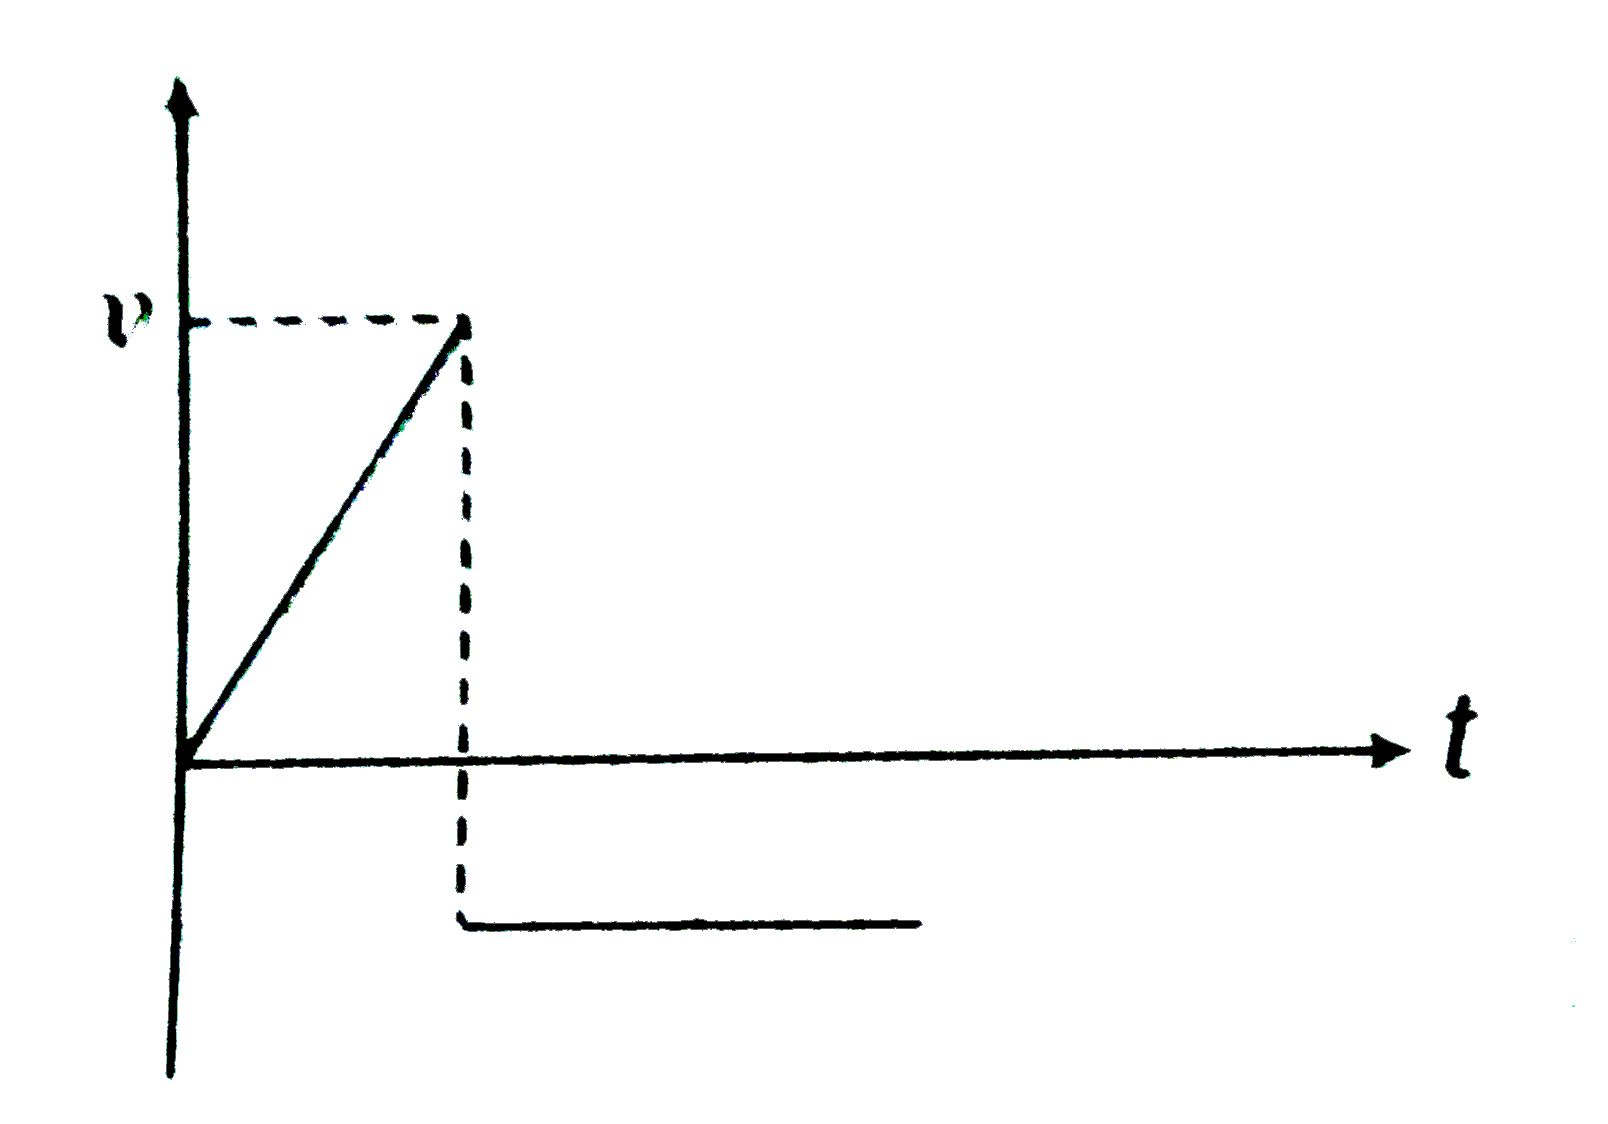
View SolutionThe velocity-time graph for a particle moving along X-axis is shown in the figure. The corresponding displacement-time graph is correctly shown by
View SolutionA particle of mass m starts moving from origin along a horizontal x-y plane under the influence of a force of constant magnitude F ( which is always parallel to the x-axis ) and a constraint force. The trajectory of its motion is f(x)=xx2+1. Then,
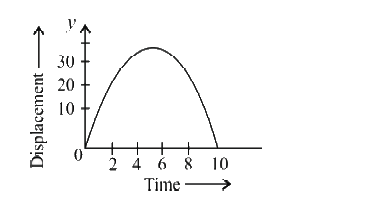
View SolutionThe displacement-time graph of a moving object is shown in figure. Which of the velocity-time graphs shown in figure could represent the motion of the same body ?
View Solution

