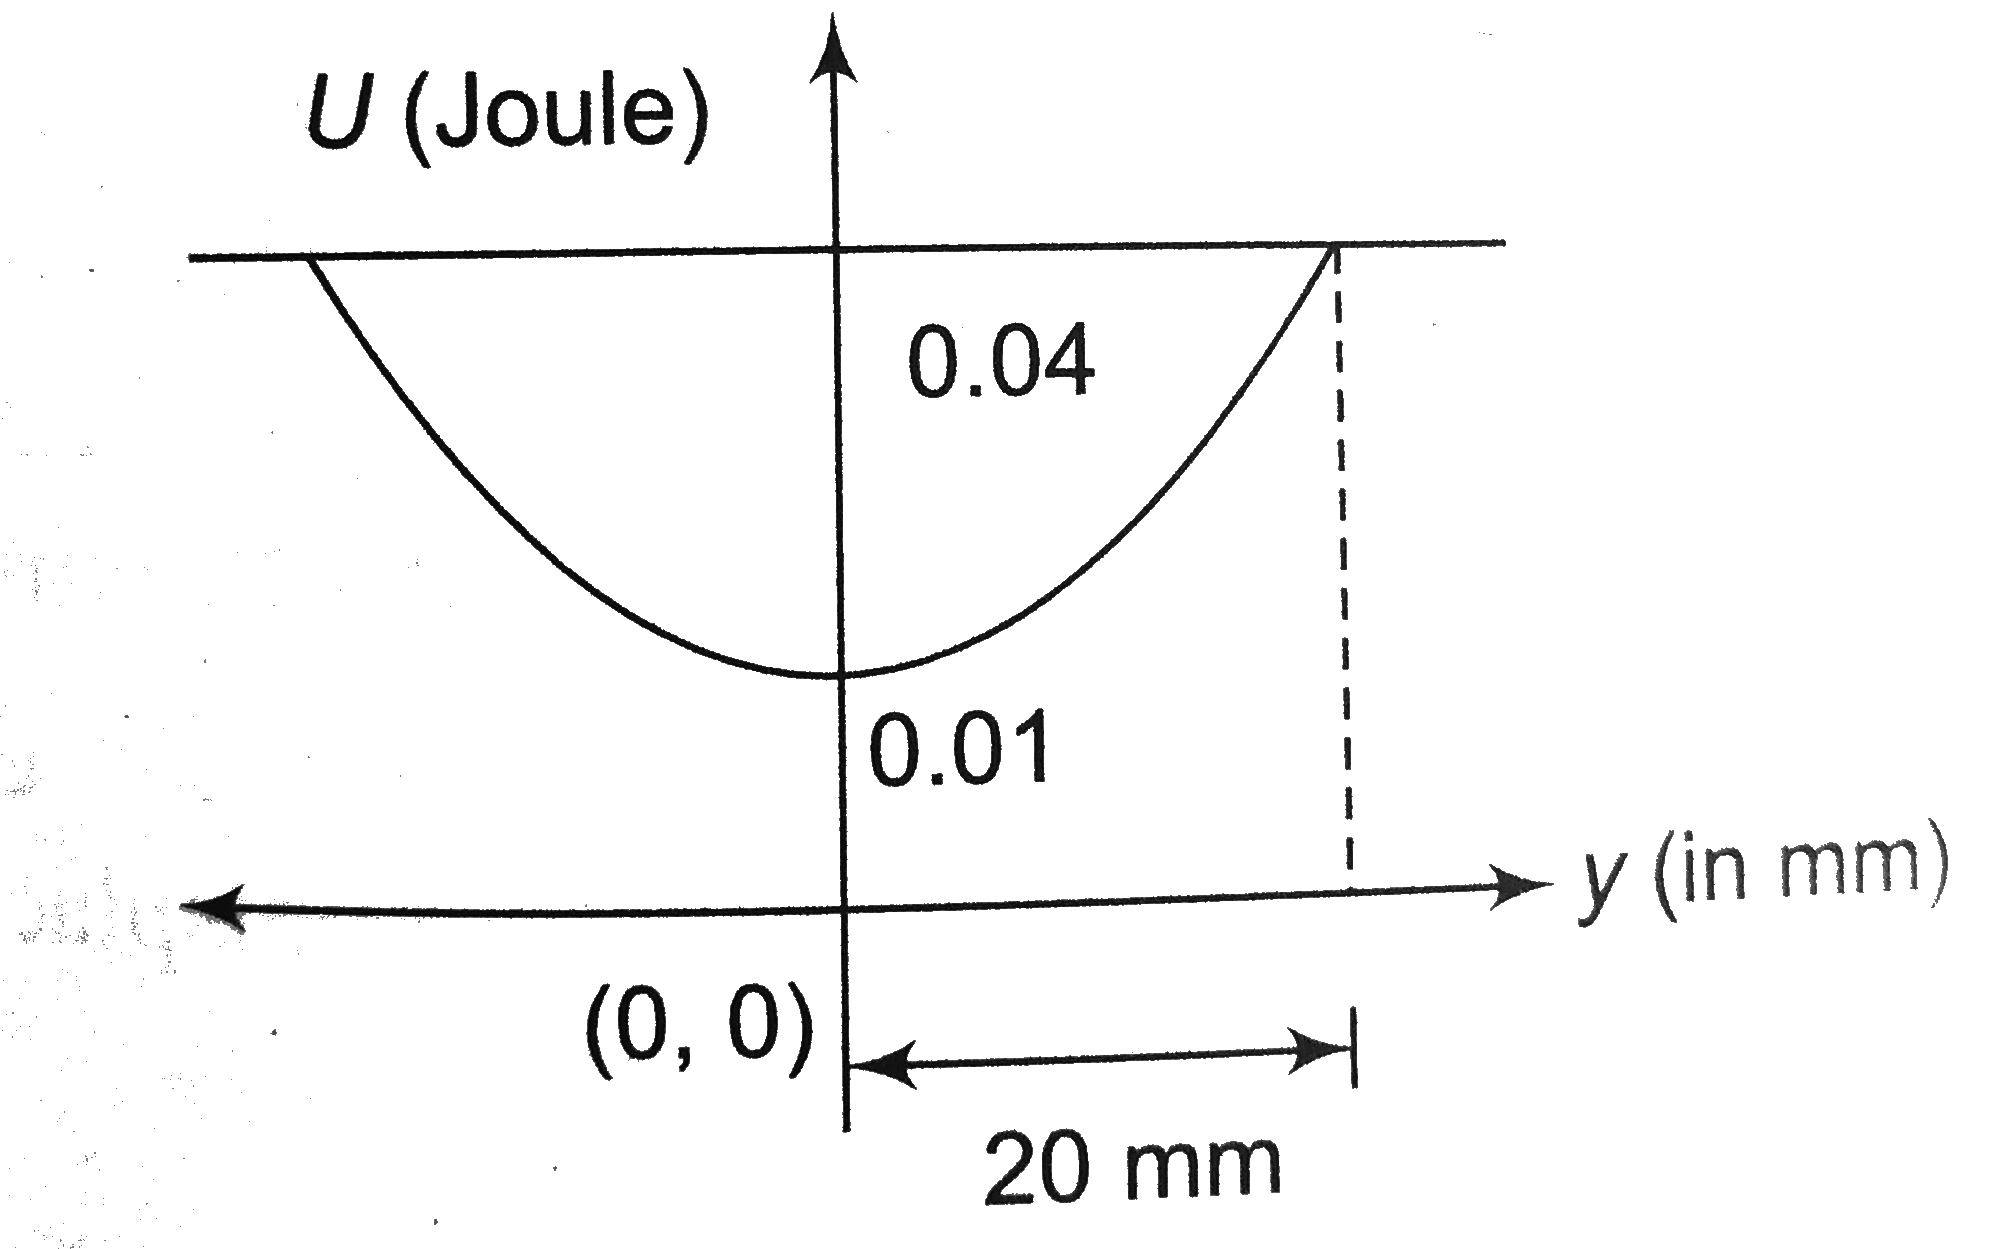
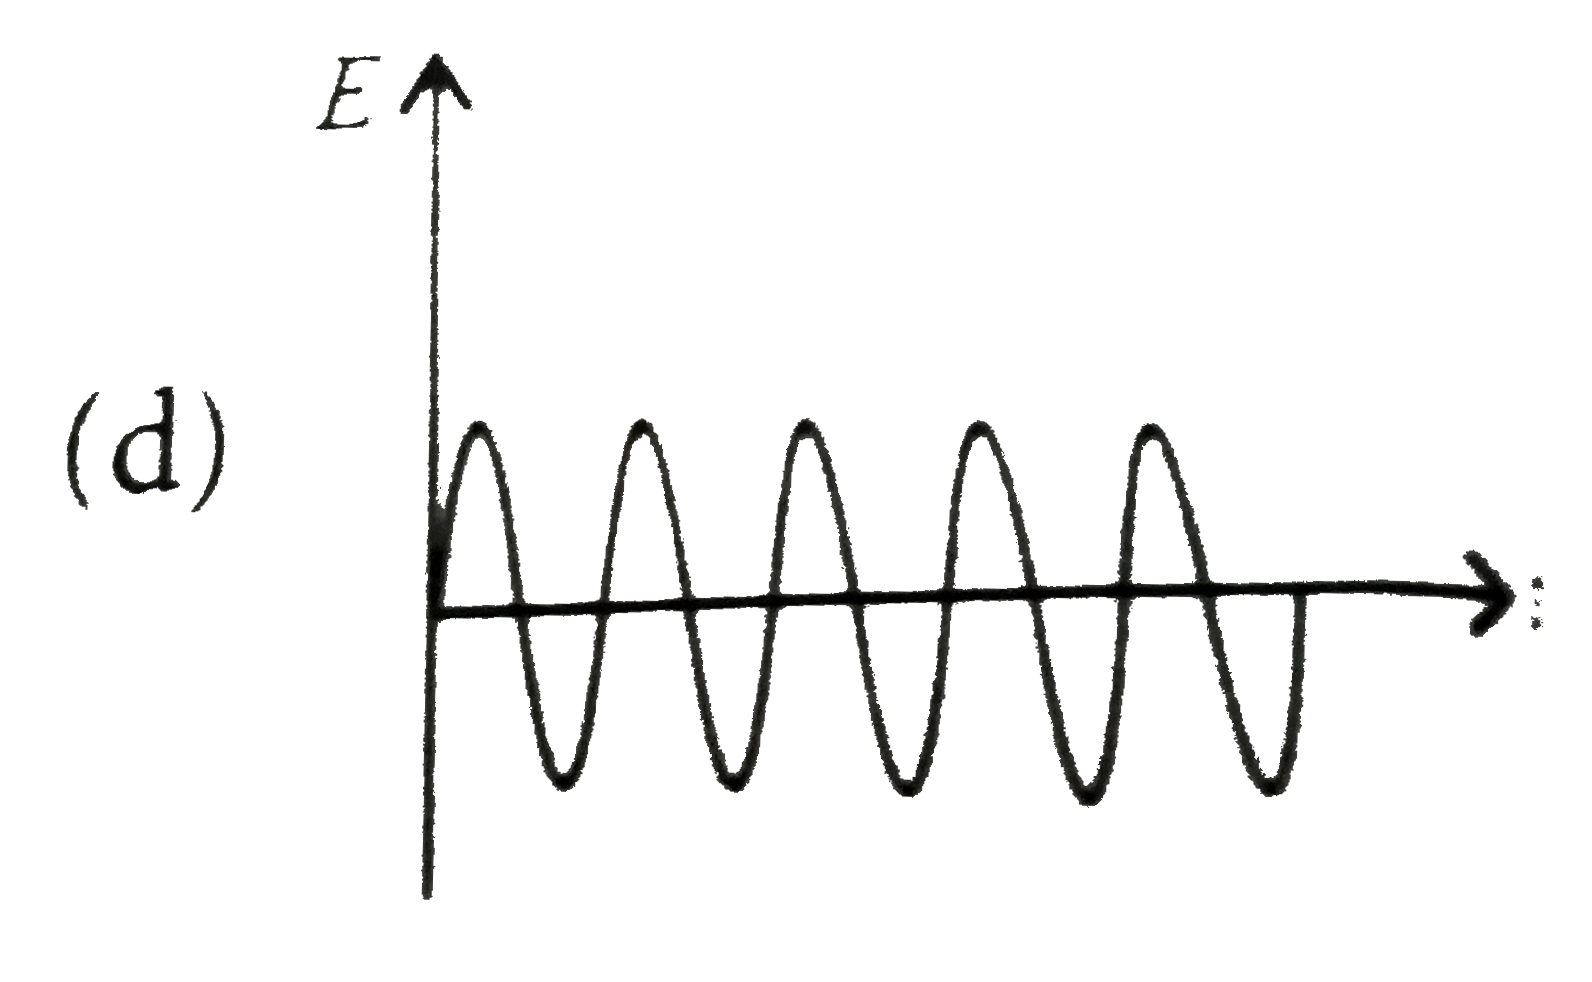
Which of the diagram shown in figures respresents variation of total mechanical energy of a pendulam oscillation in air as function of time?
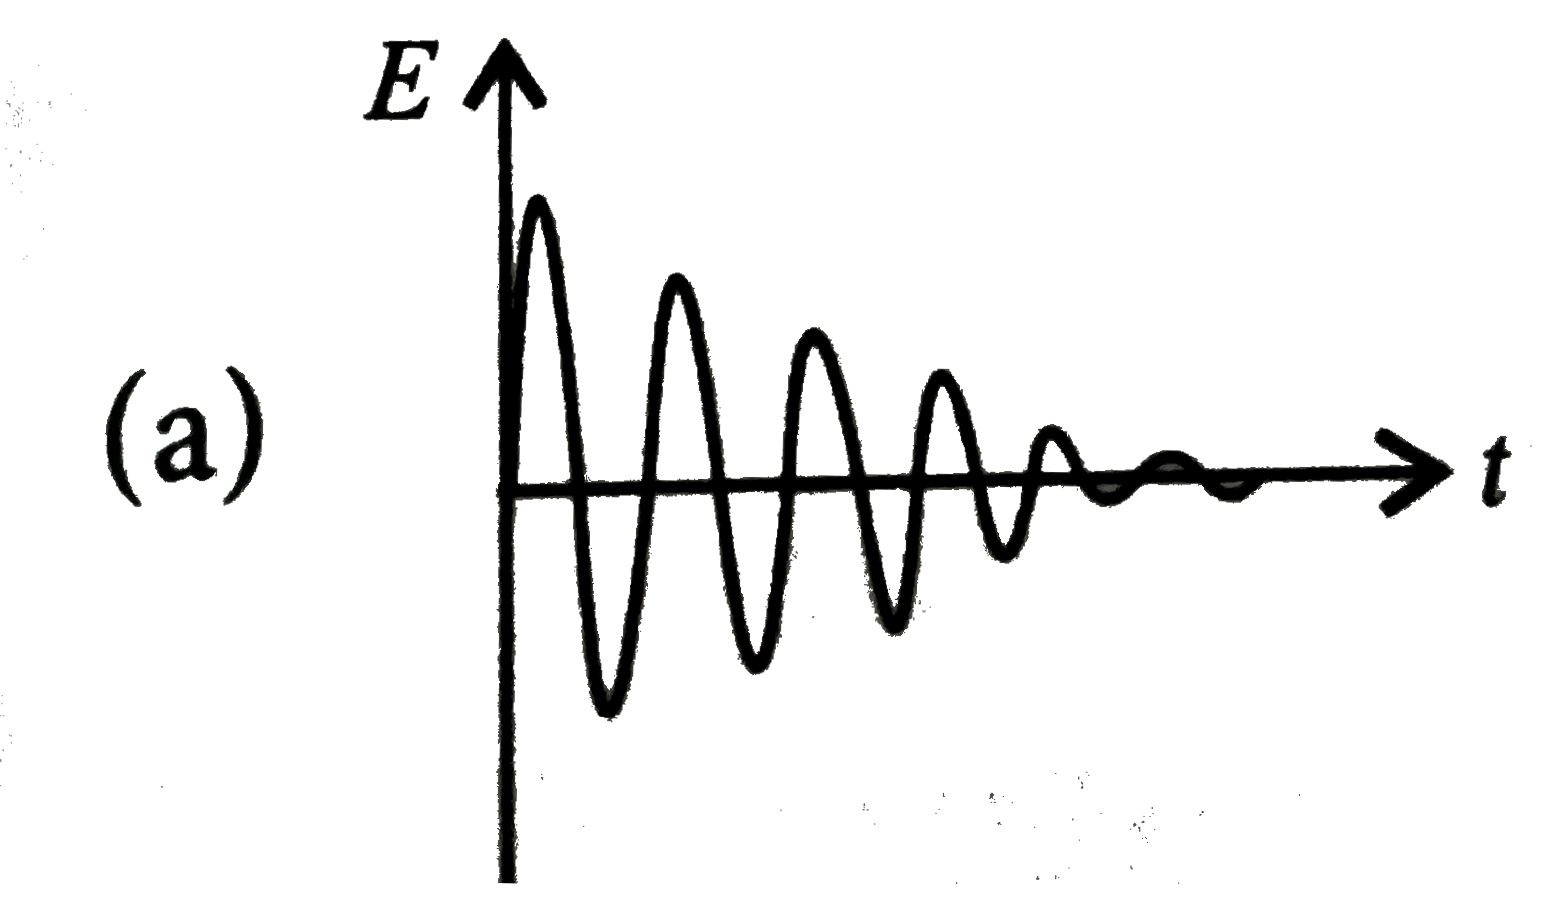
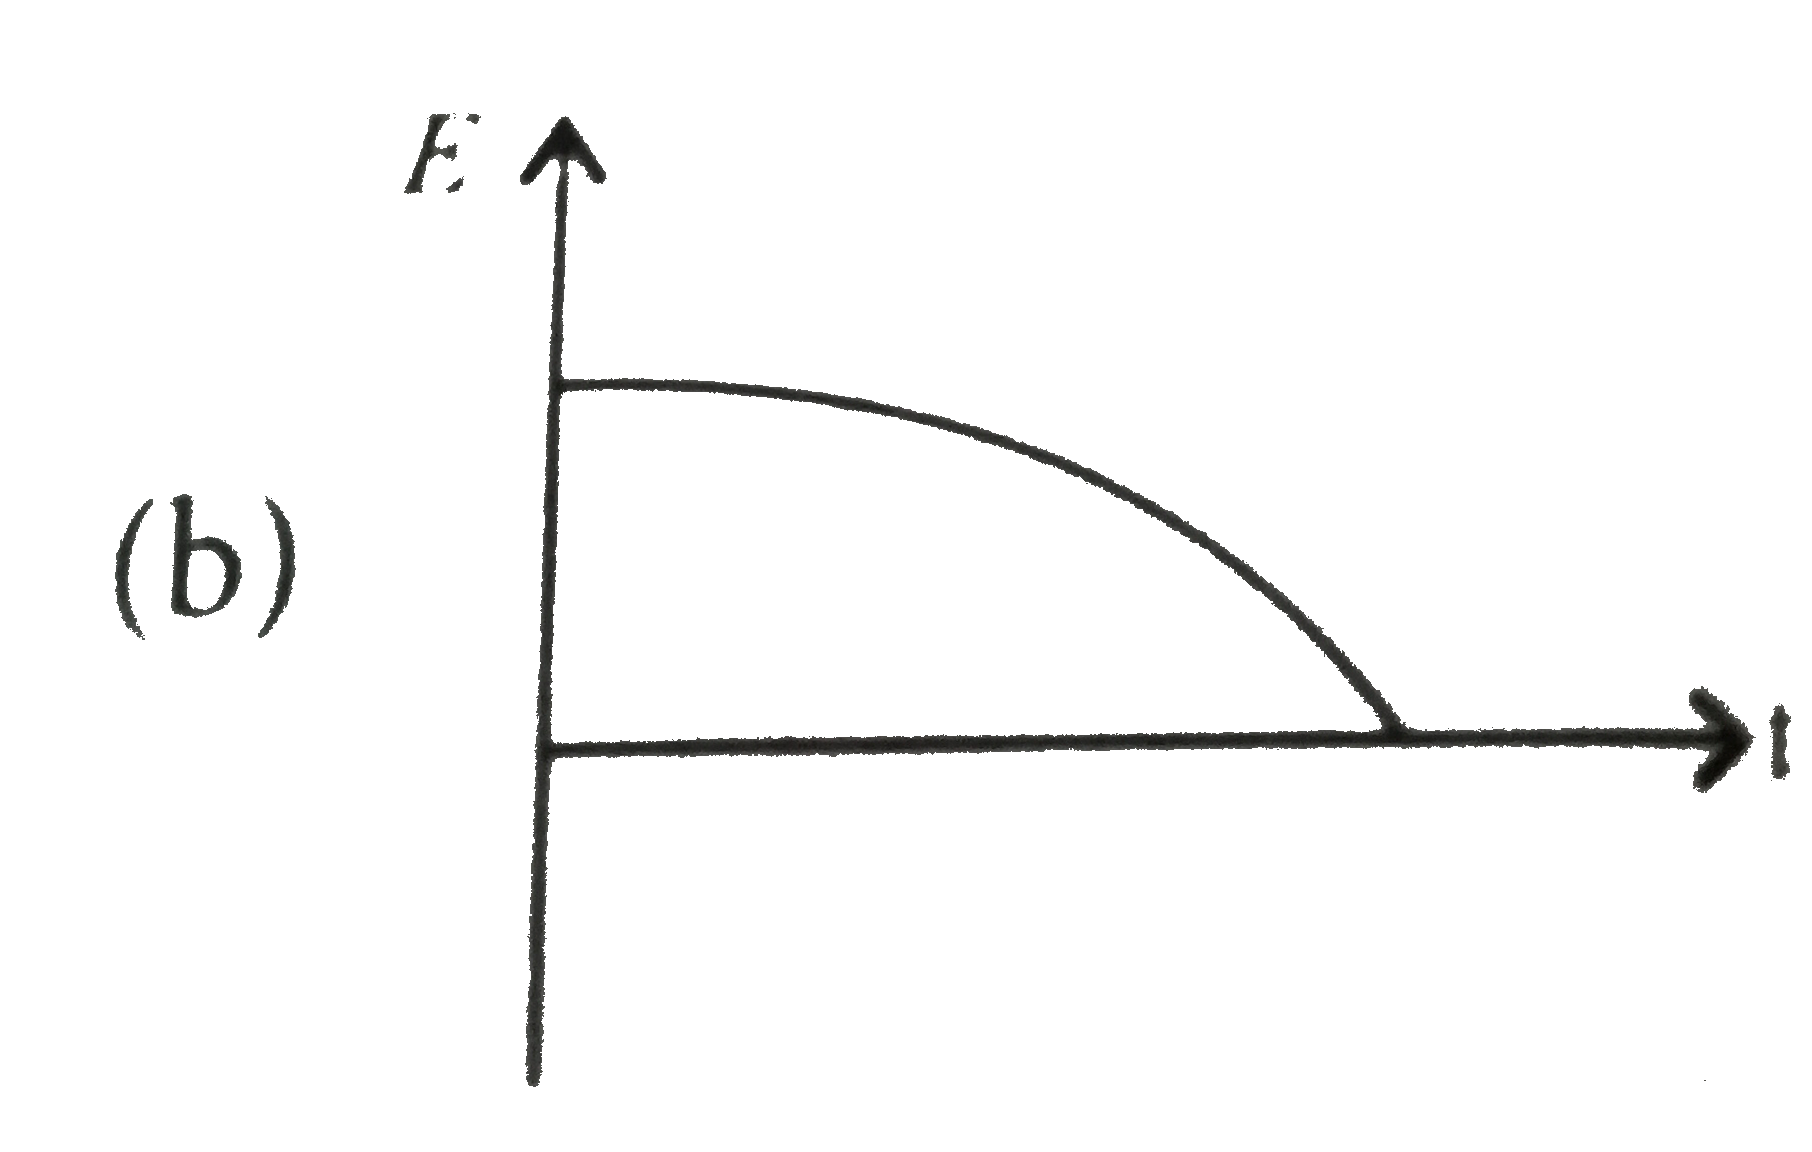
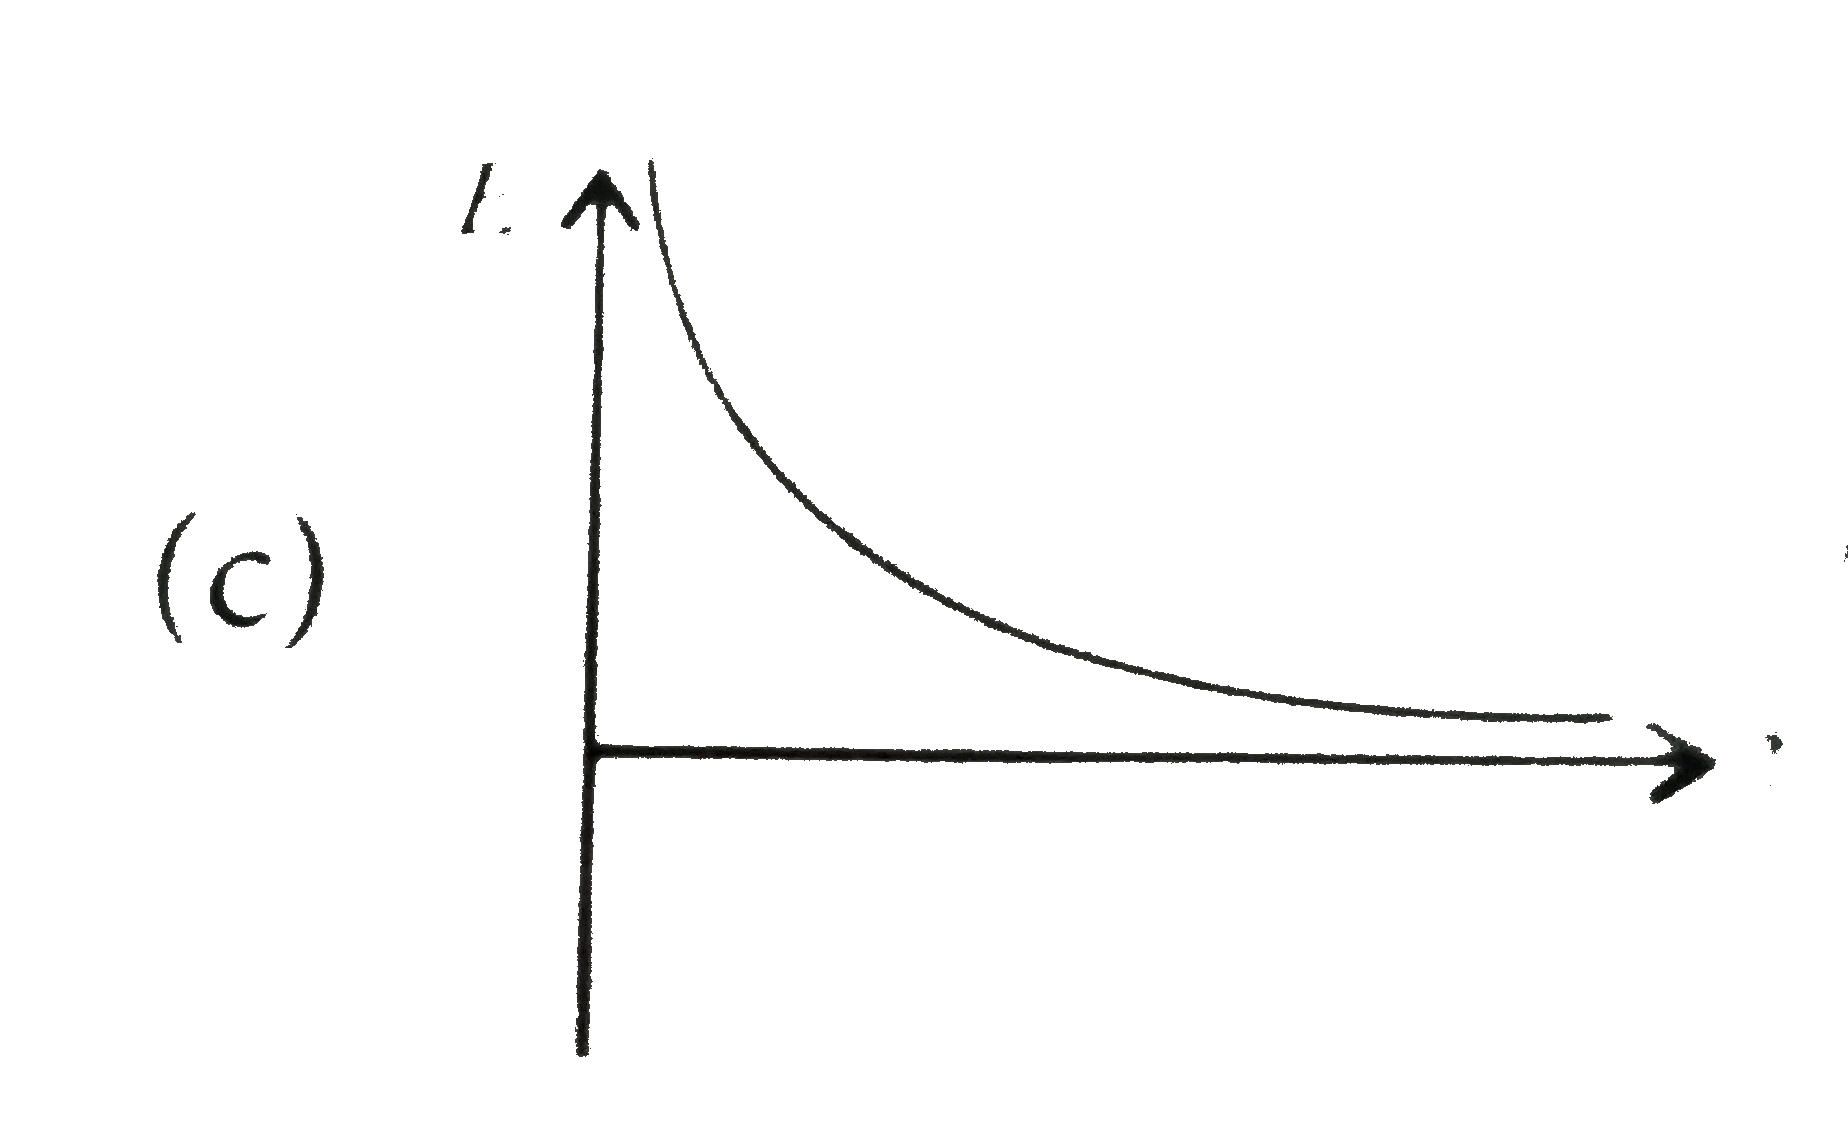
The correct Answer is:C
When a pendulum is oscillating in air, its total mechanical energy decreases exponentially with time. Hence, option (c) represents correct diagram.
Topper's Solved these Questions
- WORK , ENERGY AND POWERBOOK - NCERT FINGERTPS ENGLISHCHAPTER - WORK , ENERGY AND POWEREXERCISE - ASSERTION & REASON
15 Videos
- WORK , ENERGY AND POWERBOOK - NCERT FINGERTPS ENGLISHCHAPTER - WORK , ENERGY AND POWEREXERCISE - Motion Of Work And Kinetic Energy : The Work-Energy Theorem
4 Videos
- WORK , ENERGY AND POWERBOOK - NCERT FINGERTPS ENGLISHCHAPTER - WORK , ENERGY AND POWEREXERCISE - Assertion And Reason
15 Videos
- WAVESBOOK - NCERT FINGERTPS ENGLISHCHAPTER - WAVESEXERCISE - Assertion And Reason
15 Videos
Similar Questions
Knowledge Check
Which of the diagrams shown in figure. Most closely shows the variation inkinetic energy of the earth as it moves once around the sun in its elliptical orbit ?
A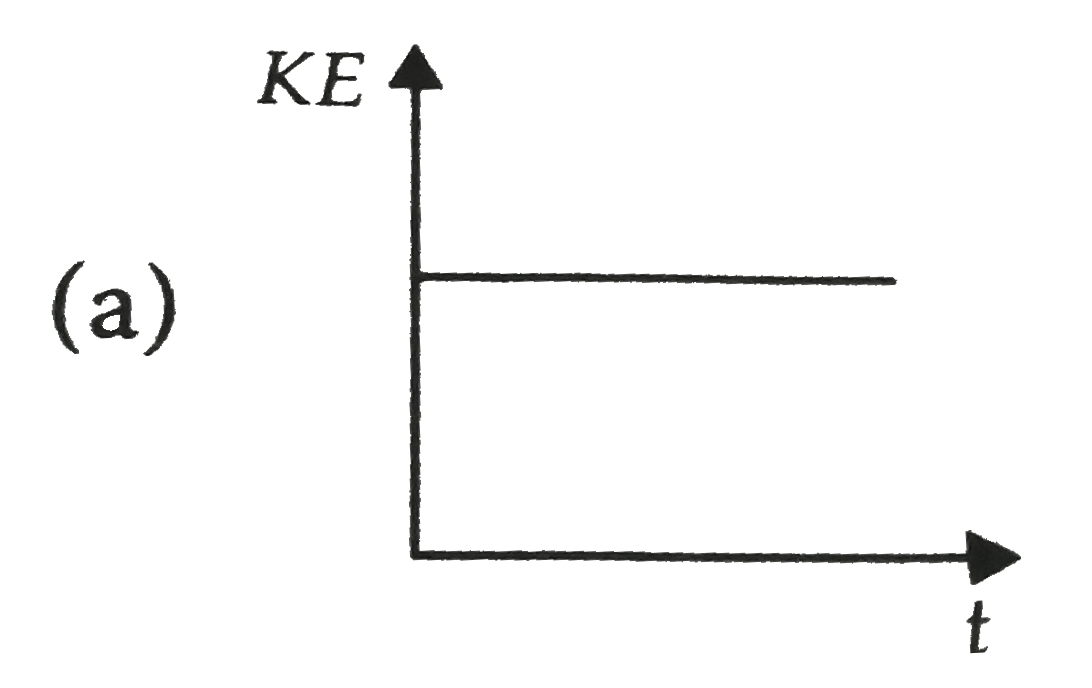 B
B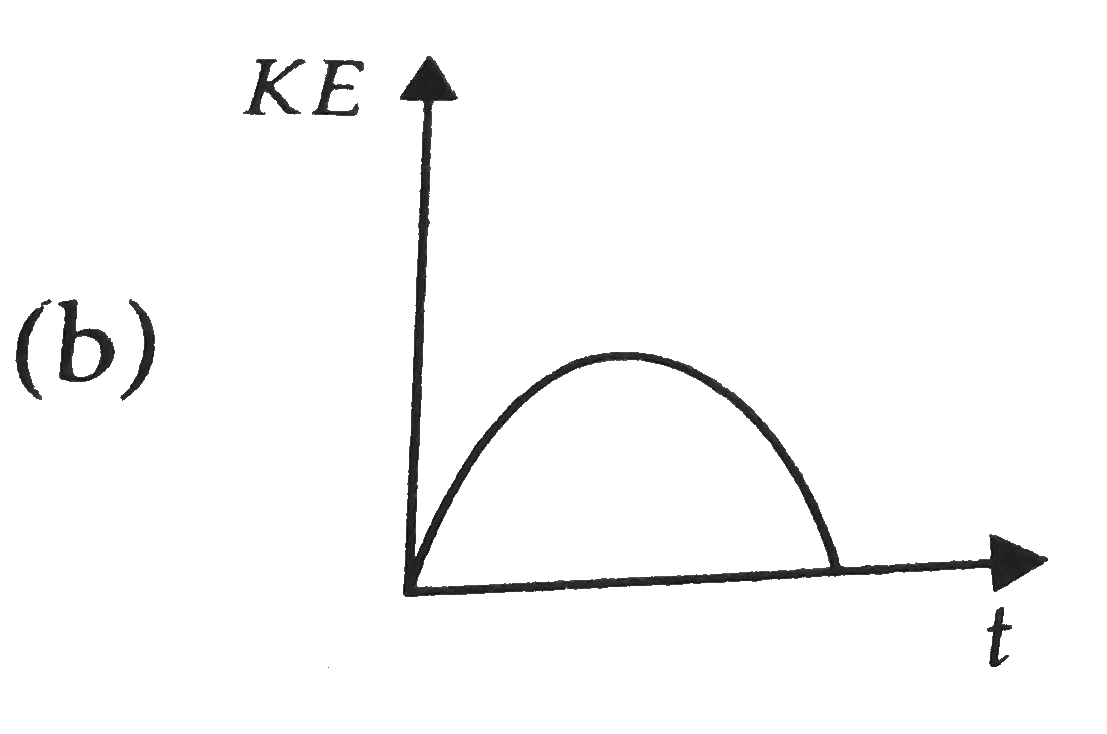 C
C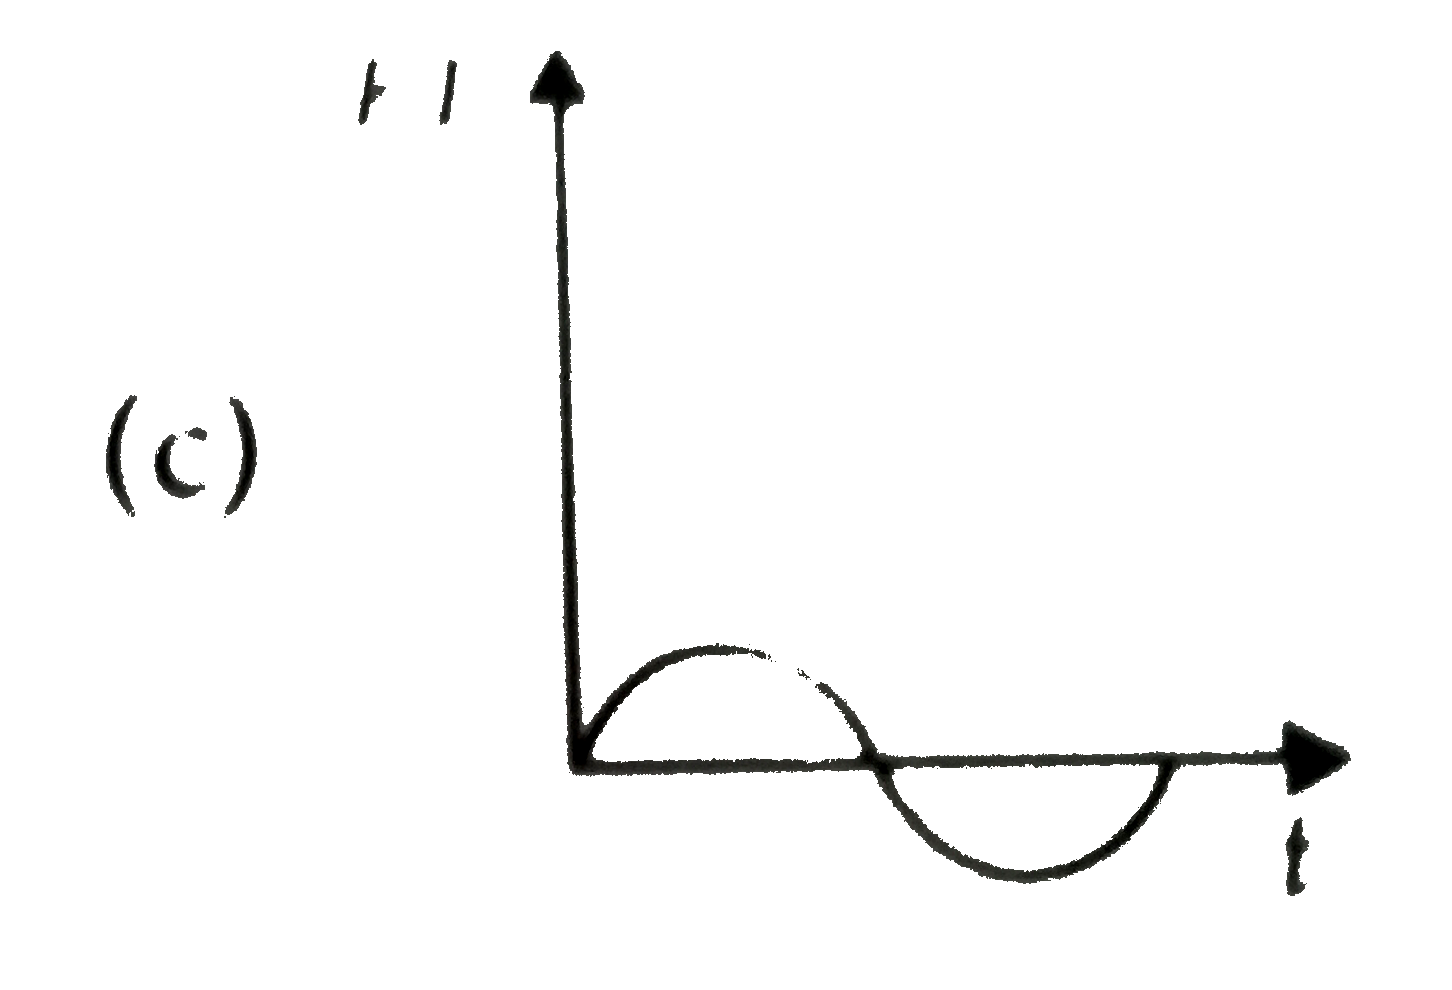 D
D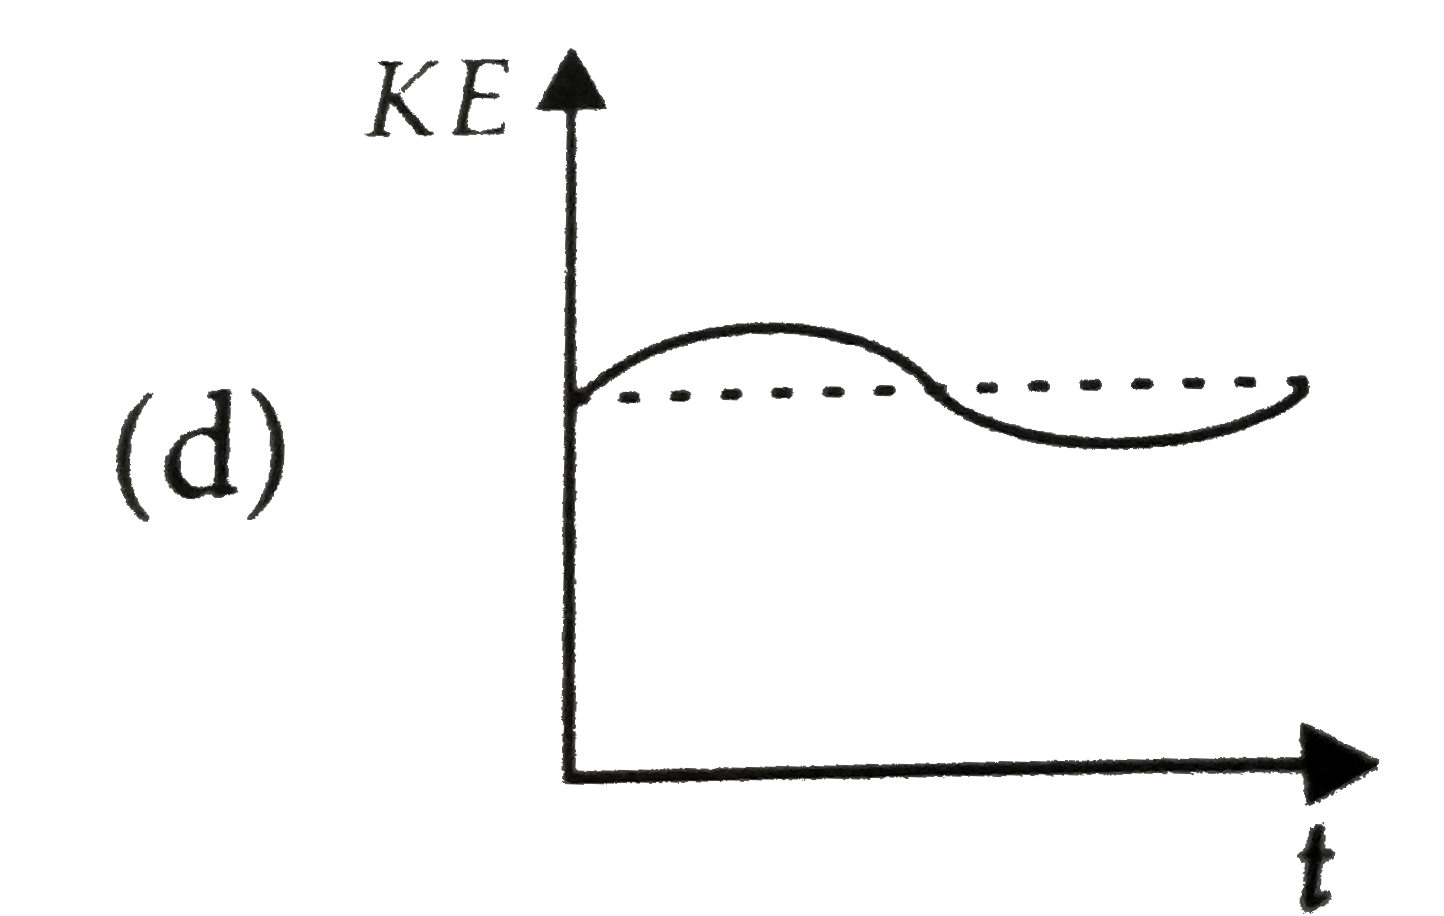
Which of the following diagram correctly represents the variation of internal energy (U) of gas under expansion at constant temperature.
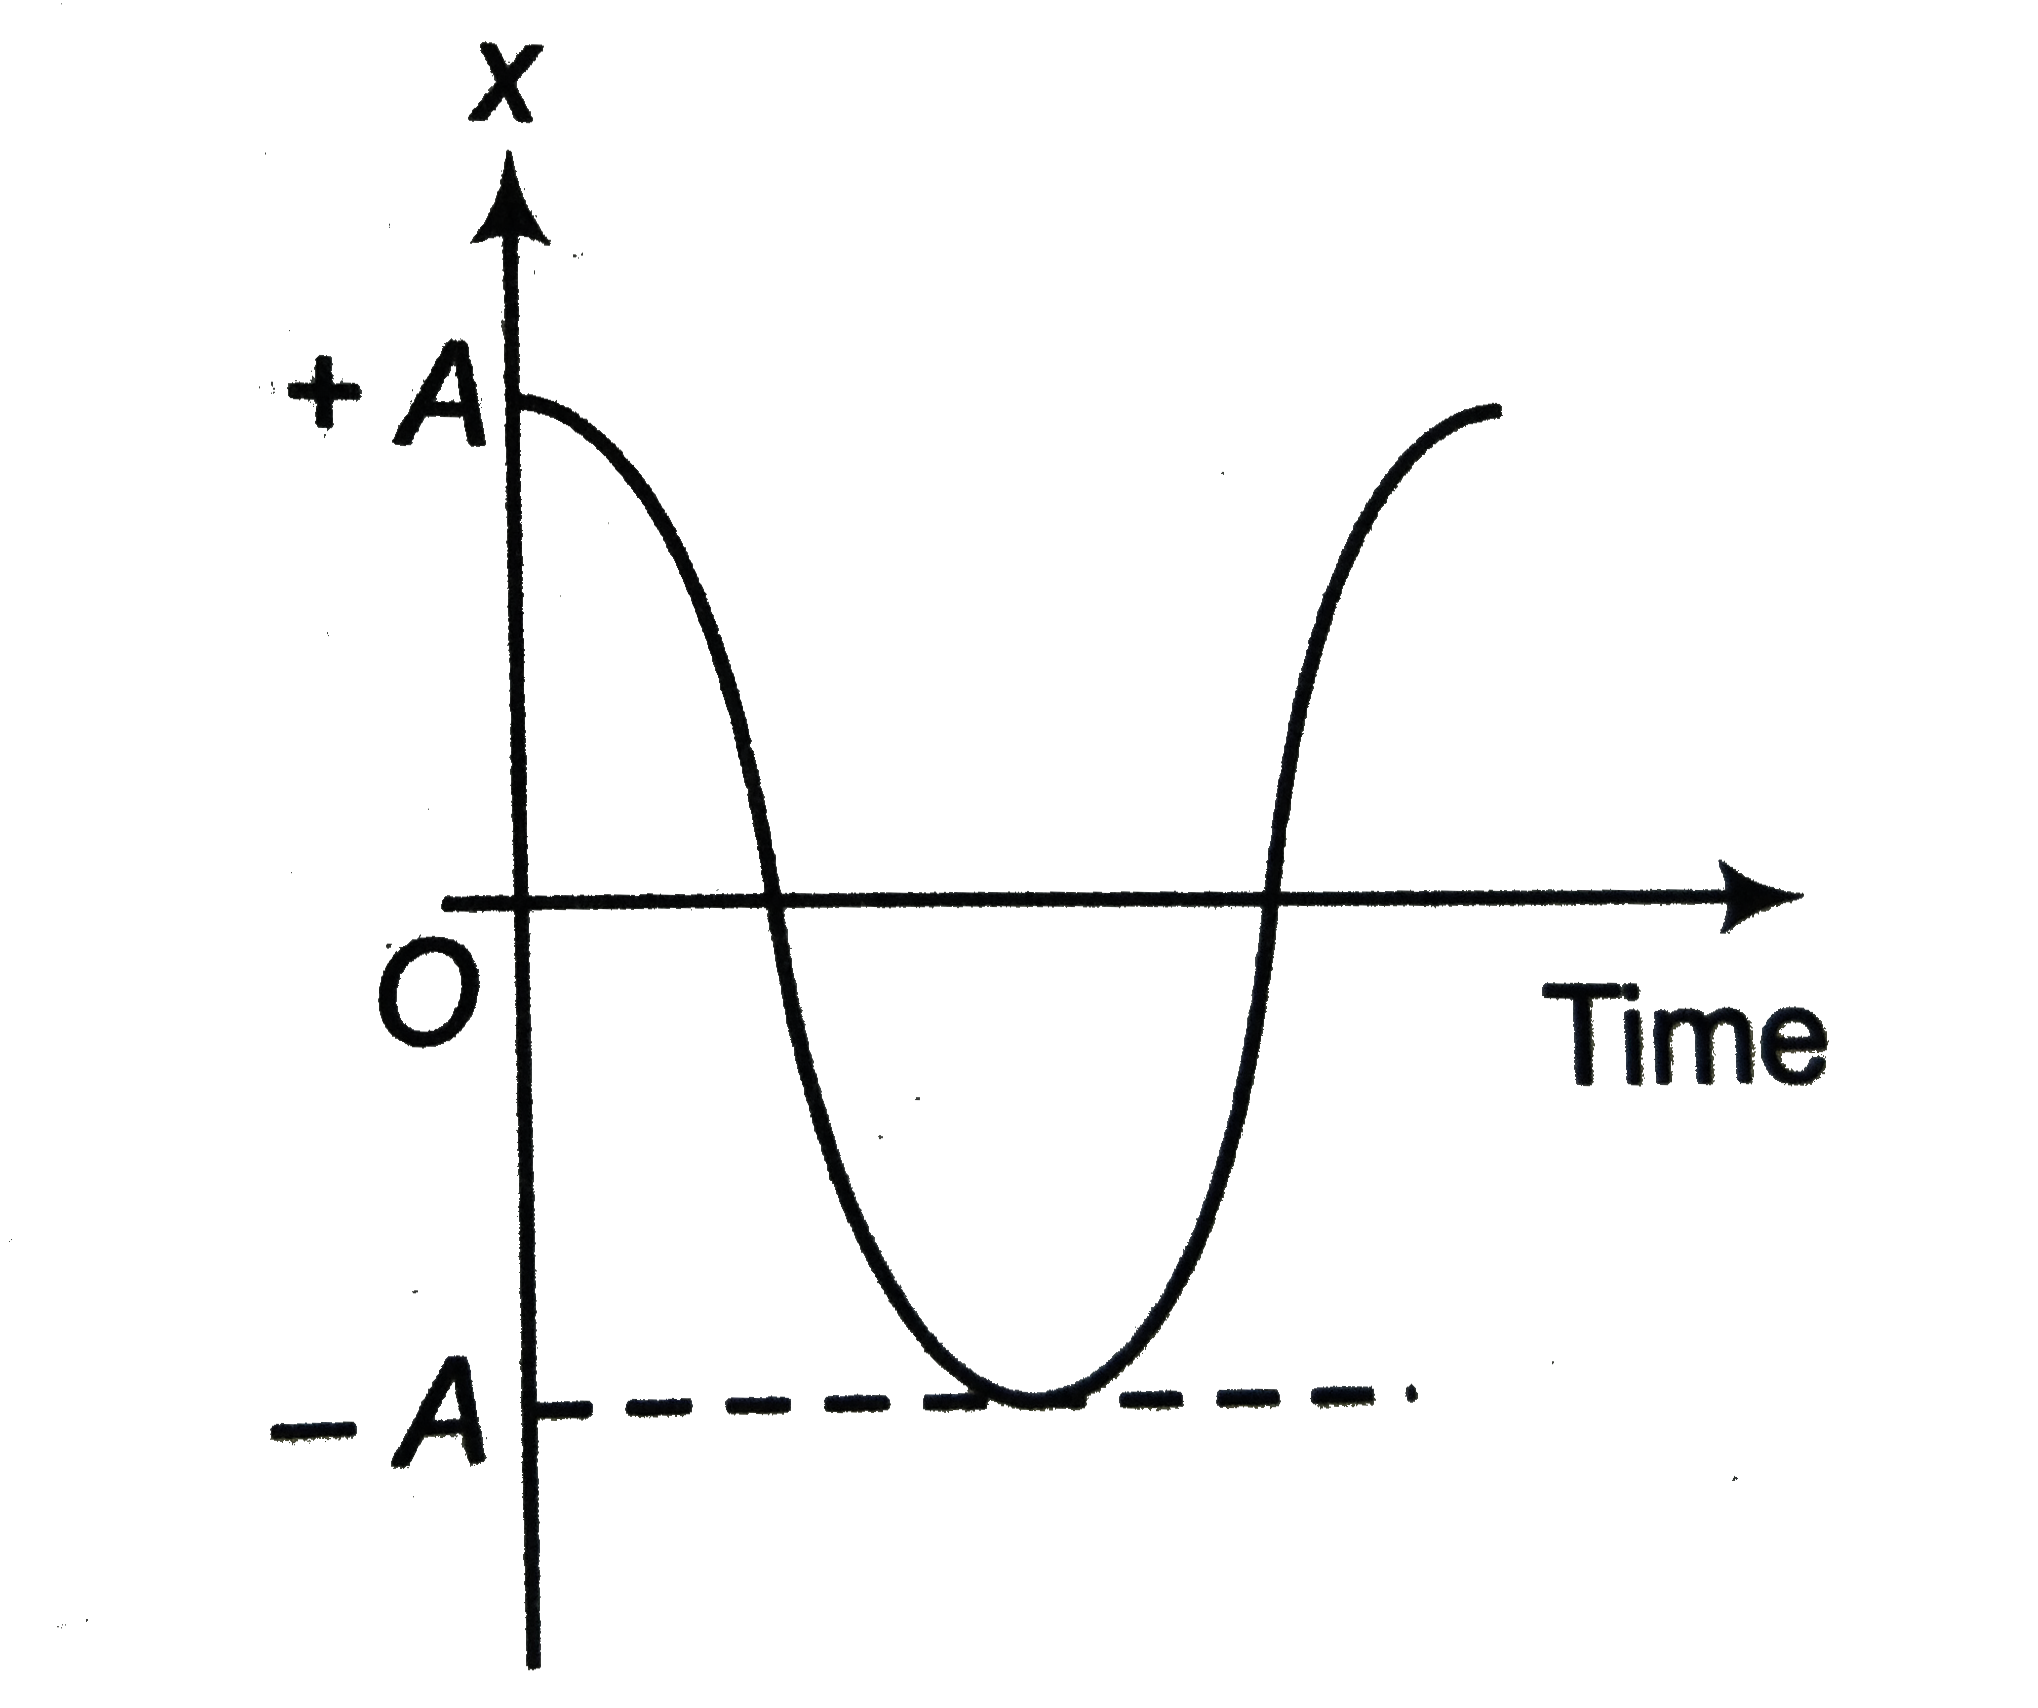
View SolutionThe displacement - time (x−t) graph of a particle executing simple harmonic motion is shown in figure. The correct variation of net force F action on the particle as a function of time is
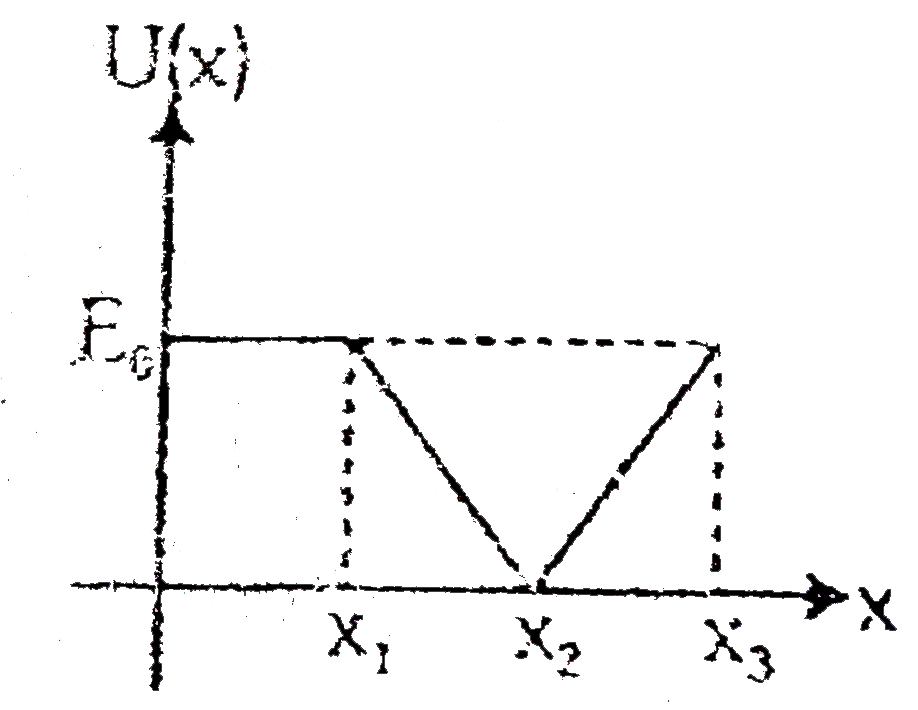
View SolutionThe potential energy U(x) of a particle moving along x−axis is shown in figure. Which one of the following graphs represents the variation of kinetic energy of this particel if its total mechanical enery is E0
View SolutionWhich of the following plotes may represent the thermal energy produced in a resistor in a given time as a function of the electric current? Figure

View SolutionDraw a graph to show the variation of PE, KE and total energy of a simple harmonic oscillator with displacement.
View SolutionA 20g particle is oscillating simple harmonically with a period of 2sec and maximum kinetic energy 2J. The total mechanical energy of the particle is zero , find
a Amplitude of oscillation
b. potential energy as a function of displacement x relative to mean position.
View SolutionIn the shown figure shown
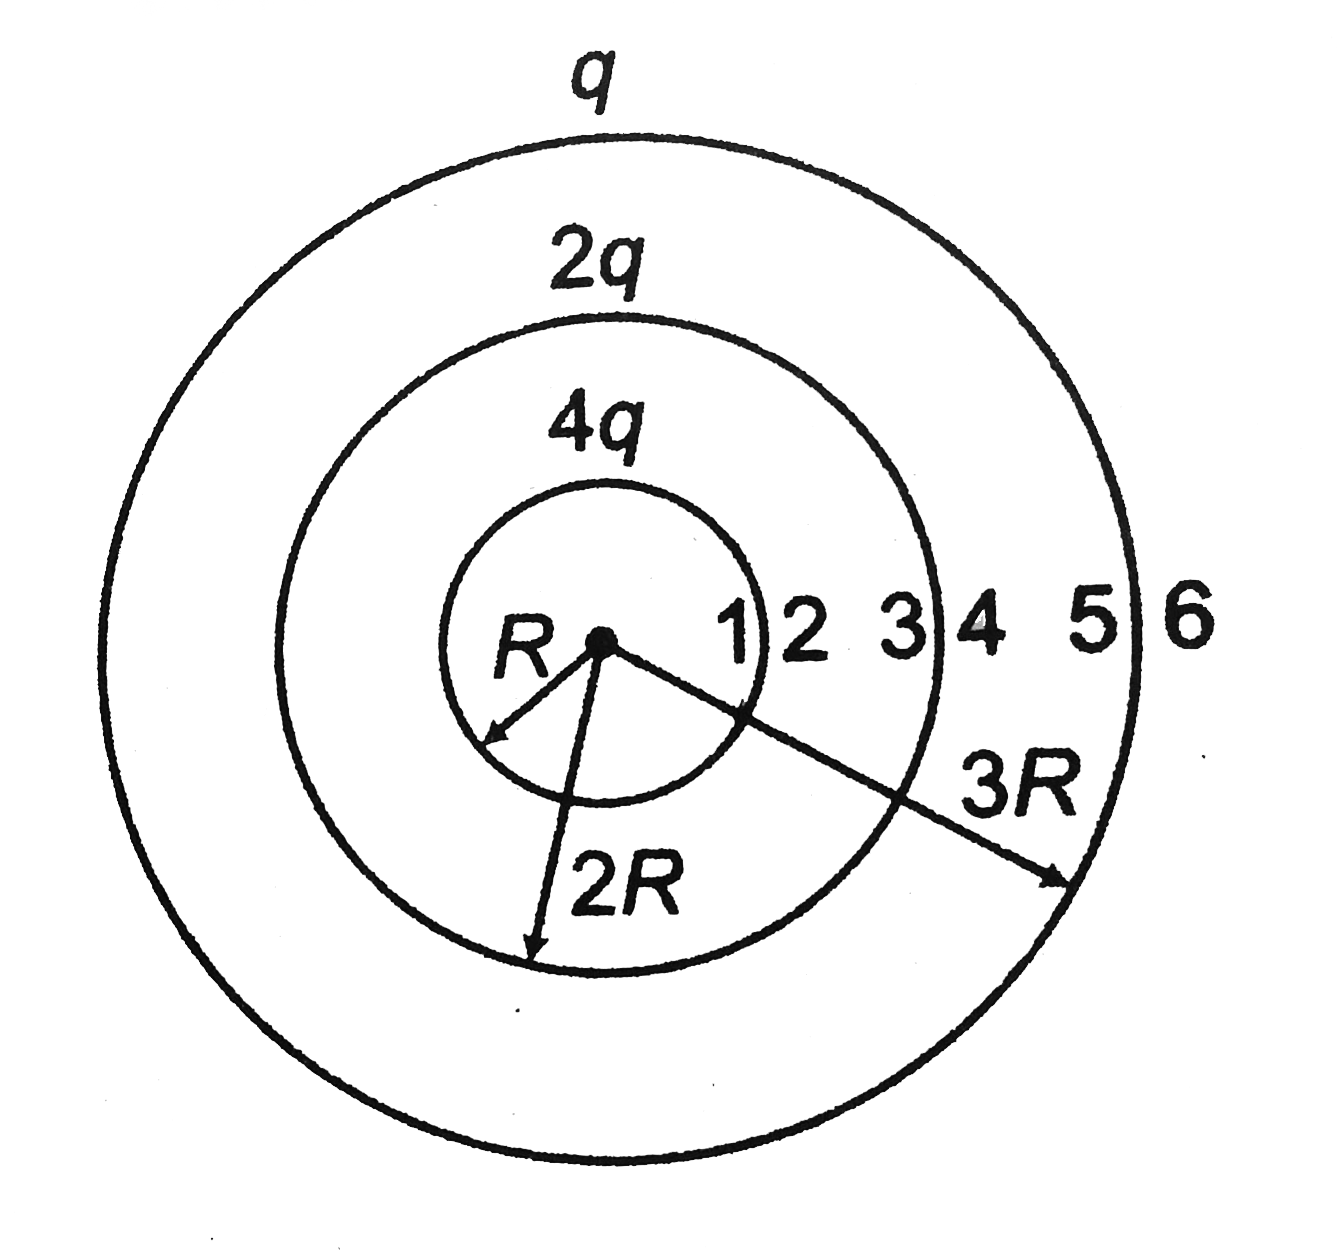
a. Find q1 and q6
b. total electrostatic potential energy .
View Solution
