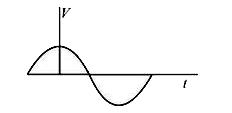
Voltage across a capacitor varies as shown in the diagram. Which diagram correctly represents the current time curve?


The correct Answer is:C
We know current leads by π2angle
So, i=i0cos(ωt+π2)=−i0sinωt .
Topper's Solved these Questions
- MOCK TEST 2BOOK - VMC MODULES ENGLISHCHAPTER - MOCK TEST 2EXERCISE - PART I : PHYSICS (SECTION - 2)
10 Videos
- MOCK TEST 13BOOK - VMC MODULES ENGLISHCHAPTER - MOCK TEST 13EXERCISE - PHYSICS ( SECTION -2)
5 Videos
- MOCK TEST 3BOOK - VMC MODULES ENGLISHCHAPTER - MOCK TEST 3EXERCISE - PART I : PHYSICS (SECTION-2)
10 Videos
Similar Questions
The magnetic flux through a coil varies with timet as shown in the diagram. Which graph best represents the variation of the e.m.f. E induced in the coil with time t?
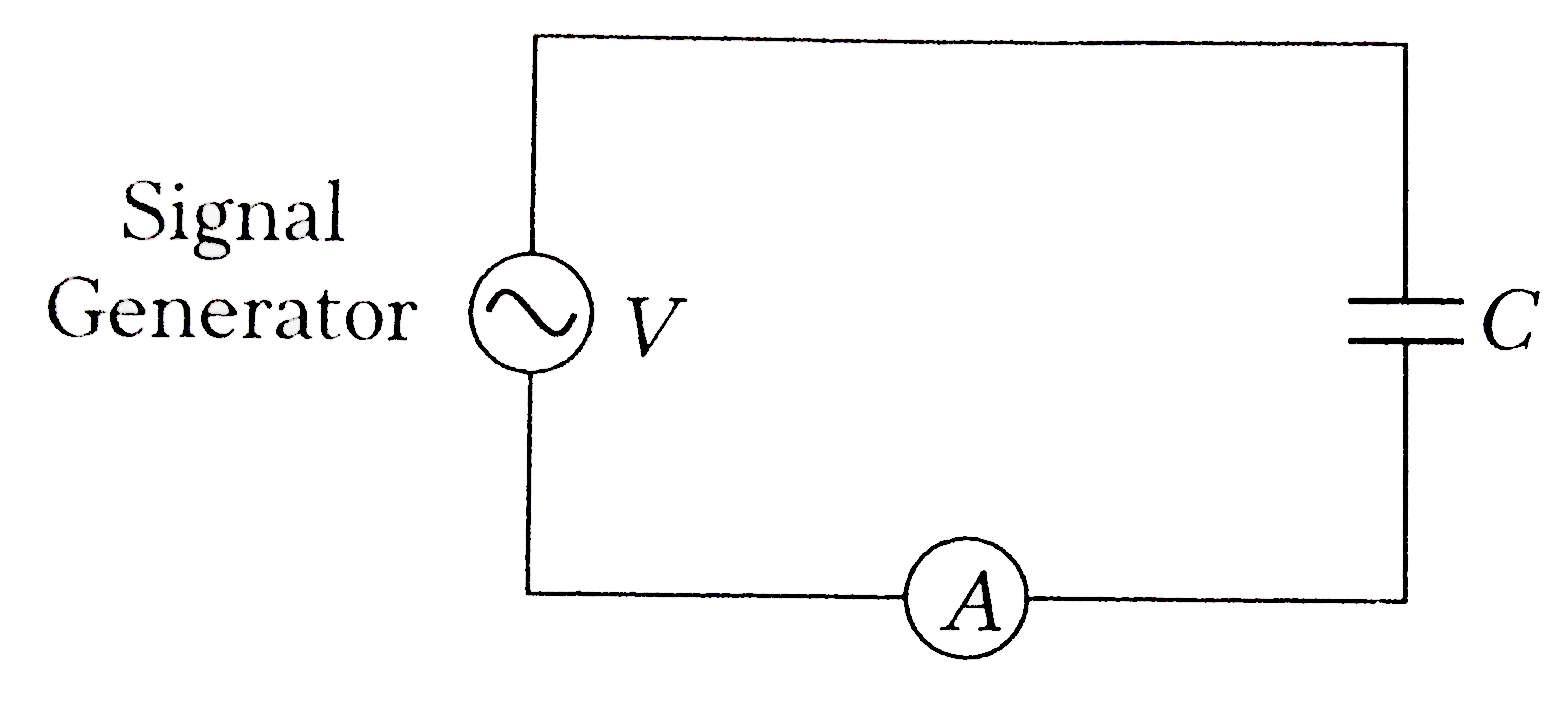
View SolutionA constant voltage at different frequencies is applied across a capacitance. C as shown in the figure. Which of the following graphs correctly depicts the varitaion of current with frequency?
View Solution
Knowledge Check
Which energy diagram best represents the given reaction ?
 A
A B
B C
C D
D
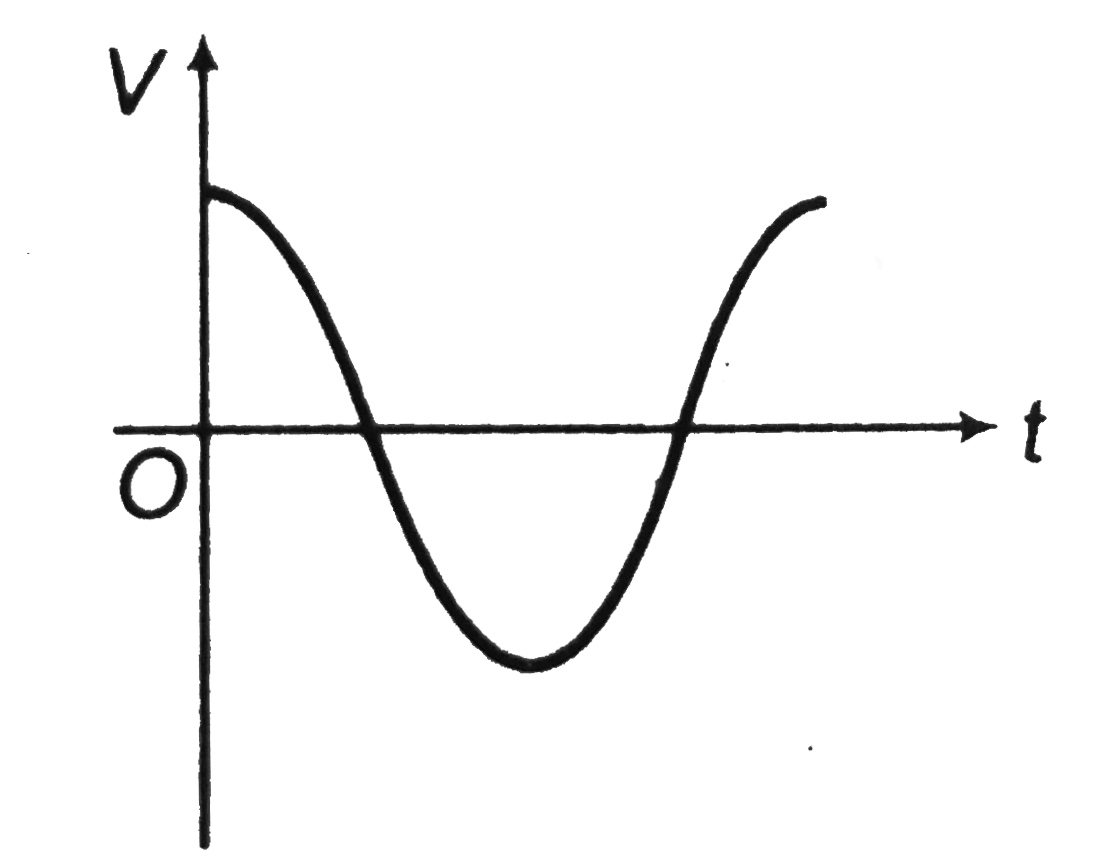
The figure represents the voltage applied across a pure inductor. The diagram which correctly represents the variation of curent i with time t is given by
 .
.
View SolutionThe given diagram represents

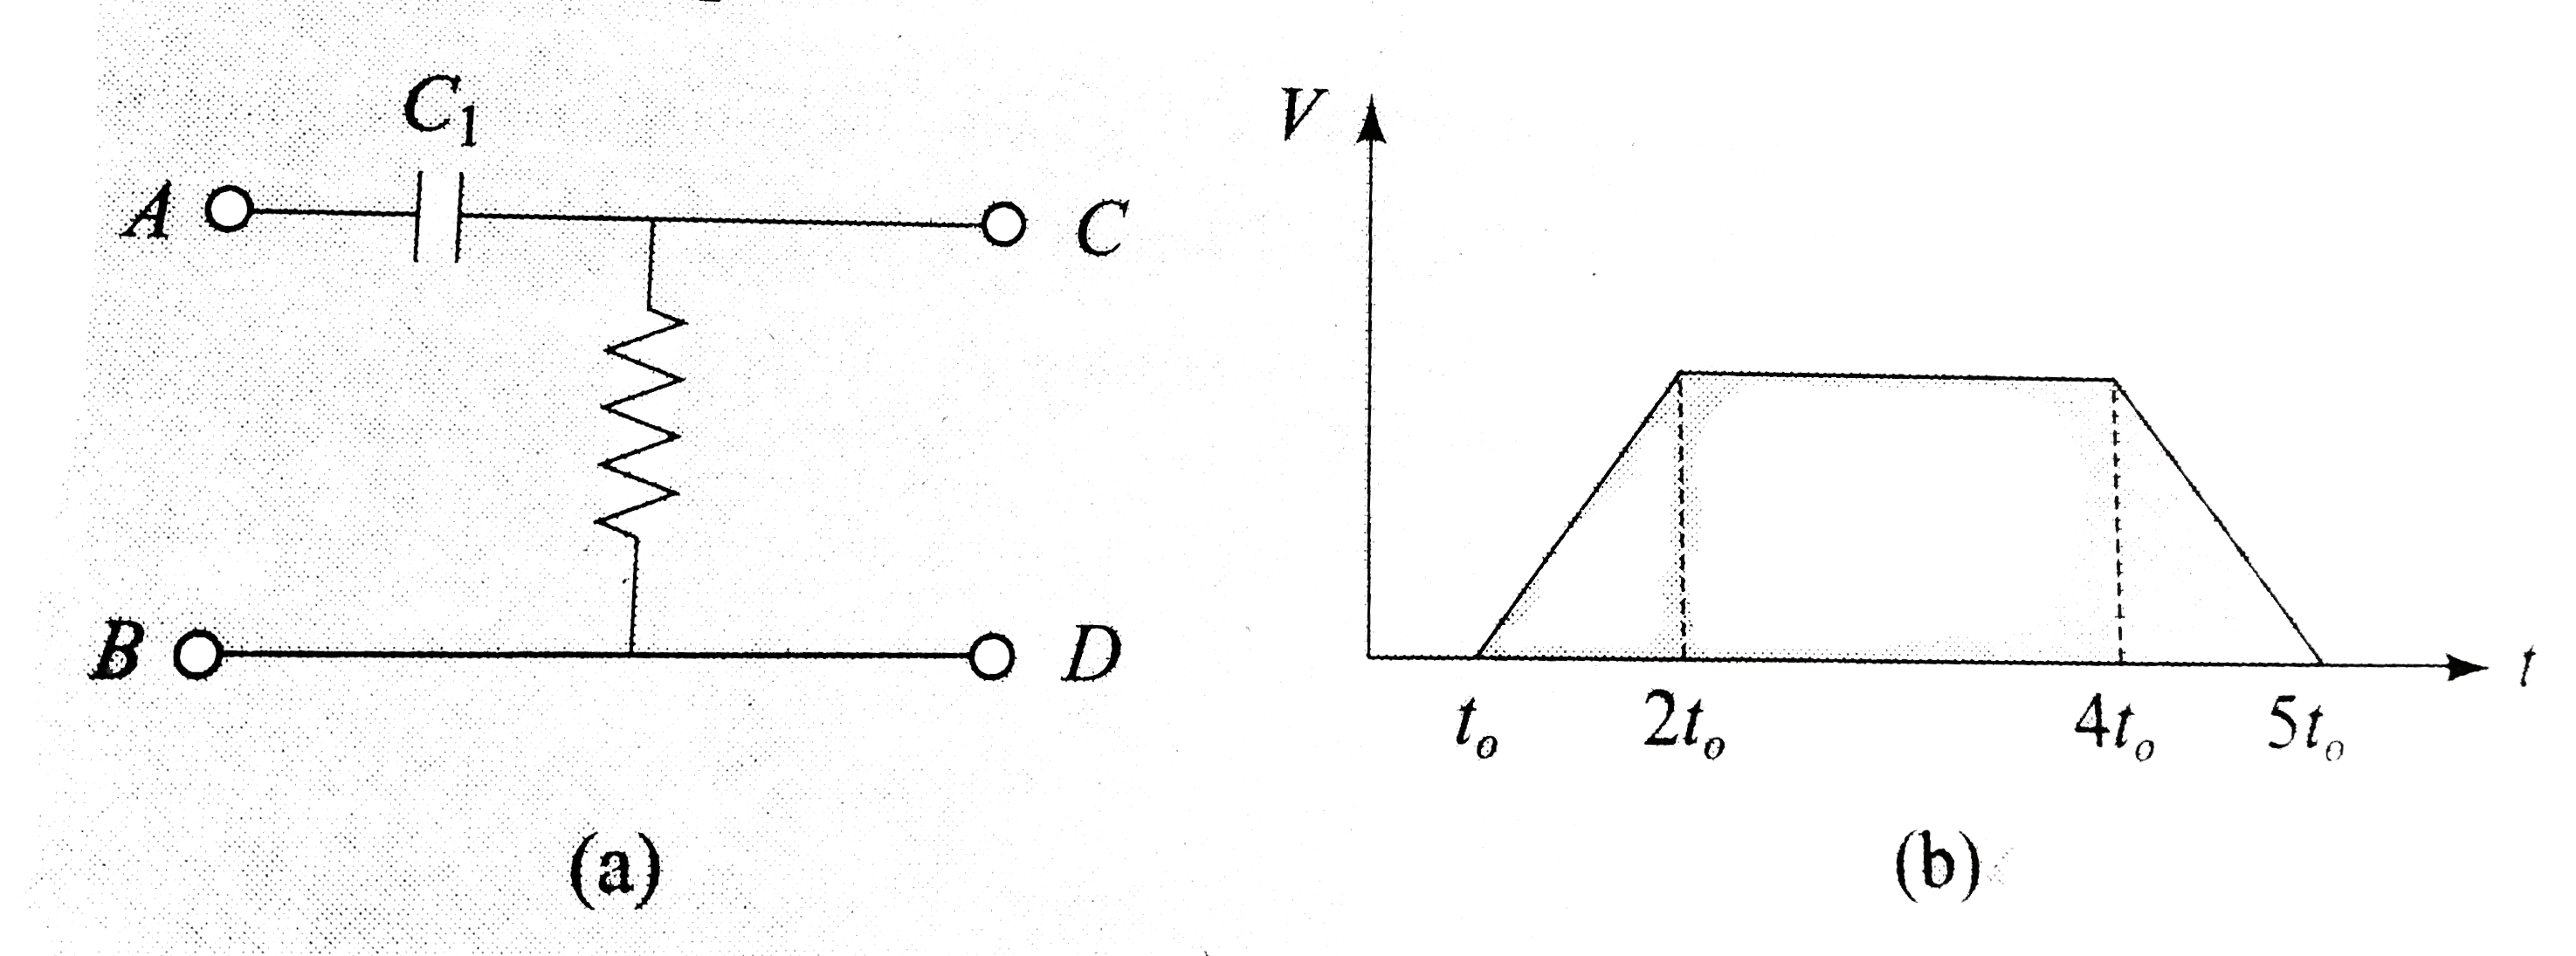
View SolutionA varying voltage is applied to the clamps AB as shown in fig. such that the voltage across the capacitor plates varies as shown in the figure. Plot the time depending on voltage across the clapes CD.

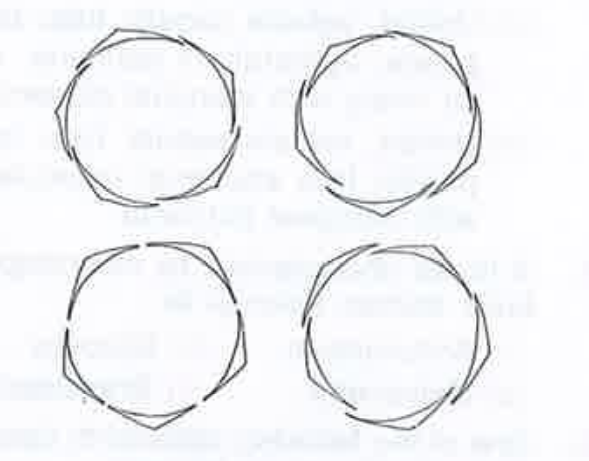
View SolutionWhich type of aestivation is shown in the diagram ?
View SolutionA cyclic process ABCD is shown in the P−V diagram. Which of the following curves represents the same process?
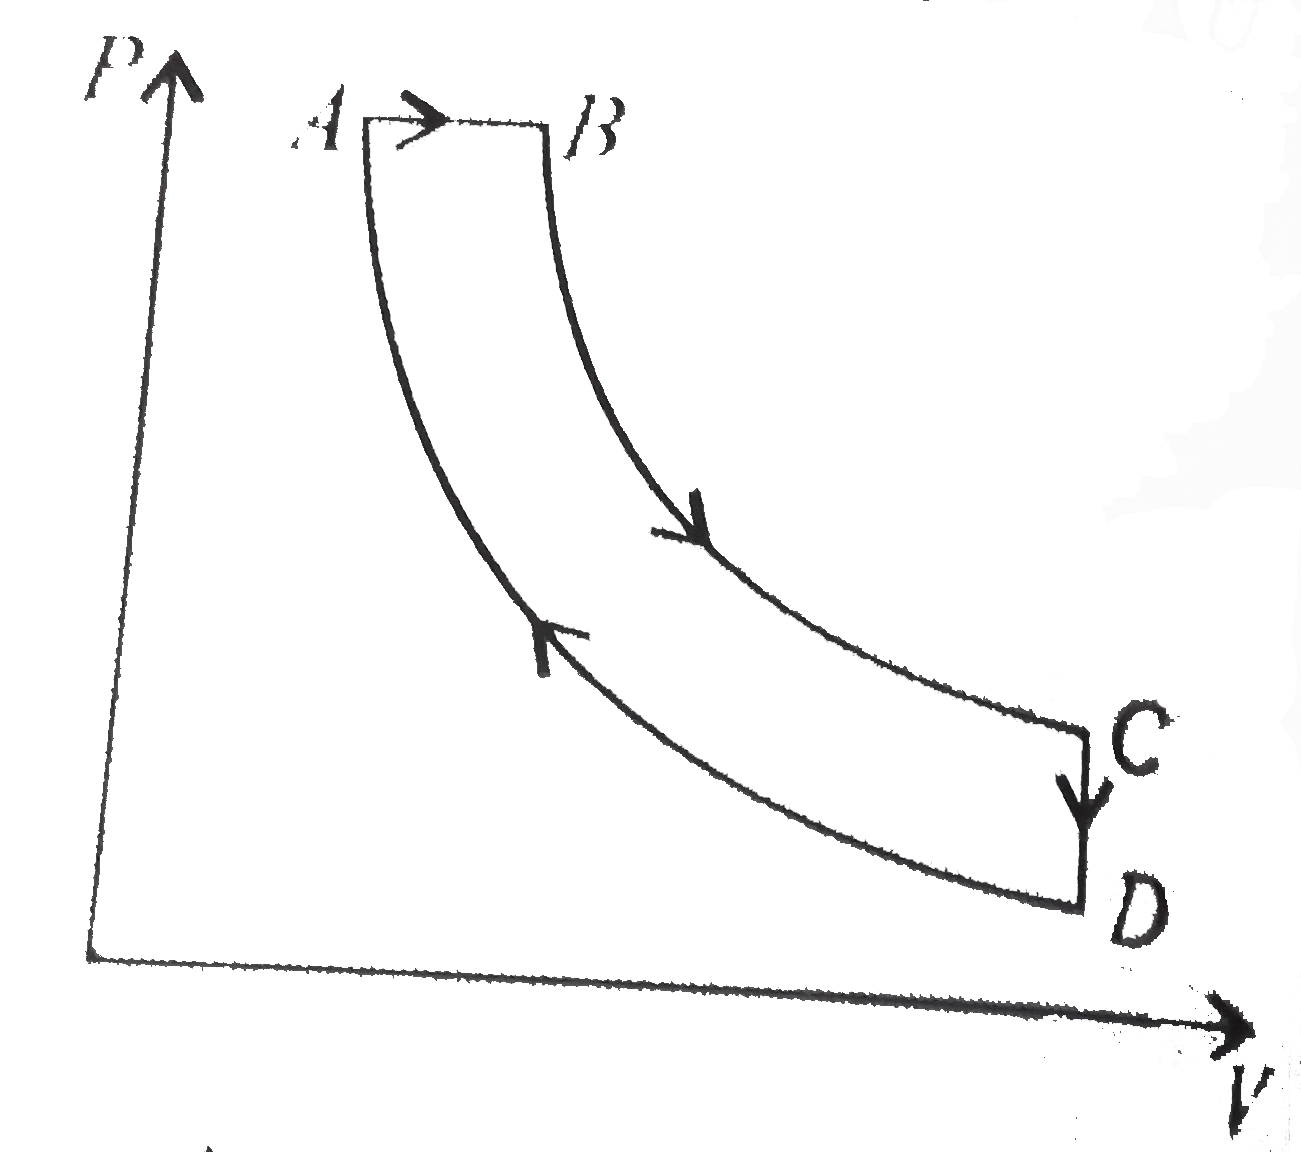
View SolutionA cyclic process ABCD is shown in the P−V diagram. Which of the following curves represents the same process?

View SolutionChoose the diagram which correctly depicts anaphase I
View Solution
