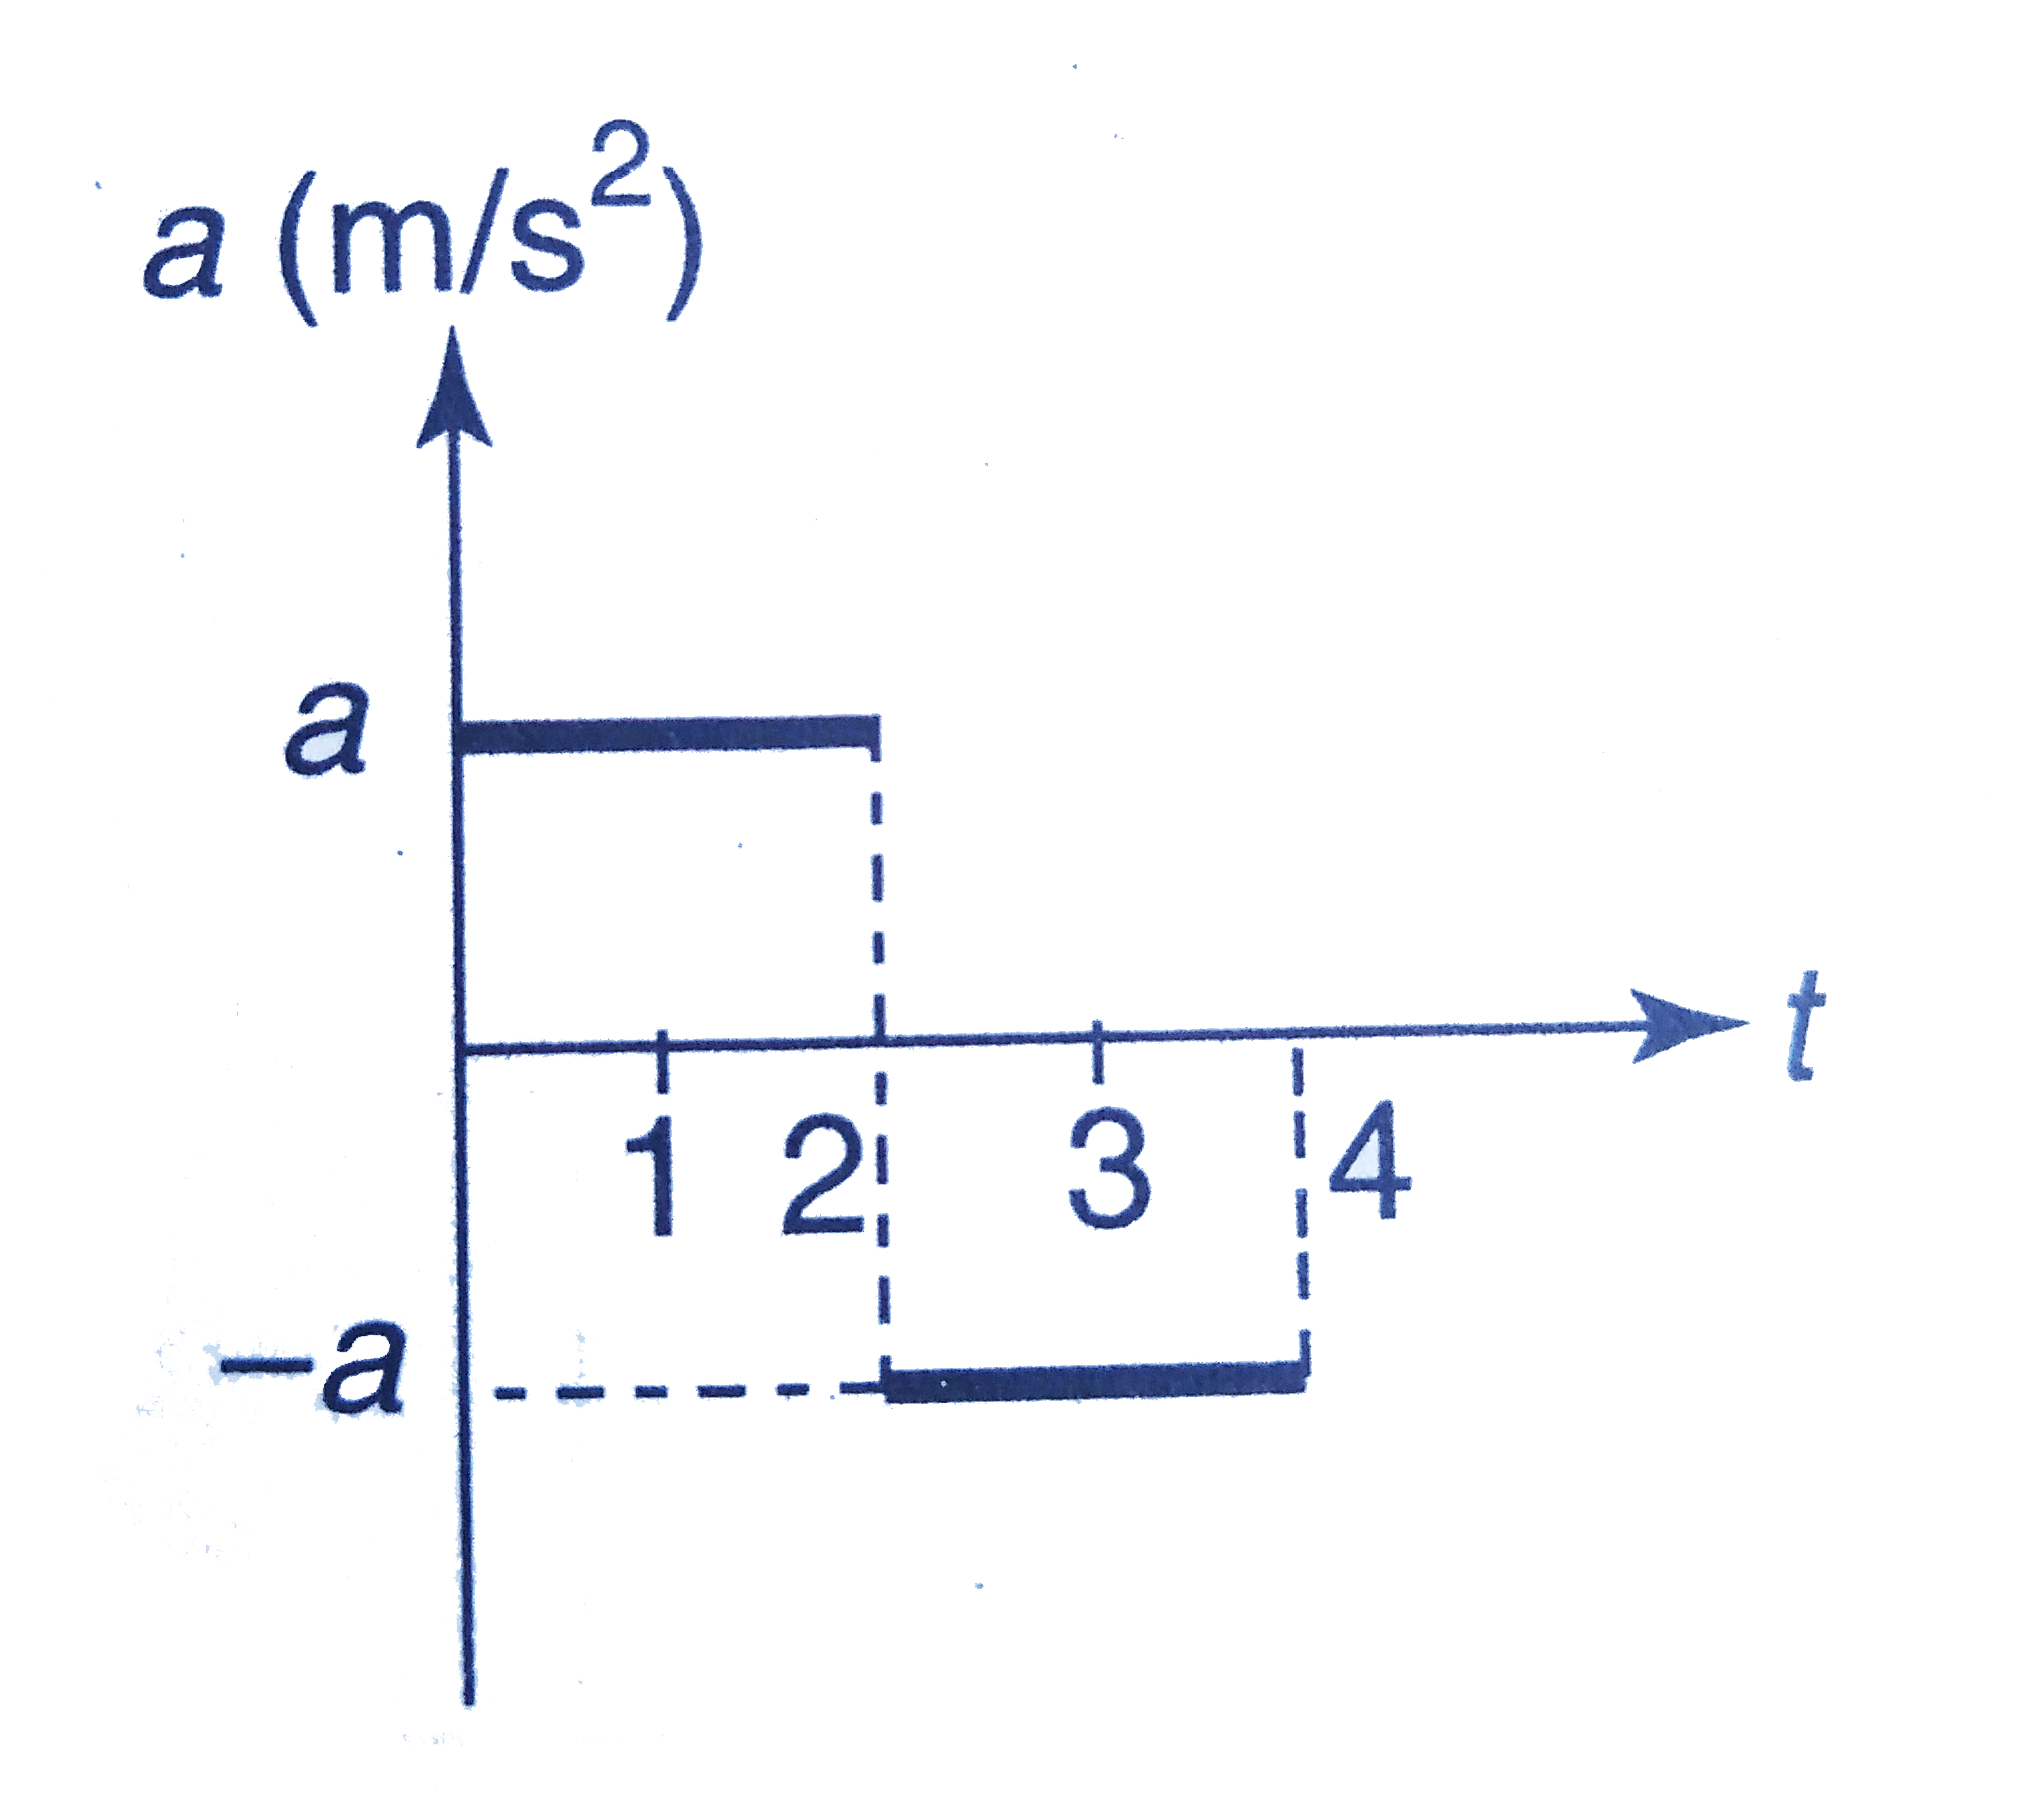
The a -t graph is shown in the figure. The maximum velocity attained by the body from rest will be
 Solution in Telugu
Area under acceleration -time graph gives change in velocity.
V−0=12×11×10=55m/s
Topper's Solved these Questions
- MOTION IN A STRAIGHT LINEBOOK - AAKASH SERIESCHAPTER - MOTION IN A STRAIGHT LINEEXERCISE - Problems Based On Calculus
28 Videos
- MOTION IN A STRAIGHT LINEBOOK - AAKASH SERIESCHAPTER - MOTION IN A STRAIGHT LINEEXERCISE - Exercise 1A
62 Videos
- MOTION IN A PLANE BOOK - AAKASH SERIESCHAPTER - MOTION IN A PLANE EXERCISE - Practice Exercise
84 Videos
- NEWTONS LAWS OF MOTION BOOK - AAKASH SERIESCHAPTER - NEWTONS LAWS OF MOTION EXERCISE - ADDITIONAL PRACTICE EXERCISE PRACTICE SHEET (ADVANECED) (Matrix Matching Type Questions)
1 Videos
Similar Questions
The motion of a particle along a straight line is described by the function s=6+4t2−t4
in SI units.Find the velocity ,acceleration ,at t=2s,and the average velocity during 3rd second.
View SolutionA particle starts from the origin ,goes along the x-axis to the point (20m,0) and then returns along the same line to the point (-20 m,0).The distance and displacement of the particle during the trip are
View SolutionA person runs along a circular path of radius 5m. Find the magnitude of the displacement if he runs all the way around the circle ?
View SolutionThe system shown in the figure is given an acceleration 'a' towards left. Assume all contact surfaces to be smooth (m: mass of the sphere) The magnitude of the contact force between wedge and sphere between wedge and sphere at A is xmg√3 then 'x' is

View SolutionA body starts from rest at time t = 0 , the acceleration time graph is shown in the figure . The maximum velocity attained by the body will be
View SolutionThe graph shown the variation of velocity of a rocket with time. Then, the maximum height attained by the rocket is.
View SolutionA particle starts from rest and undergoes an acceleration as shown in figure. The velocity-time graph from figure will have a shape.

View SolutionIn figure shown, the graph shows the variation of acceleration of body with time t . The velcocity of the body at t = 0 is zero. The velocity of the body at t = 30 s is.
View SolutionA rocket is projected vertically upwards and its time velocity graph is shown in the figure-1.115. The maximum height attained by the rocket is :
View SolutionA particle starts moving from rest in a from rest in a straight line. Its acceleration vs time (a - t) graph is shown in figure. The speed of particle is maximum at.
View SolutionA particle starting from rest undergoes a rectilinear motion with acceleration a. The variation of a with time t is shown below. The maximum velocity attained by the particle during its motion is
View SolutionThe graph in figure shows the velocity v versus time t for a body. Which of the graphs shown in figure represents the correesponding acceleration versus time graphs ?
View SolutionA rocket is launched upward from the earth surface whose velocity time graph shown in figure. Then maximum height attained by the rocket is :-

View SolutionA rocket is launched upward from the earth surface whose velocity time graph shown in figure. Then maximum height attained by the rocket is :-
View SolutionThe a -t graph is shown in the figure. The maximum velocity attained by the body from rest will be

View SolutionAcceleration -time graph of a body starts from rest as shown below :

Draw the velocity-time graph using the above graph
View Solution
