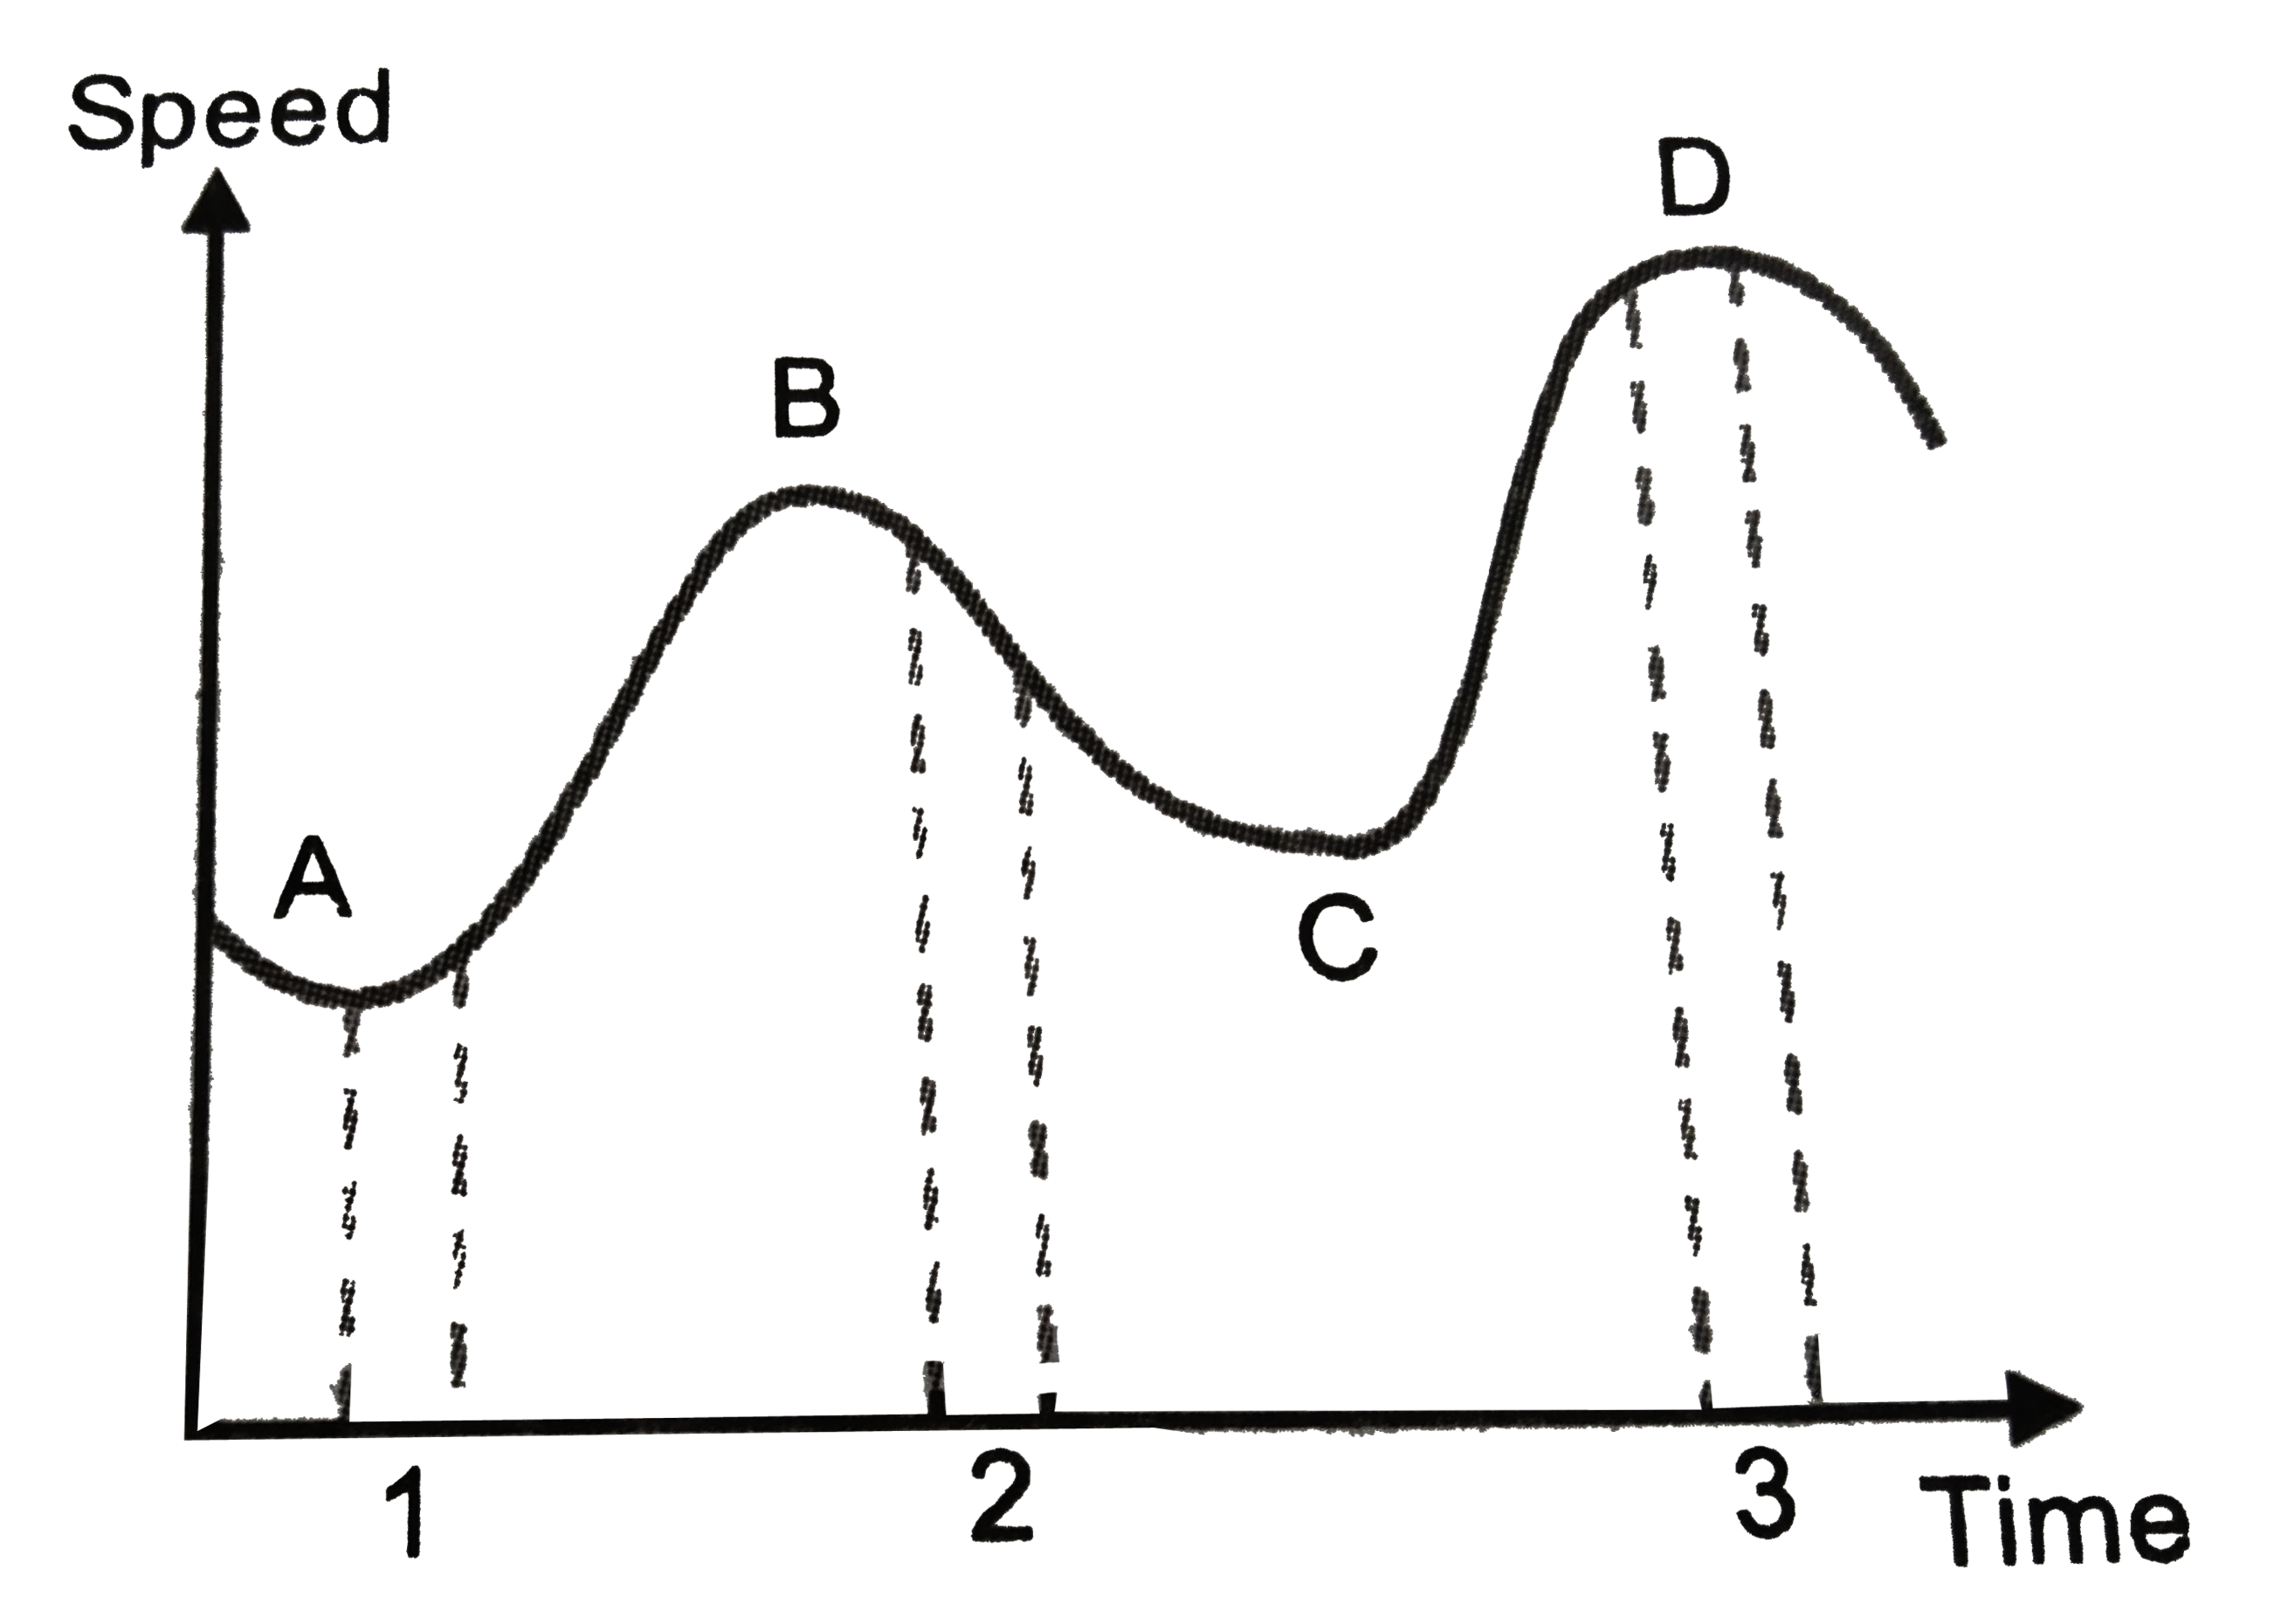
Given a speed-time graph of a particle in one dimensional motion. Three different equal intervals of time are shown. In which interval is the average acceleration greatest in magnitude ? In which interval is the average speed greatest ? Choosing the positive direction as the constant direction of motion, give the signs of u and a in the three intervals. What are the accelerations at the points A,B,C and D ?
 .
.
Step by step video solution for Given a speed-time graph of a particle in one dimensional motion. Three different equal intervals of time are shown. In which interval is the average acceleration greatest in magnitude ? In which interval is the average speed greatest ? Choosing the positive direction as the constant direction of motion, give the signs of u and a in the three intervals. What are the accelerations at the points A, B , C and D ? . by Physics experts to help you in doubts & scoring excellent marks in Class 11 exams.
Updated on:21/07/2023Topper's Solved these Questions
Similar Questions
Fig. 2 (NCT). 10 . Give a speed-tiem graph of a particle in one dimenstional motion. Three different equal intervals of time are shwon. In which interval is the average acceleration graeatest in magnitude ? In which interval is the average speed greatest ? Choosing the positive direction as the constant direction of motion, give the signs of u and a in the three intervals. What are the acclerations at teh points A,B,C and D ?
 .
.
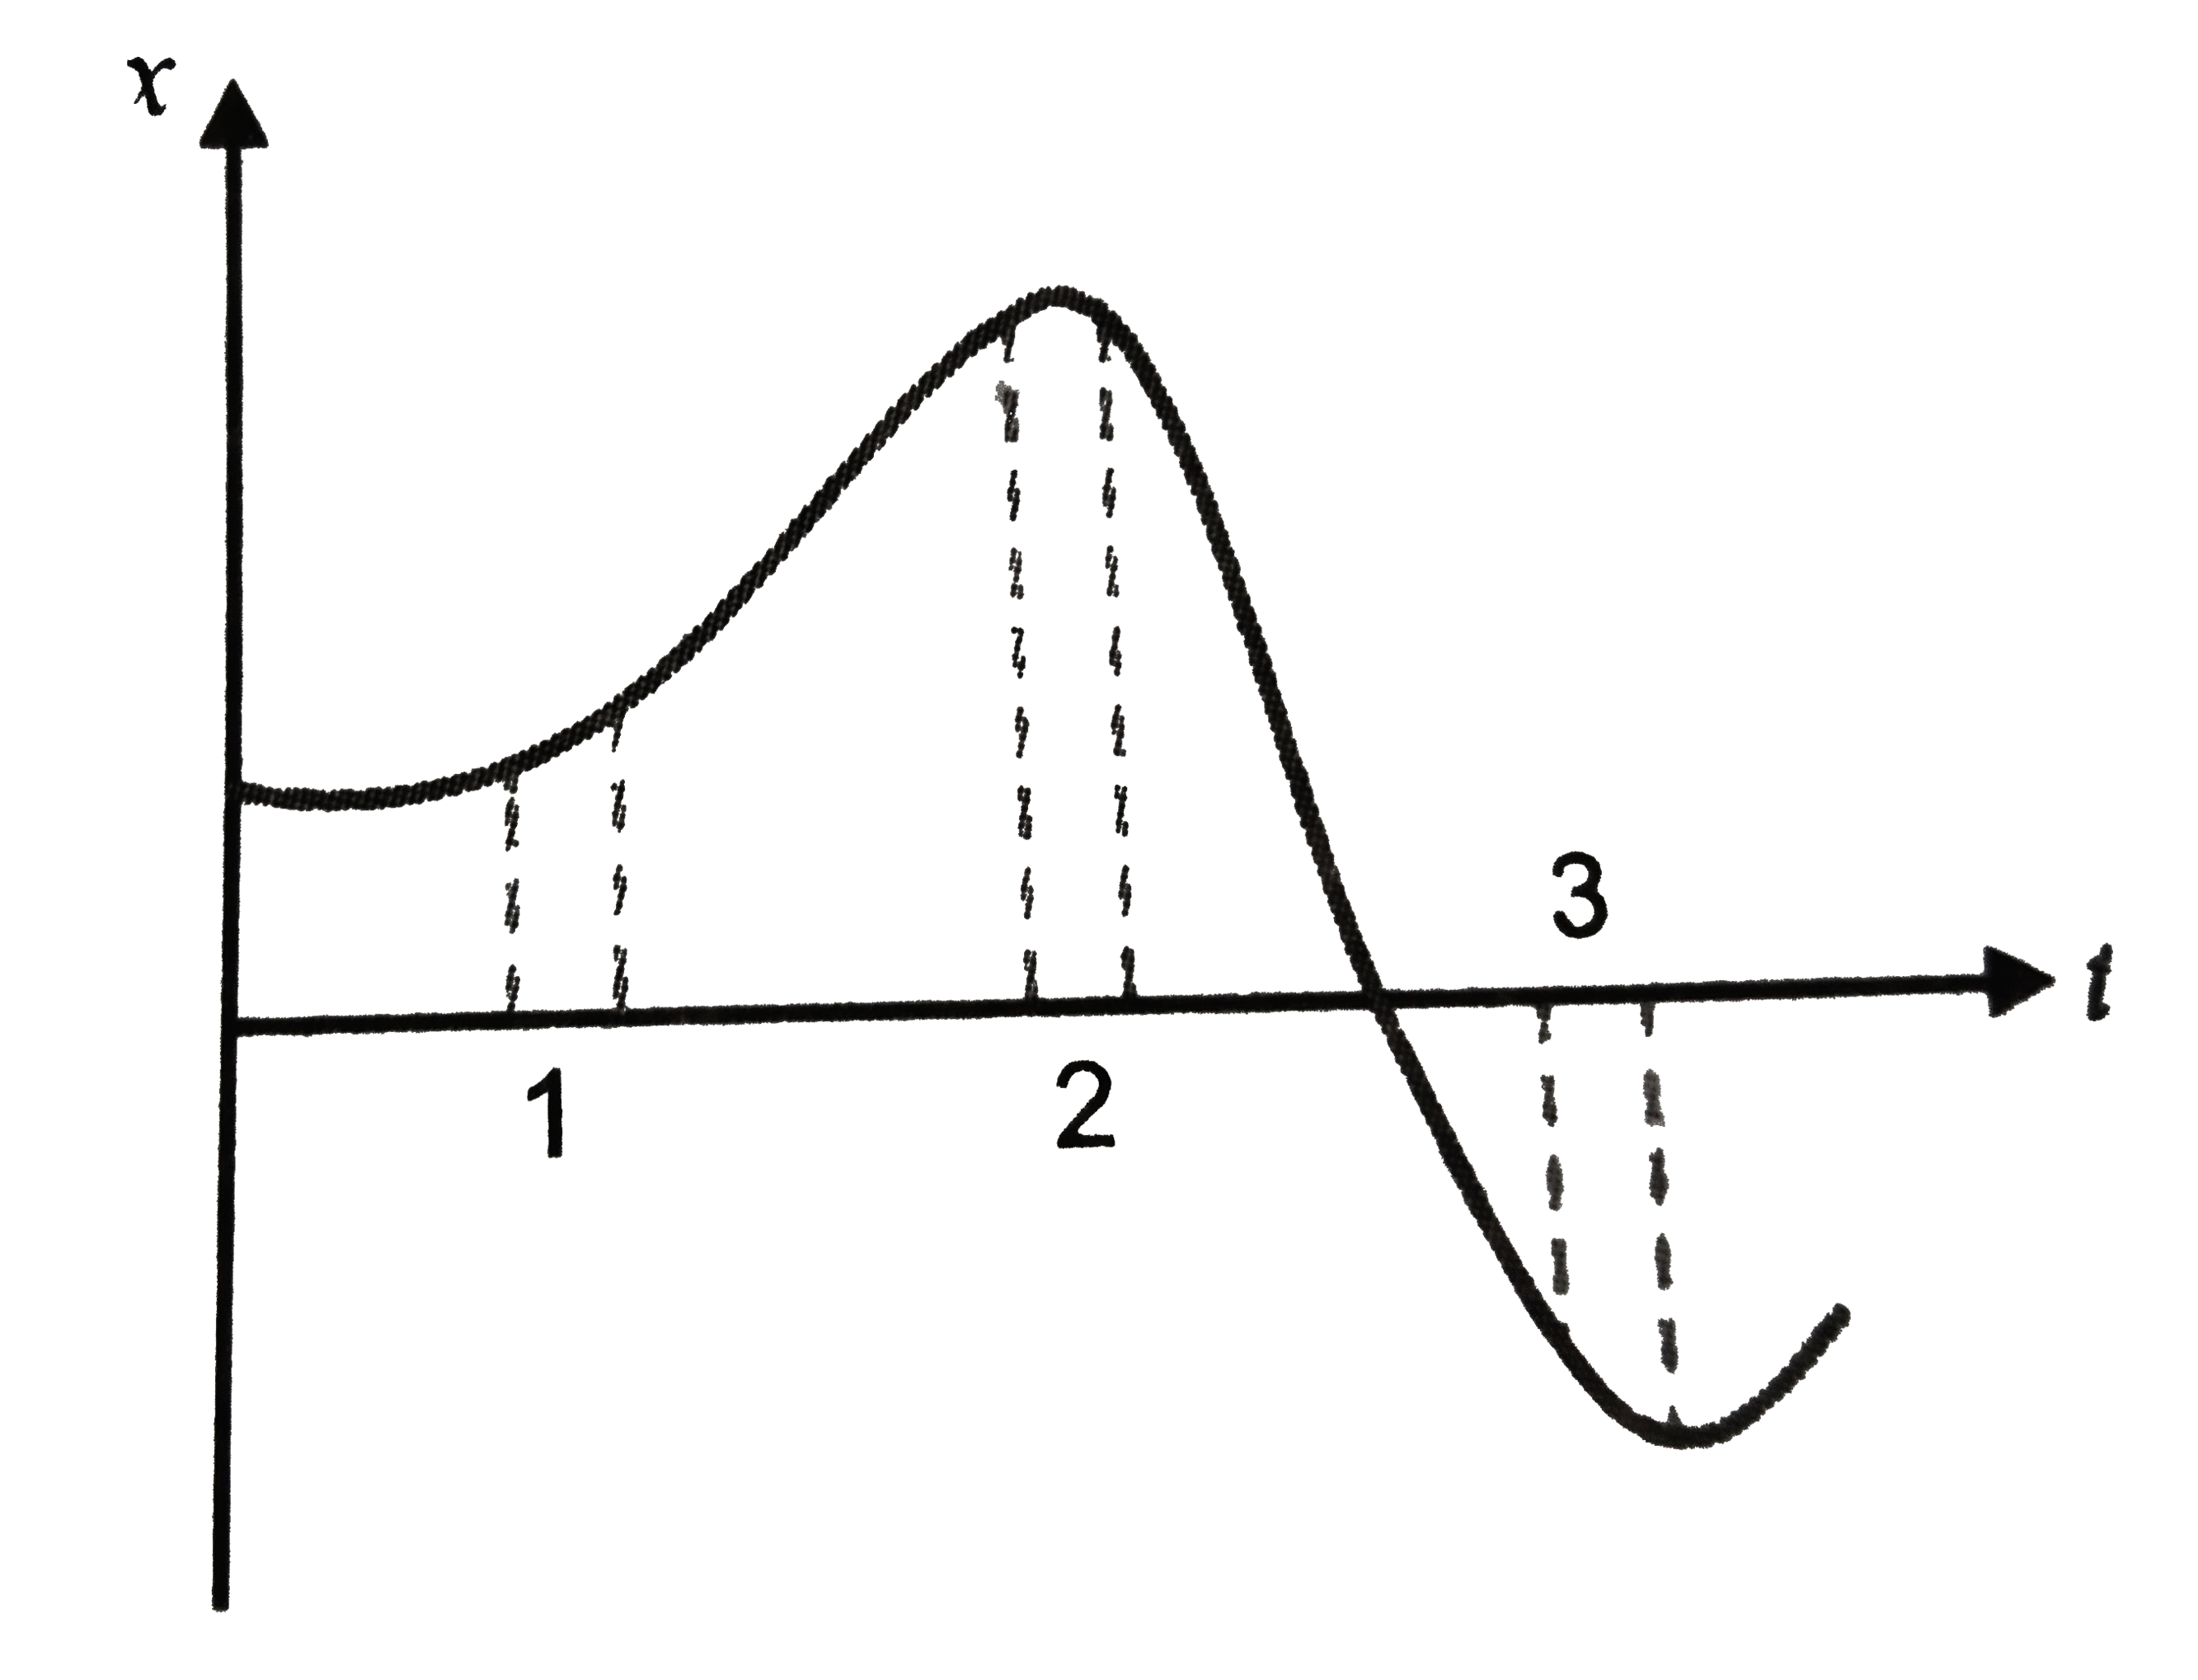
View SolutionFig. 2 (NCT).9 show the x−t plot of a particle in one dimensional motion. Three different equal intervals of time are shown. In which interval the average speed is greatest and in which it is the least ? Give the sign of average speed for each interval.
 .
.
View Solution
Knowledge Check
The motion that is repeated at regular interval of time is
Avibratory motionBlinear motionCrandom motionDnone of these.The area under velocity-time graph for a particle in a given interval of time represents
AvelocityBaccelerationCwork doneDDisplacement does not tell the nature of the actual motion of a particle between the points.During one dimensional motion on x-axis Velocity time graph for particle is given.
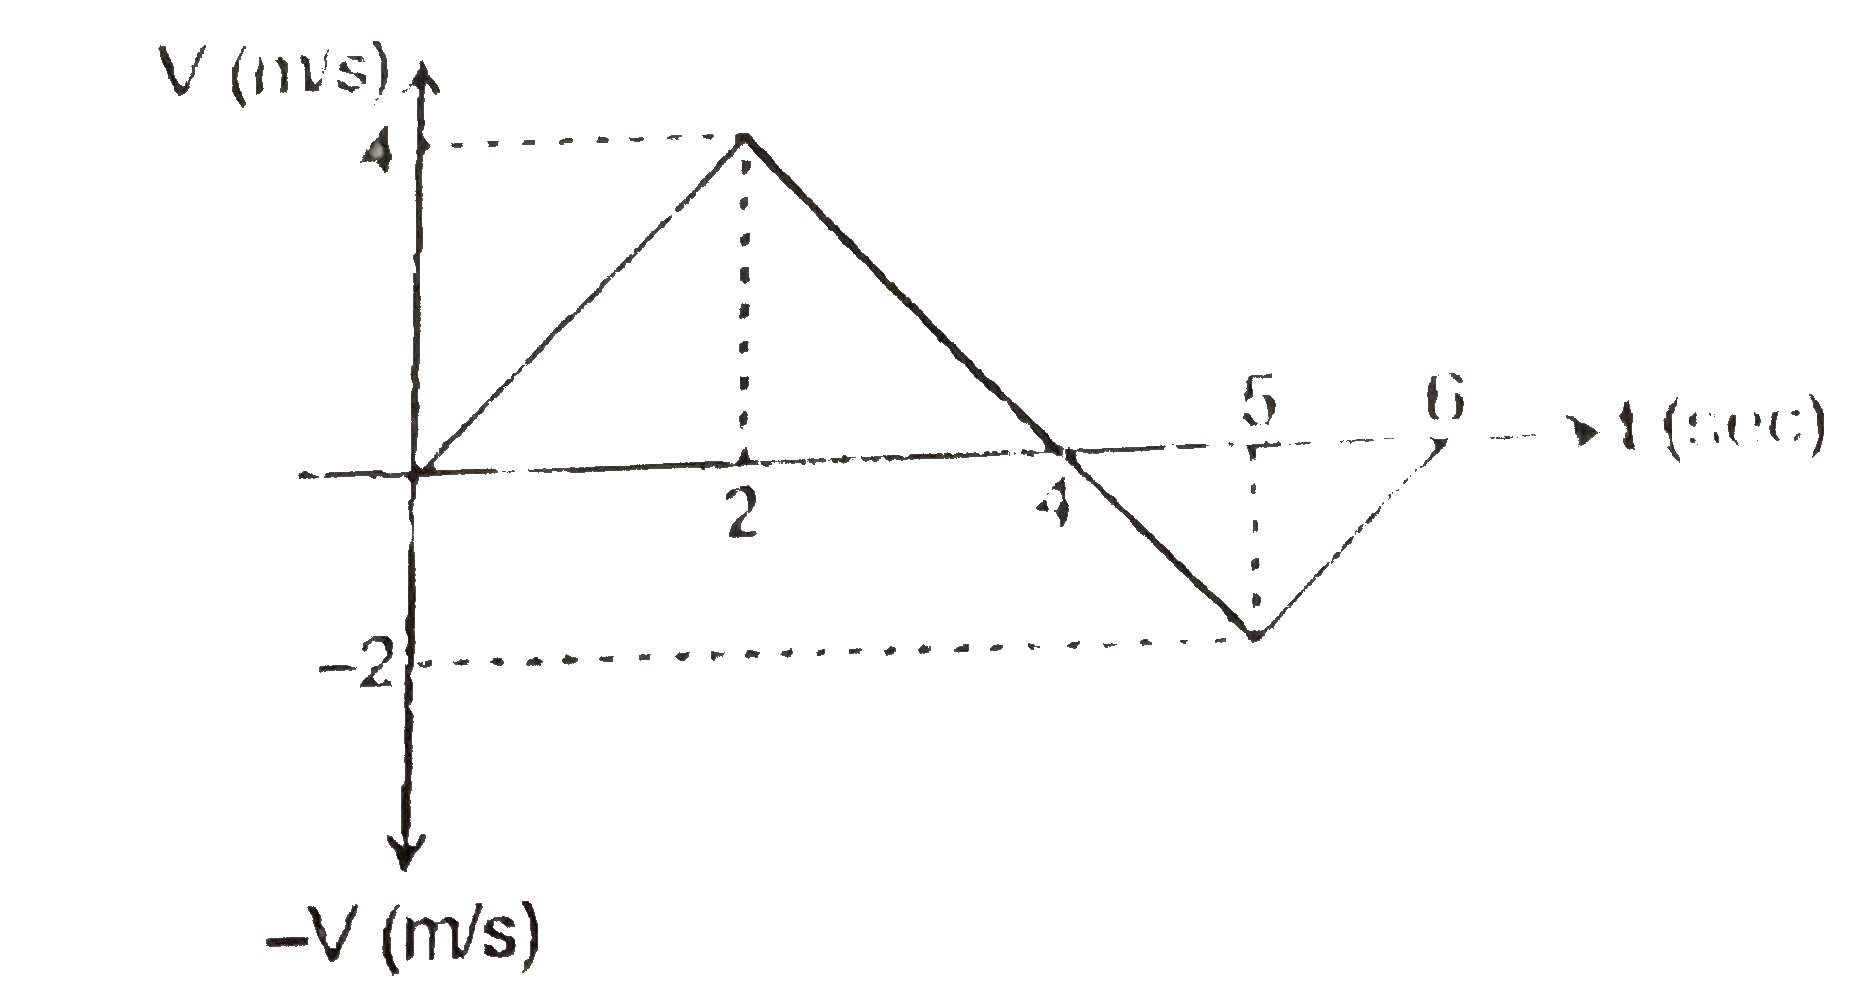
Average acceleration between (t = 0 sec) to (t = 6 sec)A53m/s2B12m/s2C1m/s2Dzero
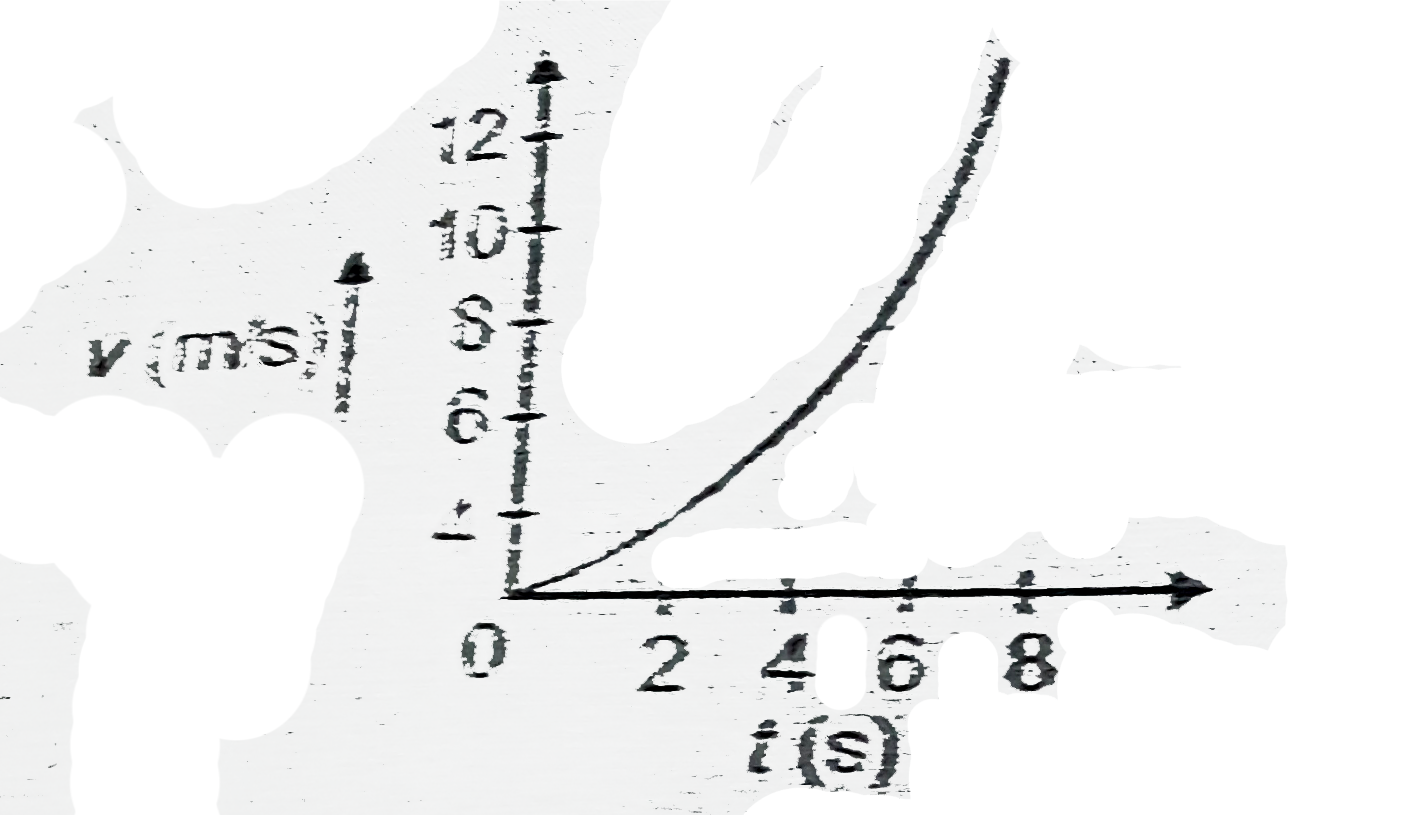
The velocity-time graph of an object is given below. Calculate the average acceleration of the object in the time interval of 4 s to 6 s.
View SolutionThe v-t graph for a particle moving along x-axis is shown in the figure, find
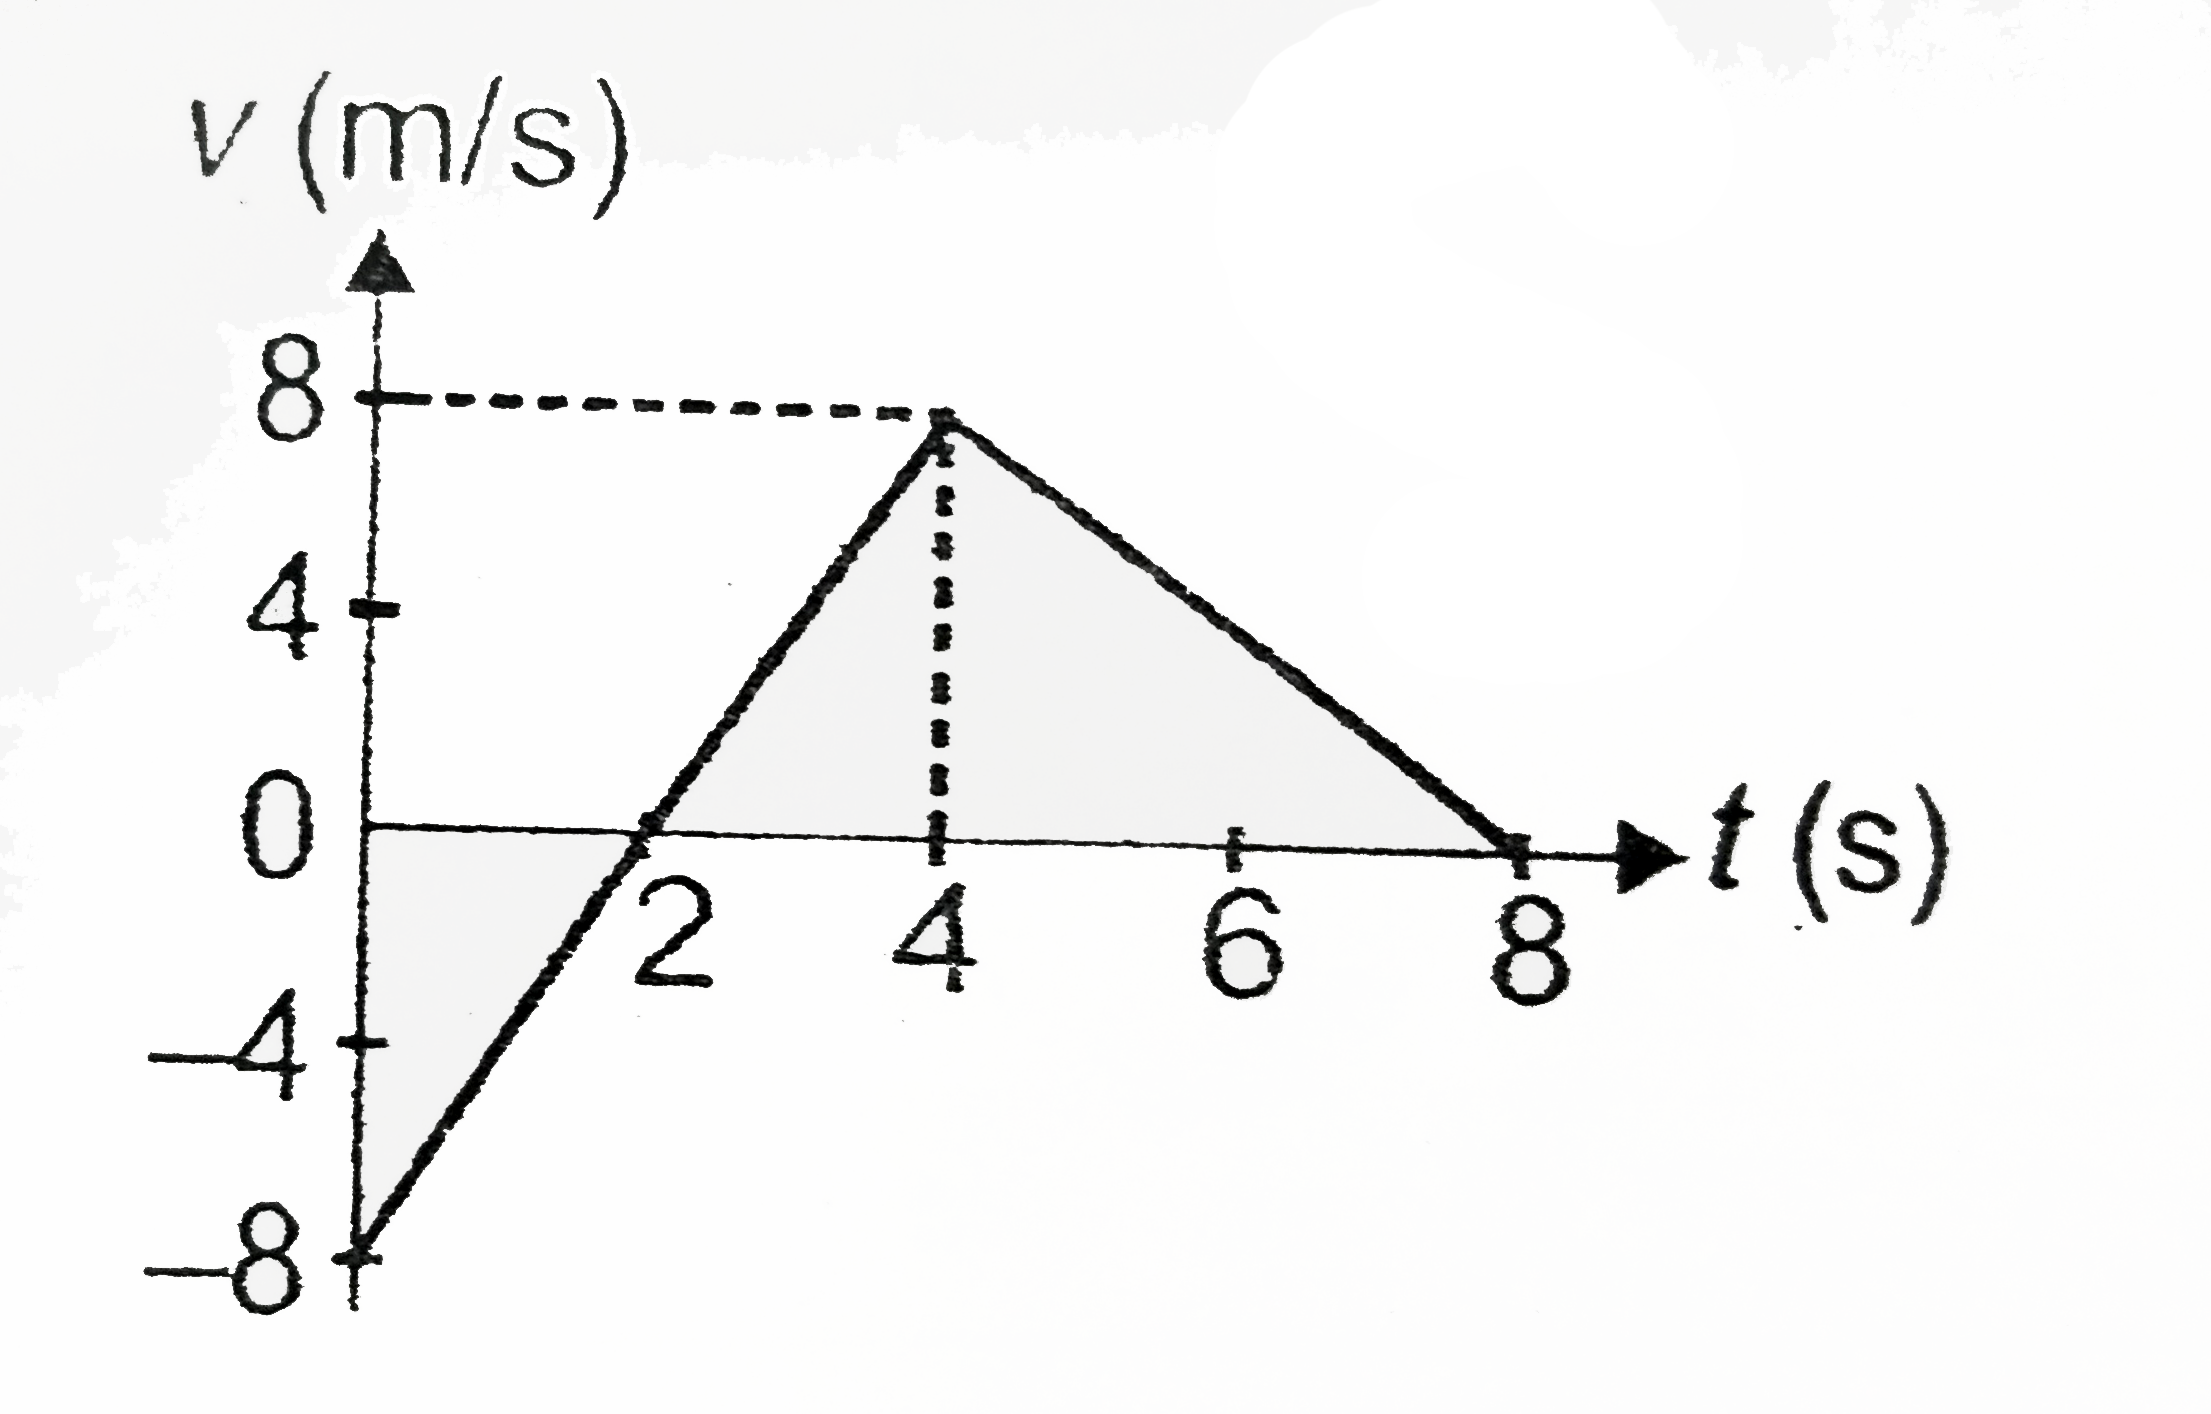
(a) Average velocity in the interval 0 to 8 s.
(b) Average speed in the interval 0 to 8 s.
(c) Average acceleration in the interval 0 to 4 s.
(d) Instantaneous acceleration at t = 2.5 s.
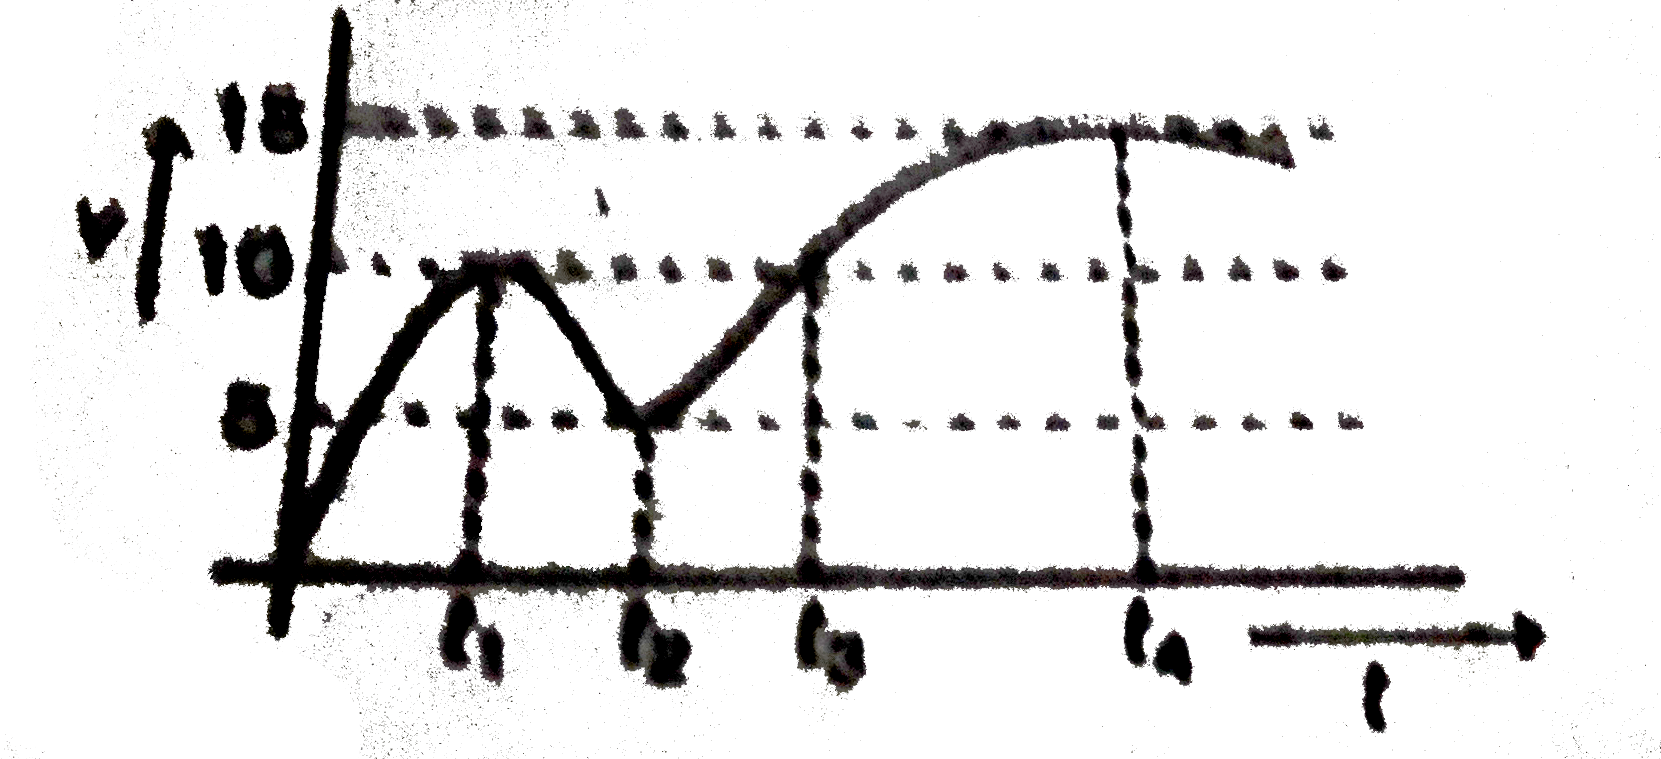
View SolutionVeolocity-time graph of a particle undergoing rectilinear motioin is plotted upto t=t4 as shown in the figure. Average acceleration of the particle is zero in the time internal between
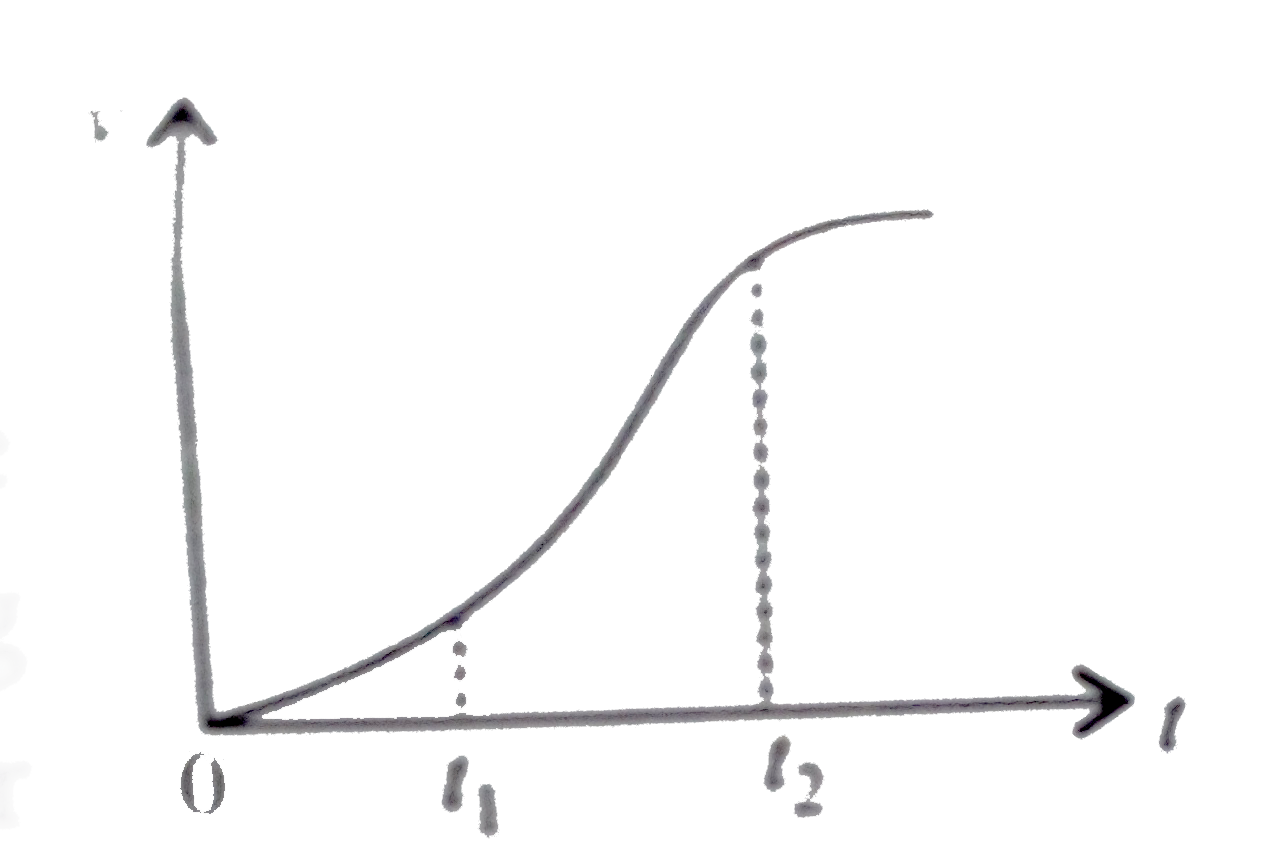
View SolutionThe velocity-time graph of a particle in one-dimensional motion is shown in the figure. Which of the following formulae is correct for describing the motion of the particle over the time interval t1 to t2?
View SolutionA body moving in a straight line with constant acceleration covers distances a and b in successive equal time interval of t. The acceleration of the body is
View Solution
