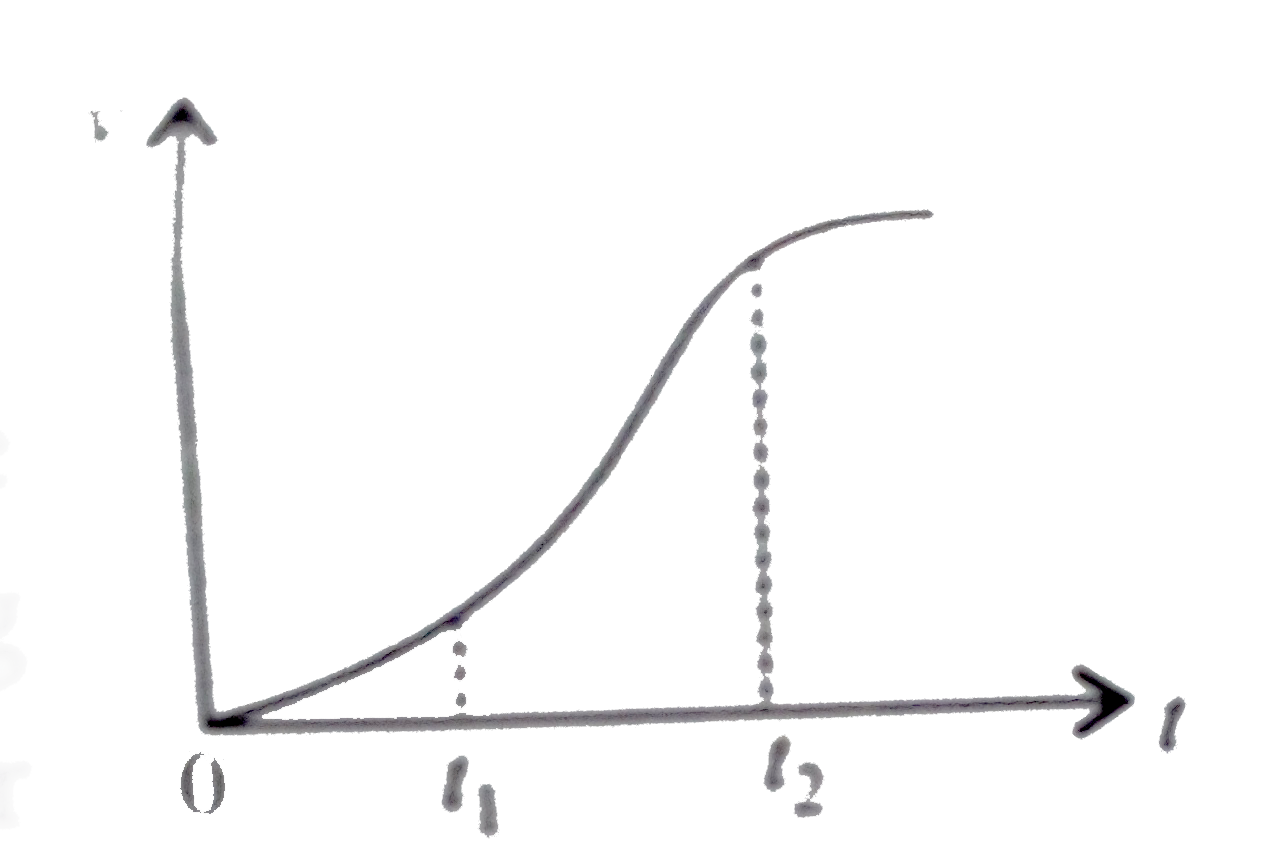
The velocity-time graph of a particle in one-dimensional motion is shown in the figure. Which of the following formulae is correct for describing the motion of the particle over the time interval t1 to t2?
x(t2)=x(t1)+v(t1)(t2−t1)+(12)a(t2−t1)2
v(t2)=v(t1)+a(t2−t1)
vaverage=x(t2)+x(t1)t2−t1
aaverage=v(t2)−v(t1)t2−t1
The correct Answer is:D
In the given interval the slope of v-t graph (i.e acceleration) neither constant nor unifrom. Therefore relations (a), (b) and (c ) are incorrect but (d) is correct.
Topper's Solved these Questions
- MOTION IN A STRAIGHT LINEBook:NCERT FINGERTIPSChapter:MOTION IN A STRAIGHT LINEExercise:Kinematic Equations For Uniformly Accelerated Motion
Explore 32 Videos
- MOTION IN A STRAIGHT LINEBook:NCERT FINGERTIPSChapter:MOTION IN A STRAIGHT LINEExercise:Relative Velocity
Explore 18 Videos
- MOTION IN A STRAIGHT LINEBook:NCERT FINGERTIPSChapter:MOTION IN A STRAIGHT LINEExercise:Instantaneous Velocity And Speed
Explore 16 Videos
- MOTION IN A PLANE Book:NCERT FINGERTIPSChapter:MOTION IN A PLANE Exercise:Assertion And Reason
Explore 15 Videos
- OSCILLATIONS Book:NCERT FINGERTIPSChapter:OSCILLATIONS Exercise:Assertion And Reason
Explore 15 Videos
Similar Questions
The displacement-time graph of a particle executing simple harmonic motion is shown in the figure
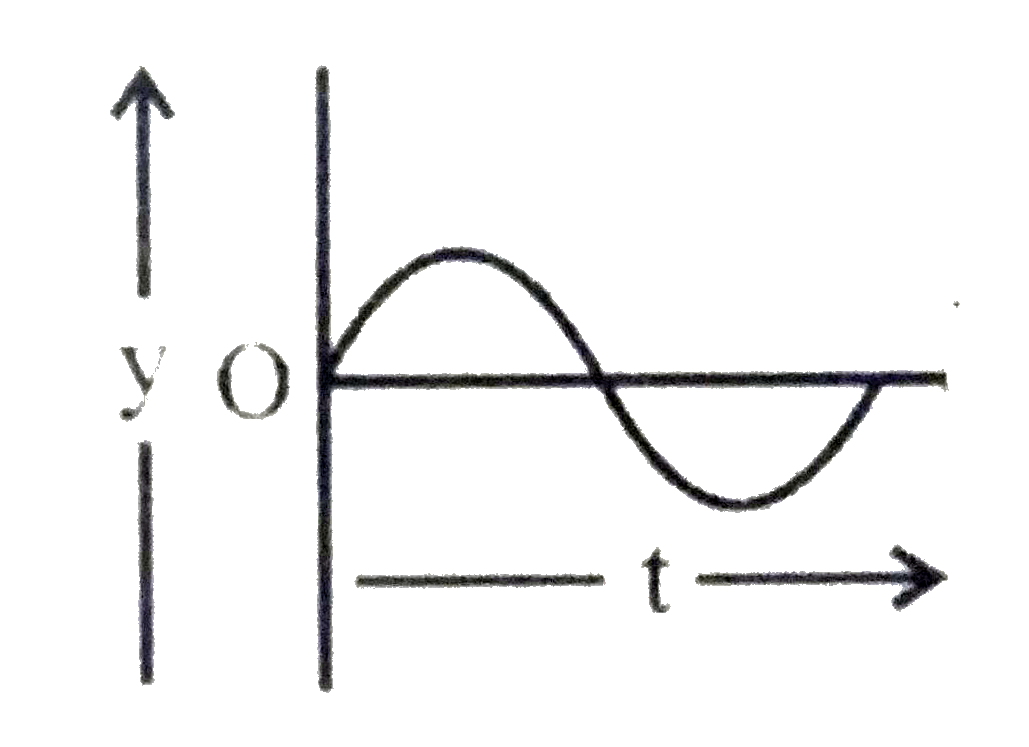
Which one of the following graphs is the correct forcetime graph for the motion of the particle ?
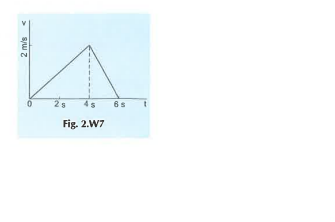
View SolutionThe velocity-time graph of a particle moving along a straight line is shown in Figure 2.W7.Is the motion uniform?
View Solution
Knowledge Check
The velocity − time graph of a particle is as shown in figure
 AIt moves with a constant acceleration throughoutBIt moves with an acceleration of constant magnitude but changing direction at the end of every two secondCThe displacement of the particle is zeroDThe velocity becomes zero at t=4 second
Which of the following graphs cannot represent one dimensional motion of a particle?
A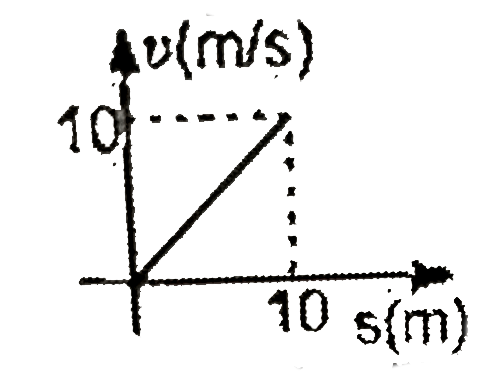 B
B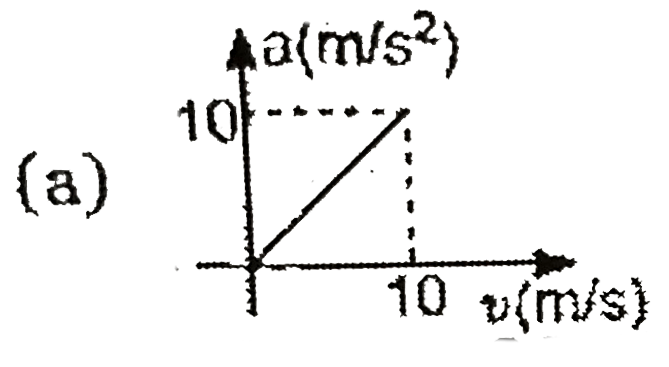 C
C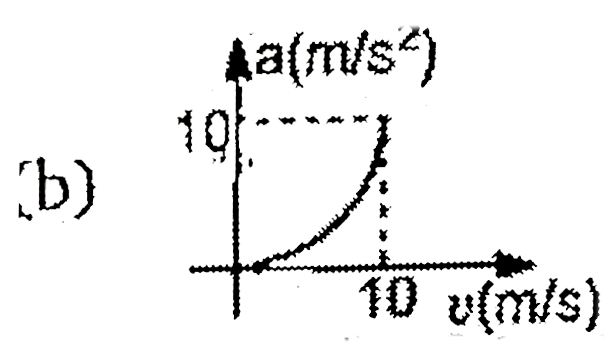 D
D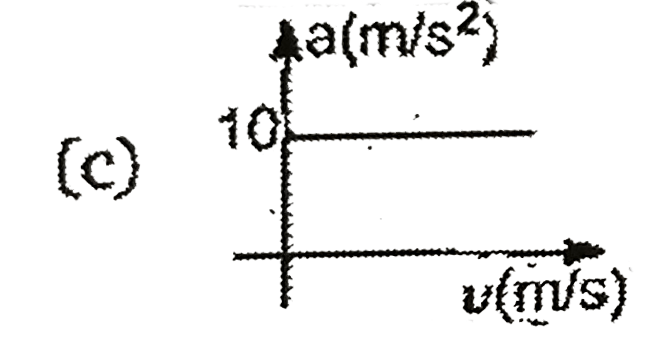
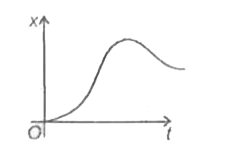
The displacement (x)-time (t) graph of a particle is shown in figure. Which of the following is correct ?
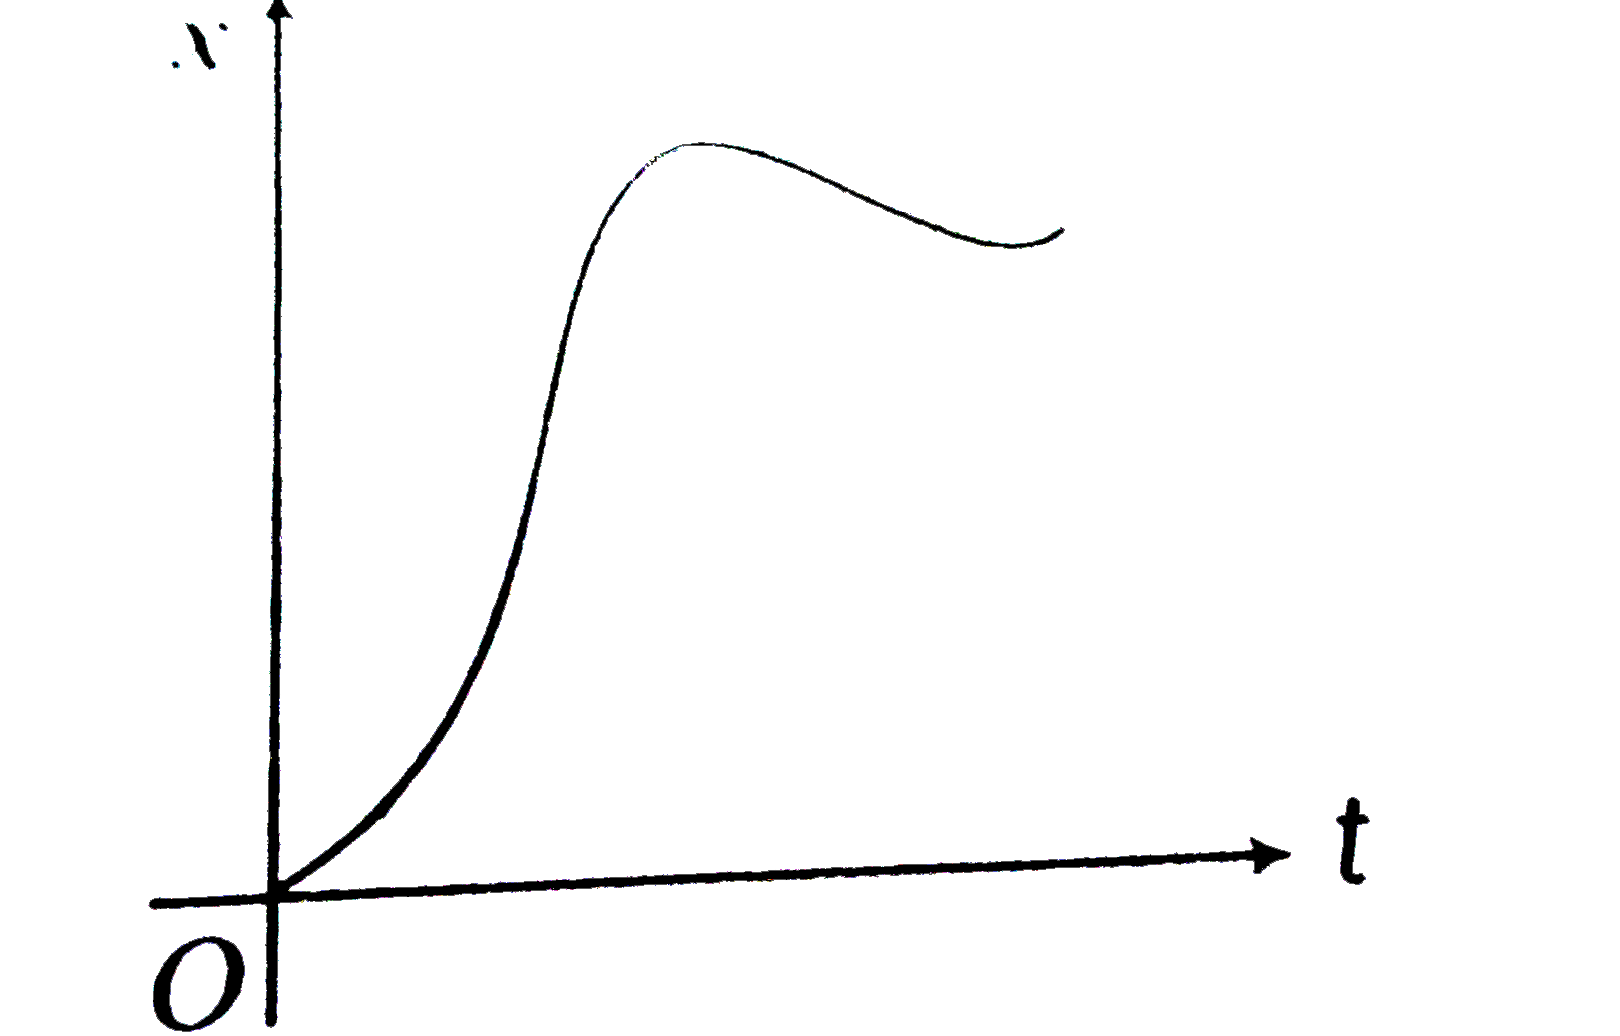 AParticle starts with zero velocity and variable accelerationBParticle starts with non-zero velocity and variable accelerationCParticle starts with zero velocity and uniform accelerationDParticle starts with non-zero velocity and uniform acceleration
s-t graph of a particle in motion is shown in Fig. Calculate
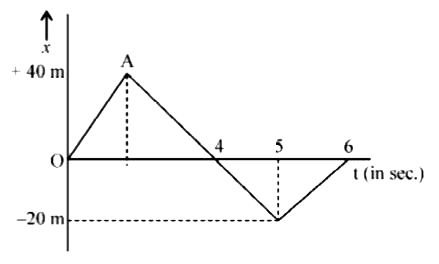
Displacement
View Solutions-t graph of a particle in motion is shown in Fig. Calculate
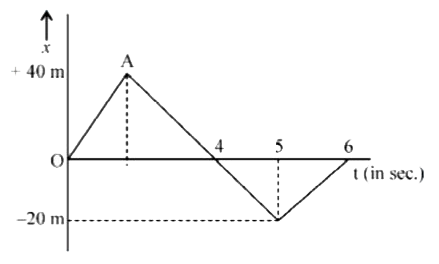
Average velocity
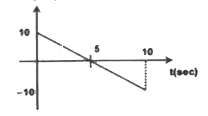
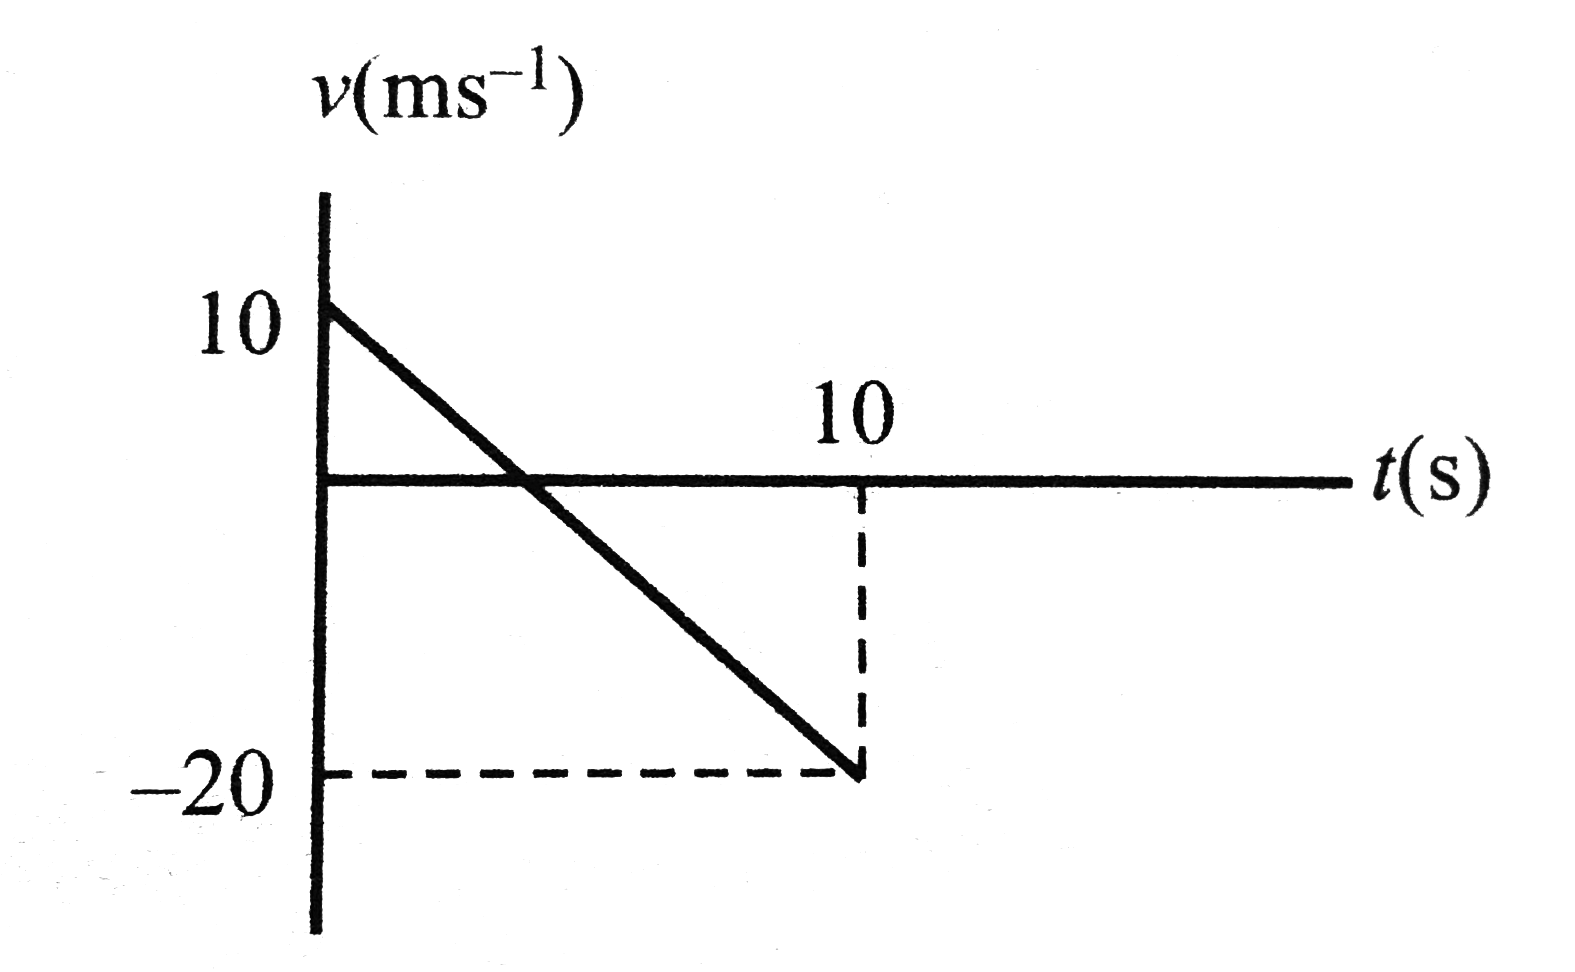
View SolutionVelocity-time graph of a particle moving in a straight line is shown in the figure. Mass of the particle is 2 kg. Work done by all the forces acting on the particle in time interval t = 0 to t = 10 sec is
View SolutionThe displacement (x) - time (t) graph of a particle is shown in figure. Which of the following is correct?
View SolutionThe velocity-time graph of a particle moving in a straight line is shown in figure. The mass of the particle is 2kg. Work done by all the forces acting on the particle in time interval between t=0 to t=10s is
View Solution

