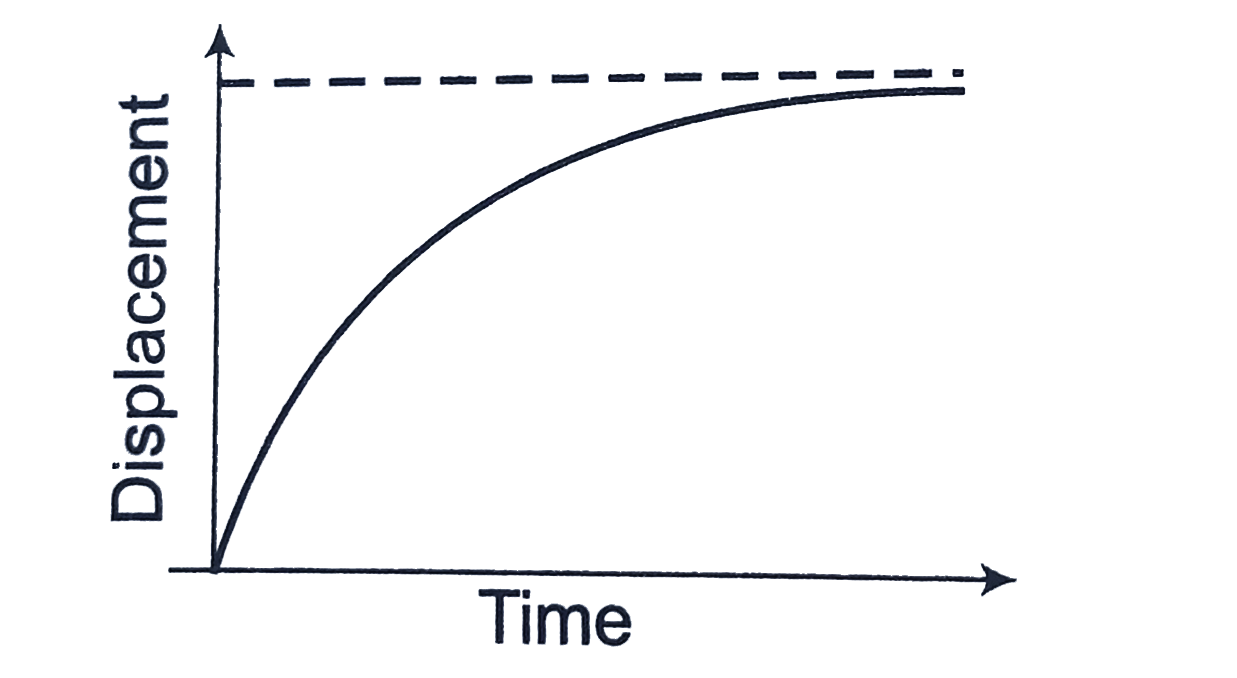
The displacement (x) - time (t) graph of a particle is shown in figure. Which of the following is correct?
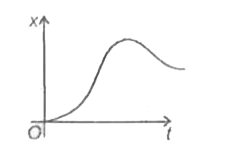
Particle starts with zero velocity and variable acceleration
Particle starts with non - zero velocity and variable acceleration
Particle starts with zero velocity and uniform acceleration
Particle starts with non - zero velocity and uniform acceleration
The correct Answer is:A
Step by step video, text & image solution for The displacement (x) - time (t) graph of a particle is shown in figure. Which of the following is correct? by Physics experts to help you in doubts & scoring excellent marks in Class 12 exams.
Updated on:21/07/2023Topper's Solved these Questions
- MOTION IN A STRAIGHT LINEBOOK - AAKASH INSTITUTECHAPTER - MOTION IN A STRAIGHT LINEEXERCISE - ASSIGNMENT (SECTION - C)
37 Videos
- MOTION IN A STRAIGHT LINEBOOK - AAKASH INSTITUTECHAPTER - MOTION IN A STRAIGHT LINEEXERCISE - ASSIGNMENT (SECTION - D)
15 Videos
- MOTION IN A STRAIGHT LINEBOOK - AAKASH INSTITUTECHAPTER - MOTION IN A STRAIGHT LINEEXERCISE - ASSIGNMENT (SECTION - A)
60 Videos
- MOTION IN A PLANEBOOK - AAKASH INSTITUTECHAPTER - MOTION IN A PLANEEXERCISE - Assignement section -J (Aakash Challengers Questions)
4 Videos
- MOTION IN STRAIGHT LINEBOOK - AAKASH INSTITUTECHAPTER - MOTION IN STRAIGHT LINEEXERCISE - Assignment (SECTION - J)
2 Videos
Similar Questions
Knowledge Check
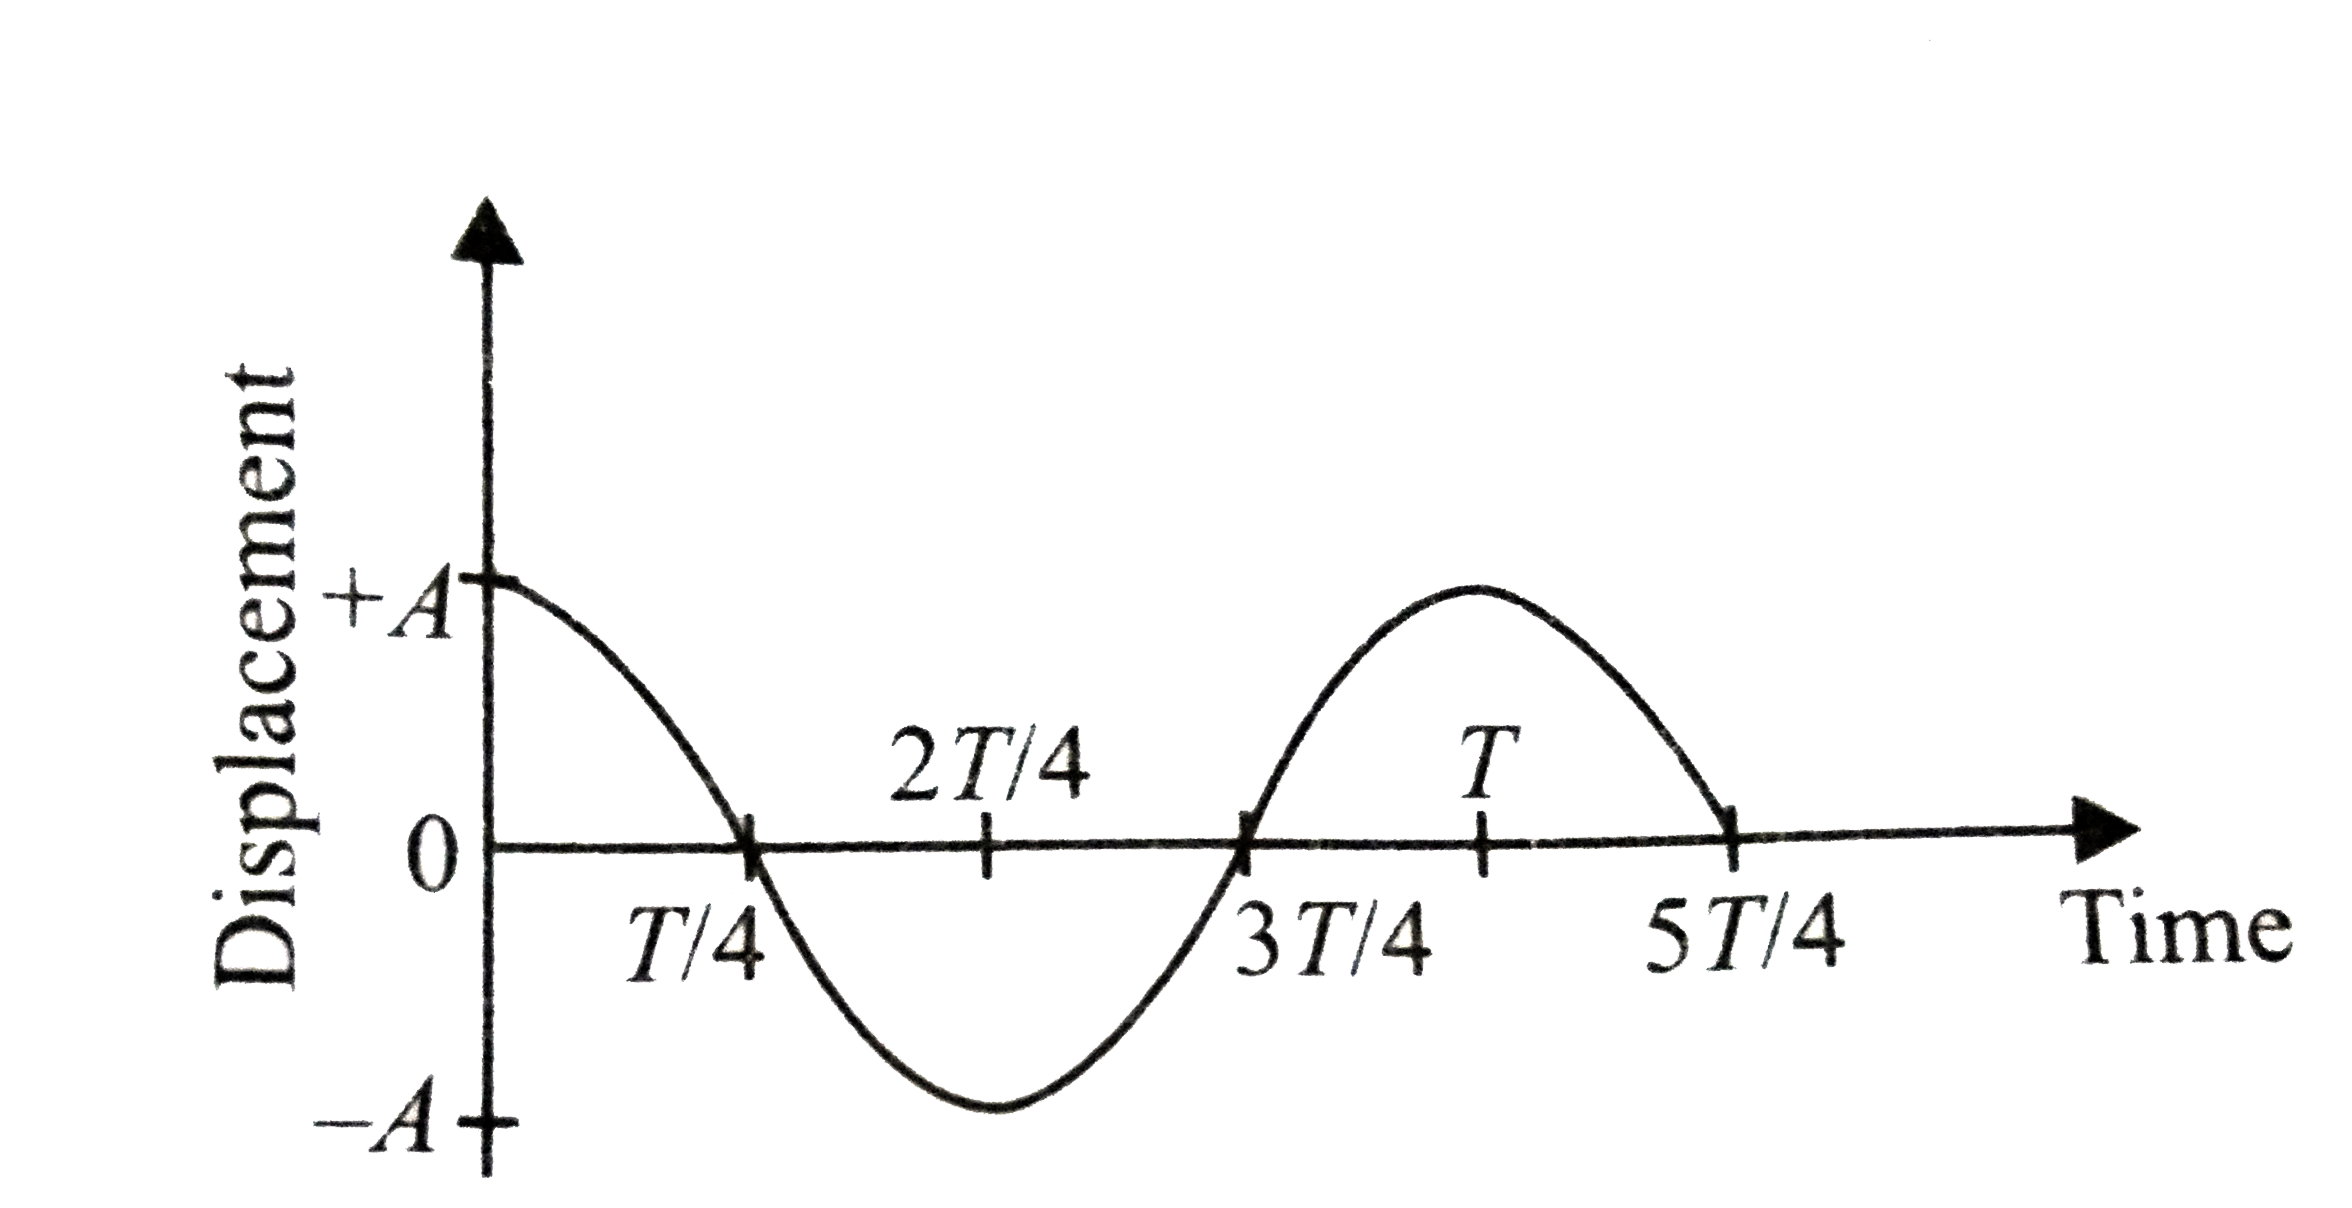
The displacement - time graph of a particle executing SHM is shown in figure. Which of the following statements is//are true ?
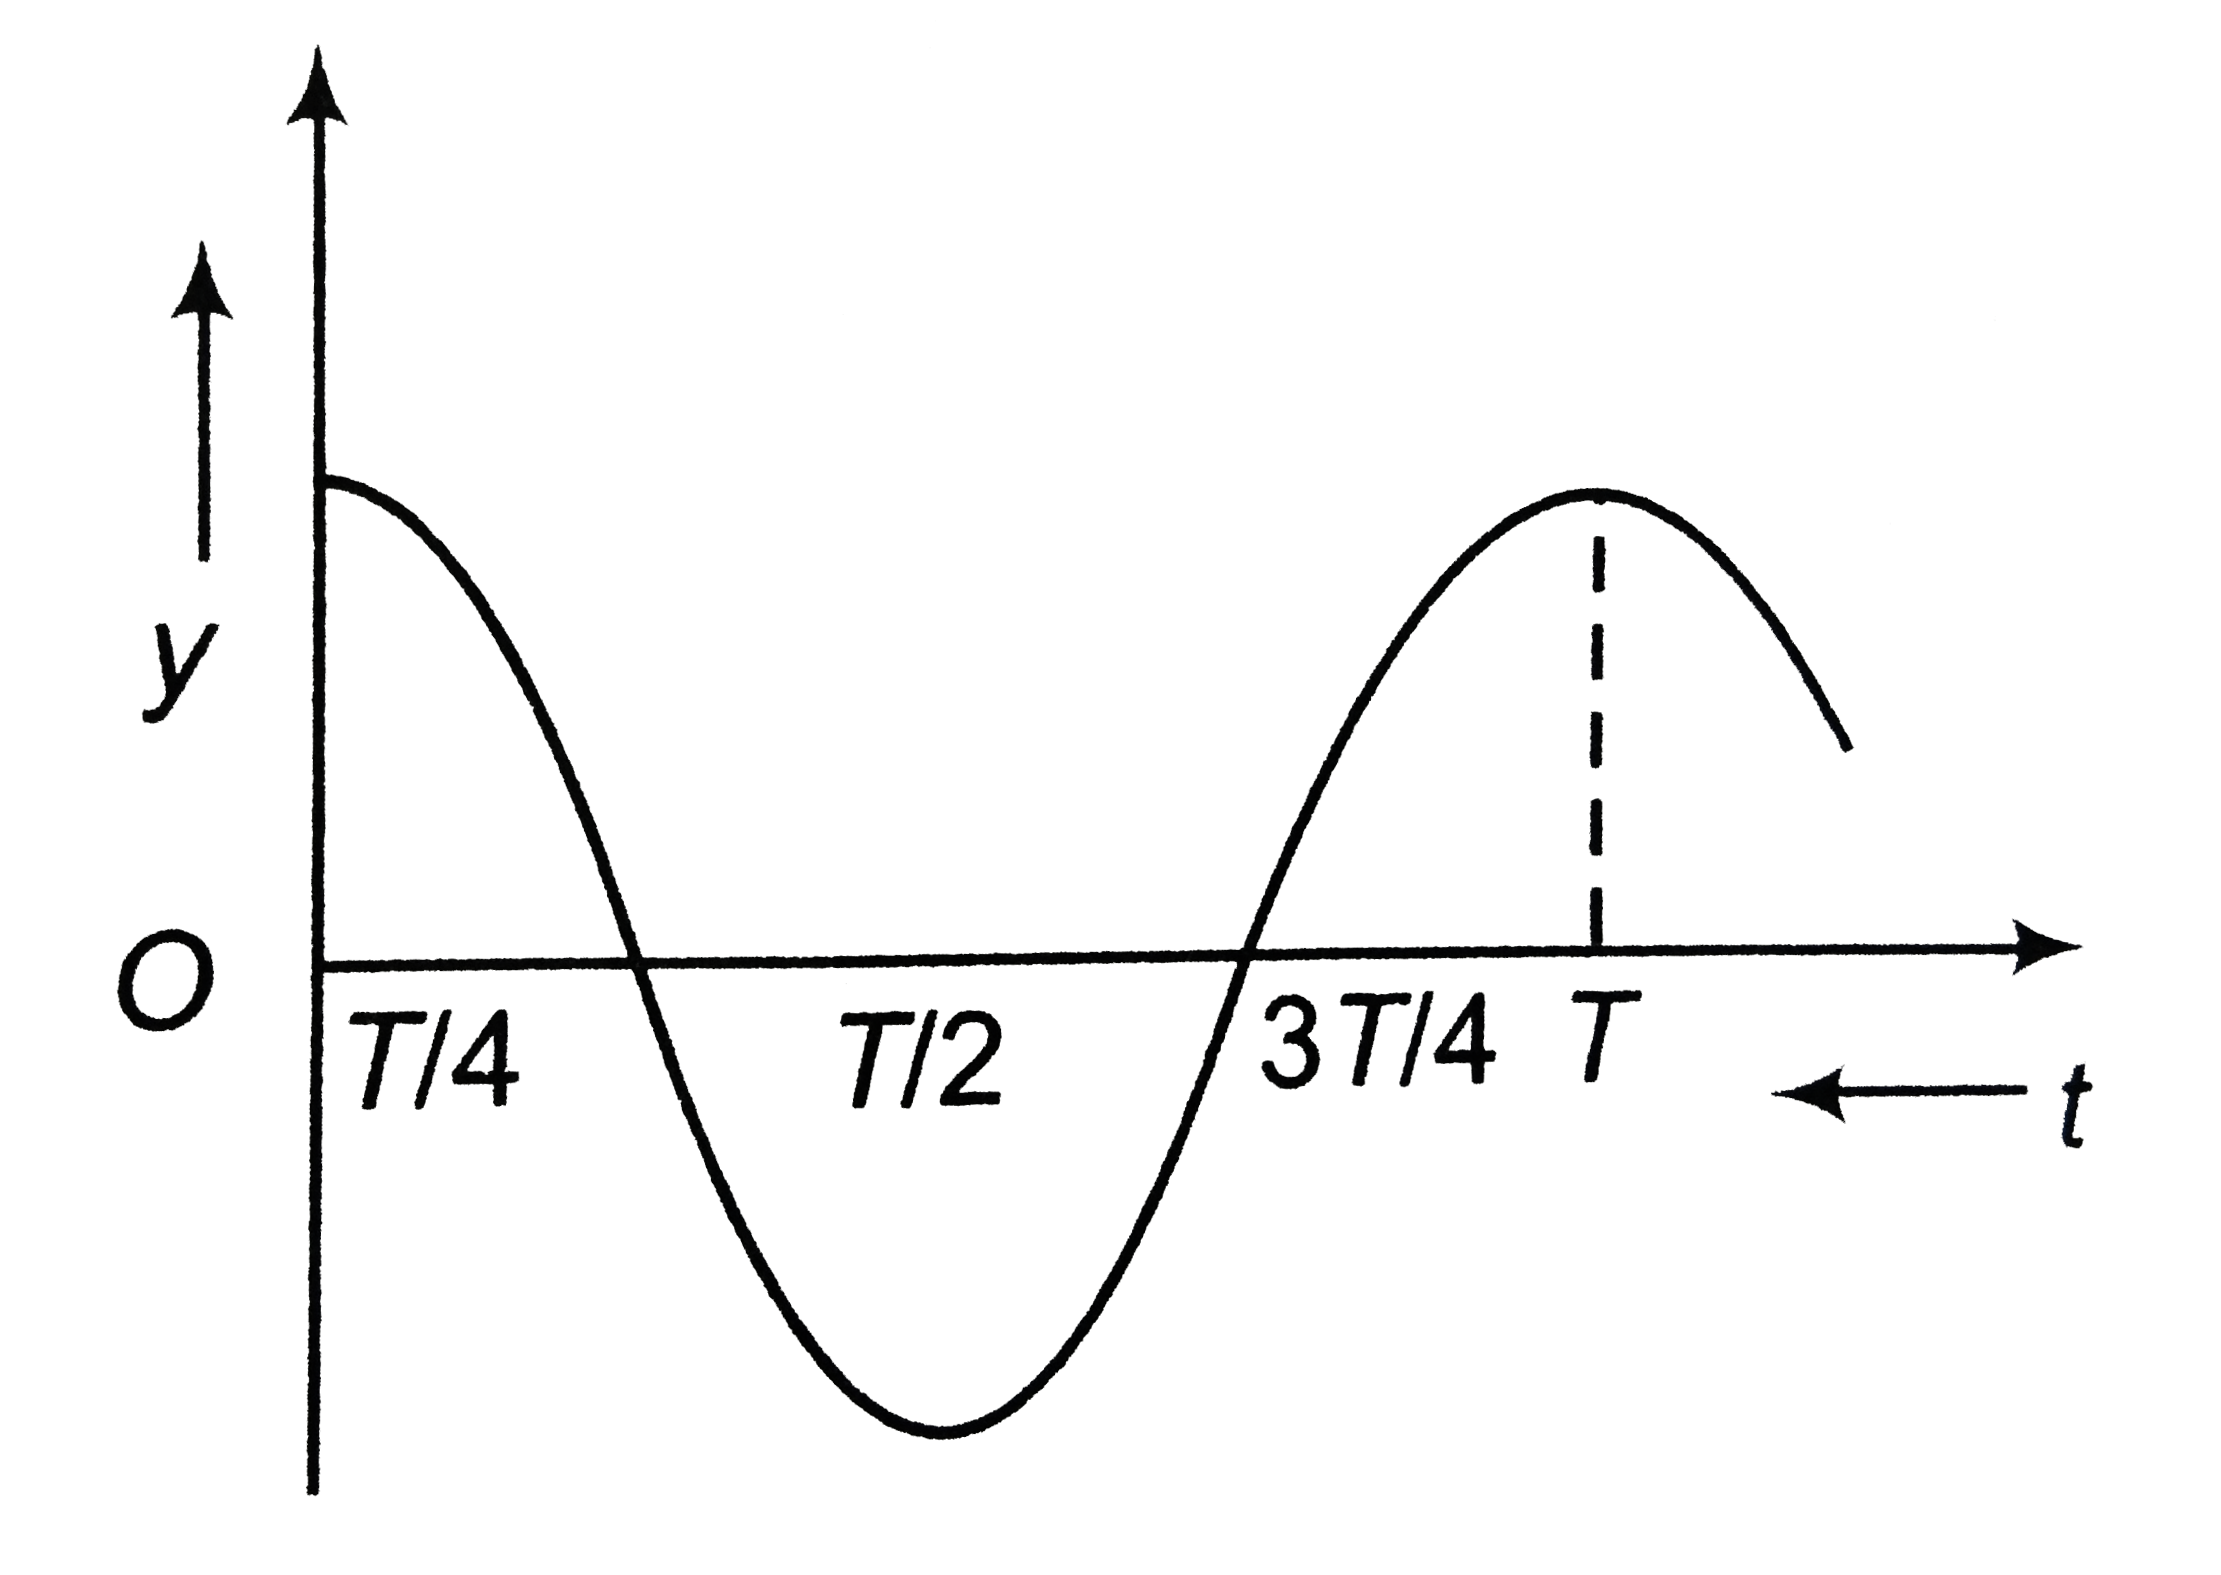 AThe velocity is maximum at t=T/2BThe acceleration is maximum at t=TCThe force is zero at t=3T/4DThe kinetic energy equals the total oscillation energy at t=T/2
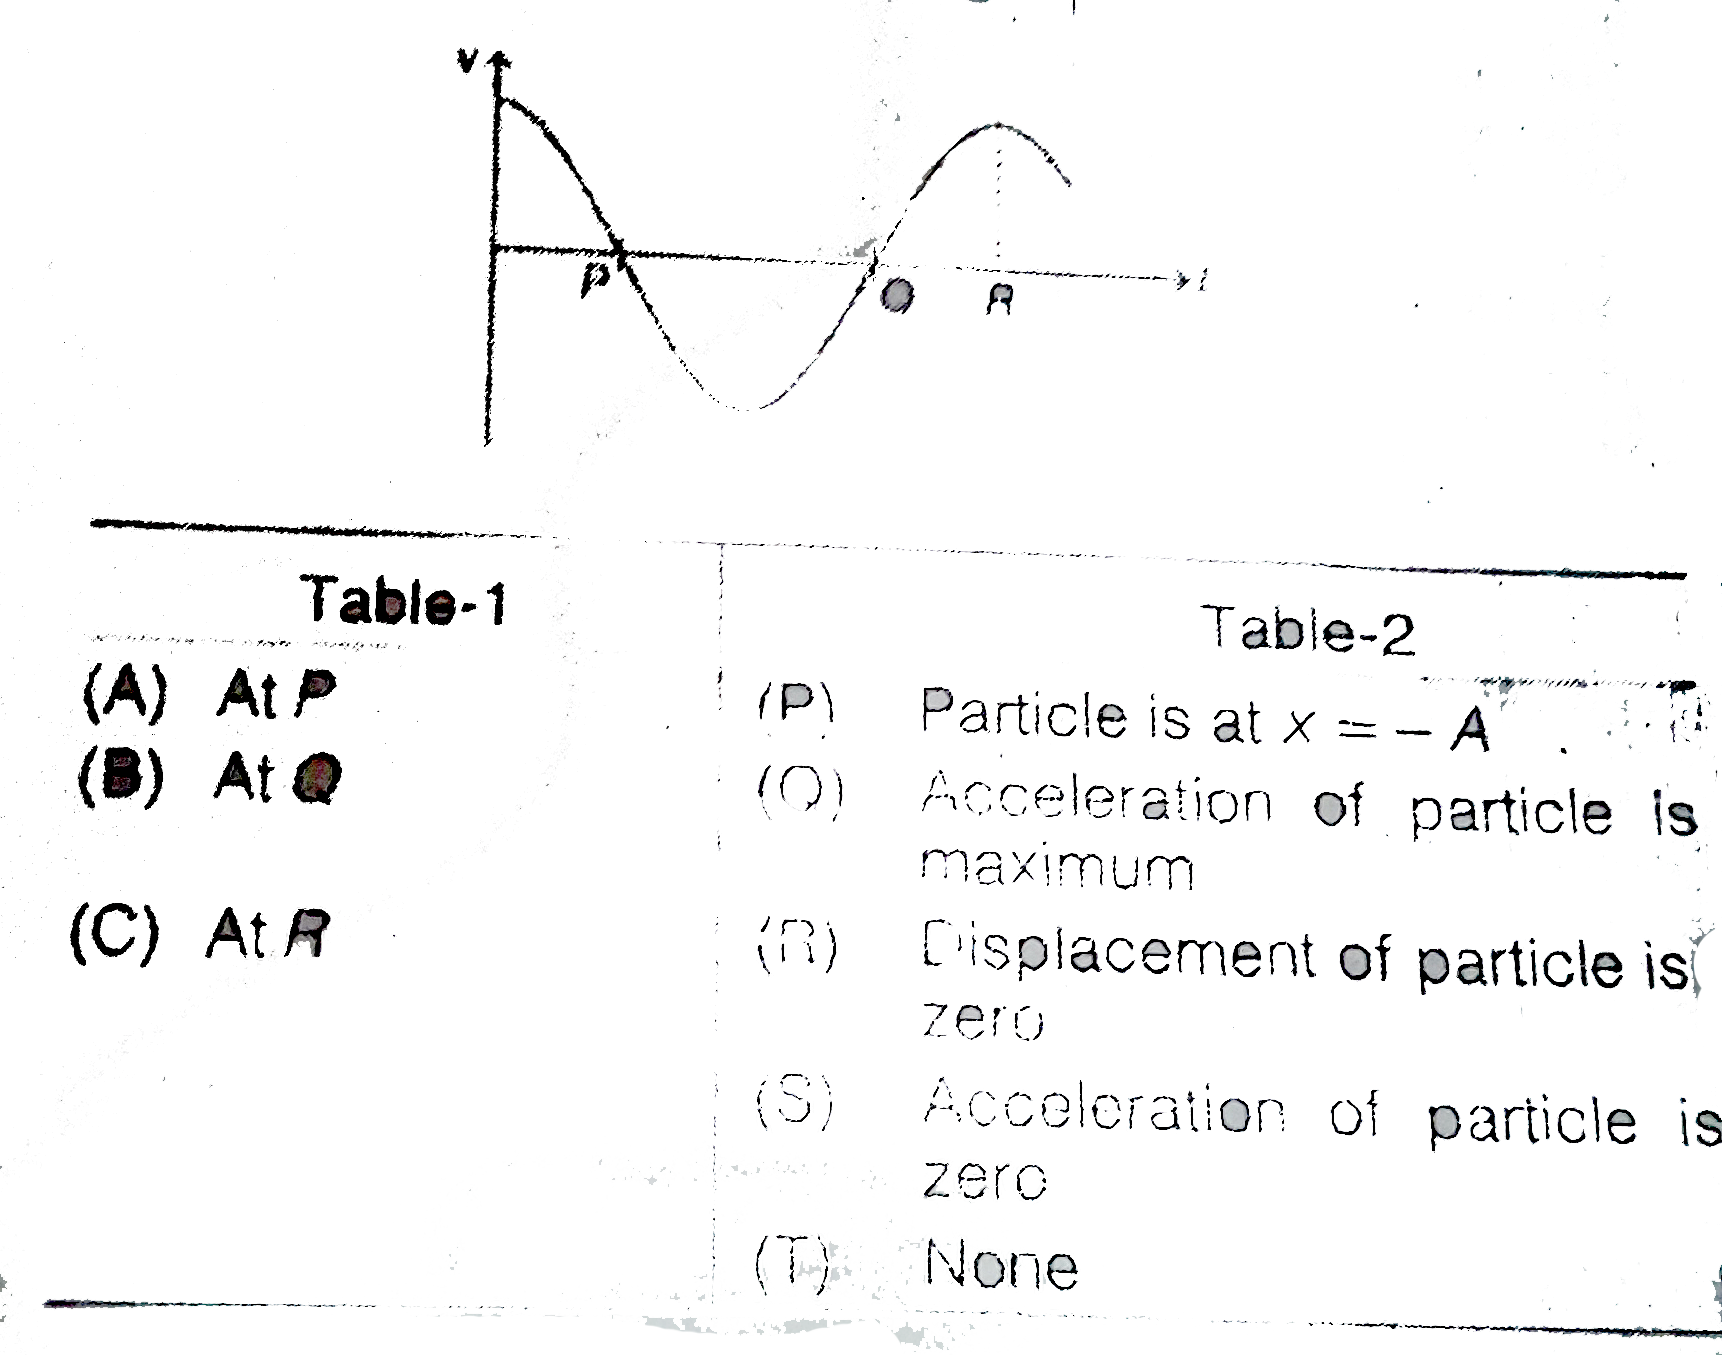
The velocity -displacement graph of a particle is as shown in the figure. Which of the following graphs correctly represents the variation of acceleration with displacement?
 A
A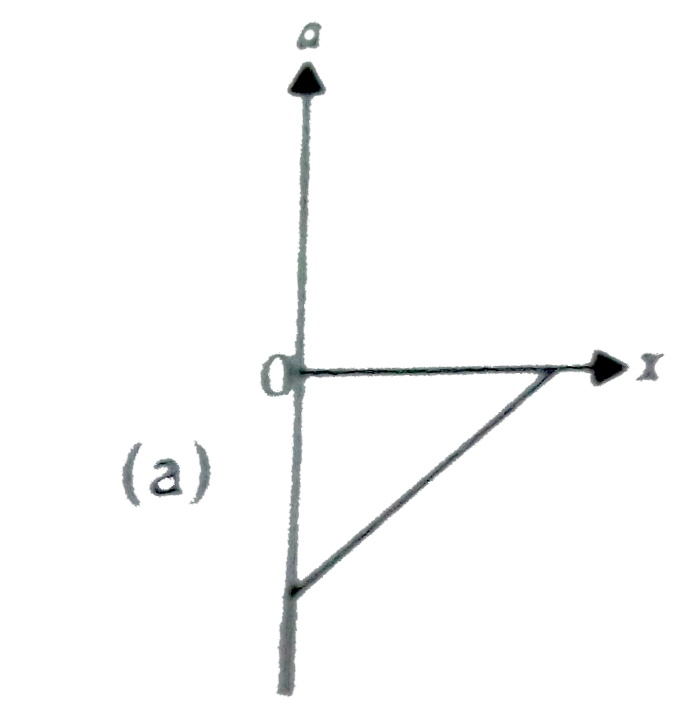 B
B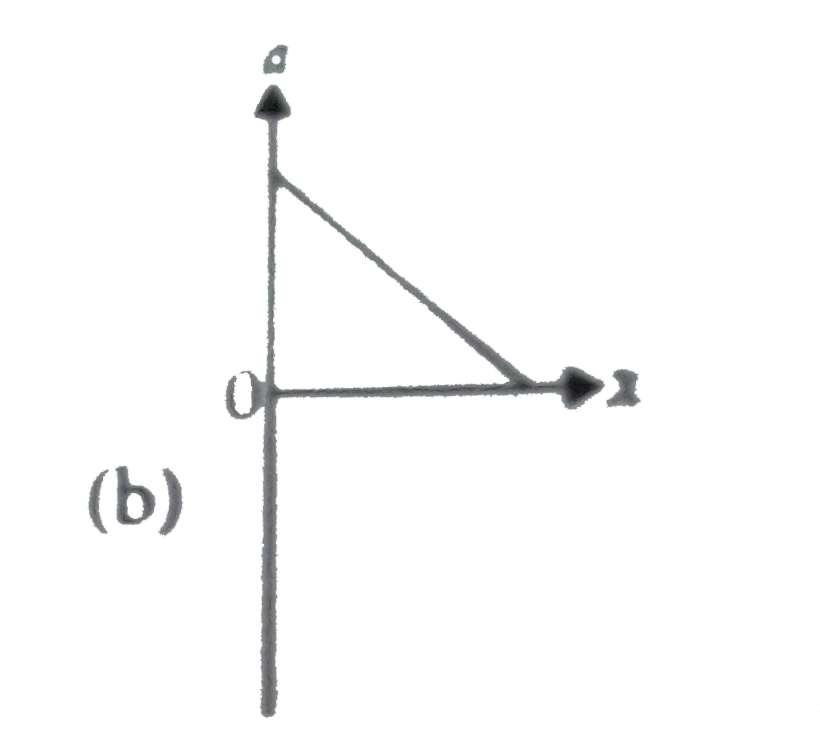 C
C D
D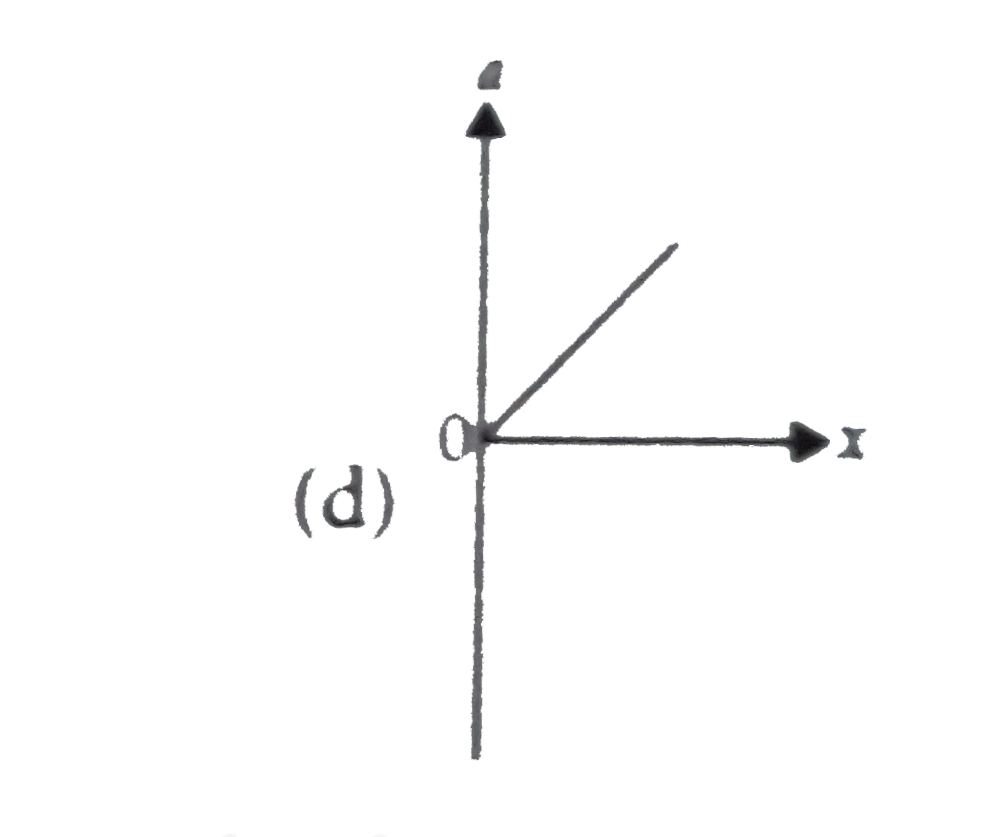
The displacement time graph of a particle executing S.H.M. is shown in figure. Which of the following statement is / are true ?
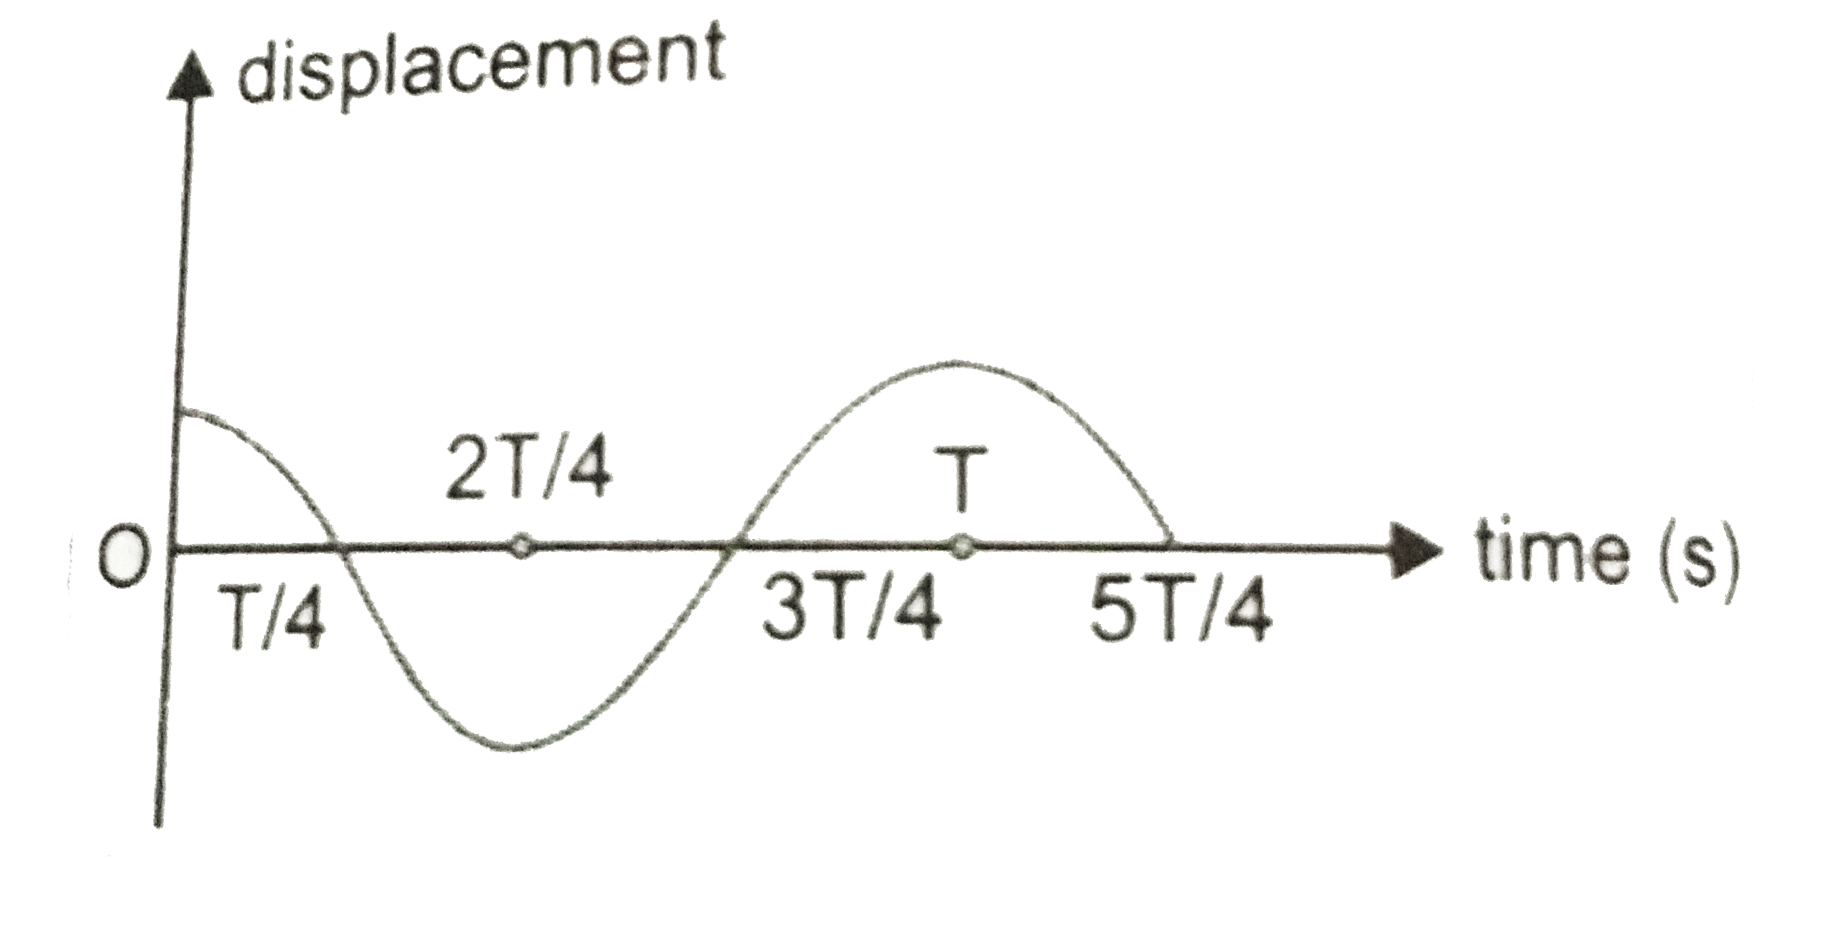 AThe force is zero at t=3T4BThe acceleration is maximum at t=4T4CThe velocity is maximum at t=T4DThe P.E. is equal to K.E. of oscillation at t=T2
If graph of y= f(x) is as shown in figure, then which of the following options is/are correct?
View SolutionThe displacement-time graph of a particle executing SHM is shown in figure. Which of the following statement is/are true ?
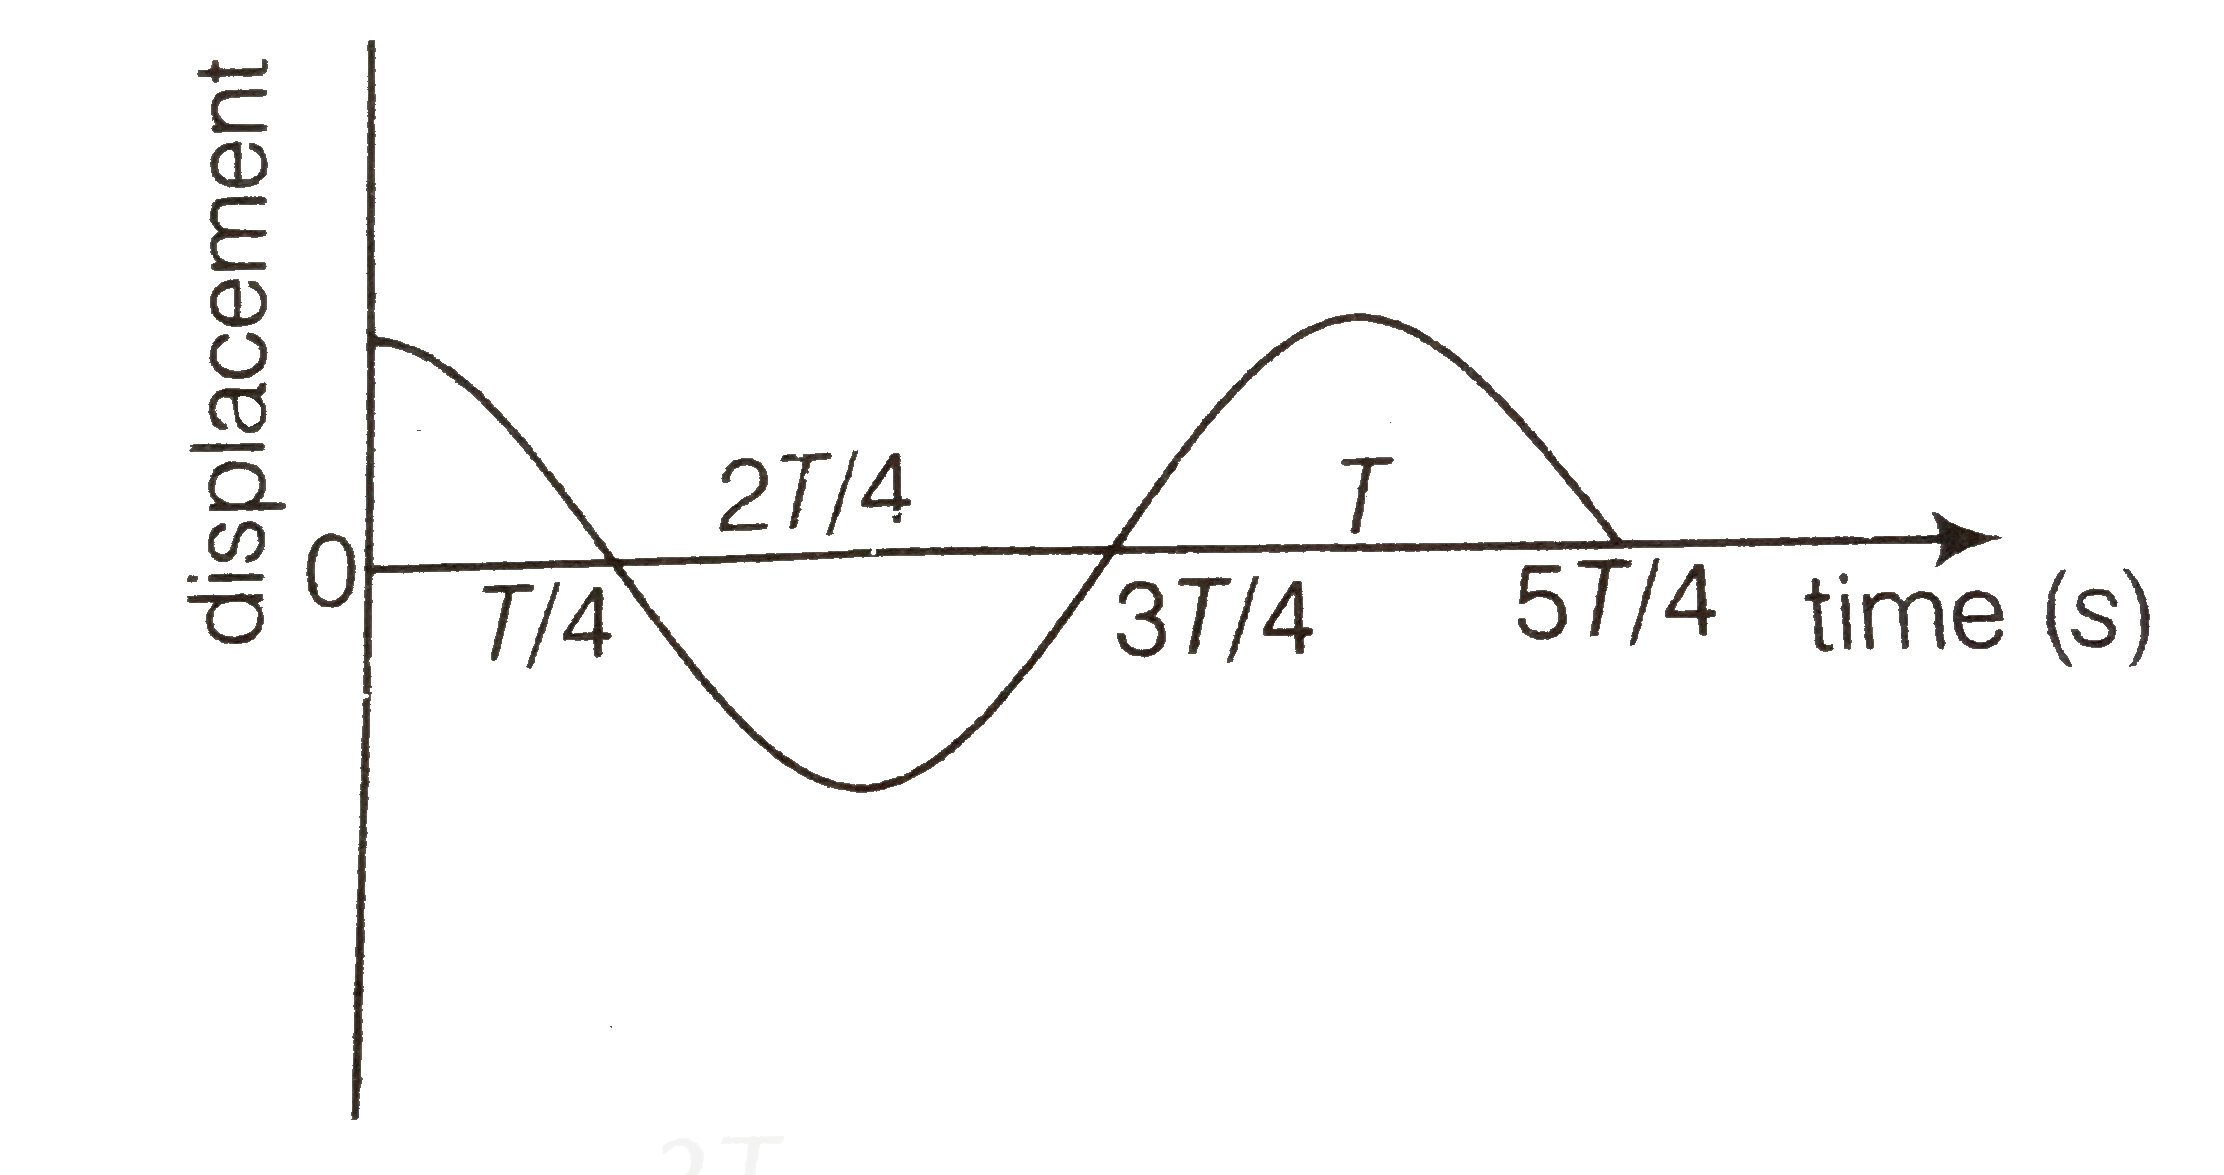
View SolutionThe displacement -time graph of a particle executing SHM is shown in figure. Which of the following statements is/are true ?
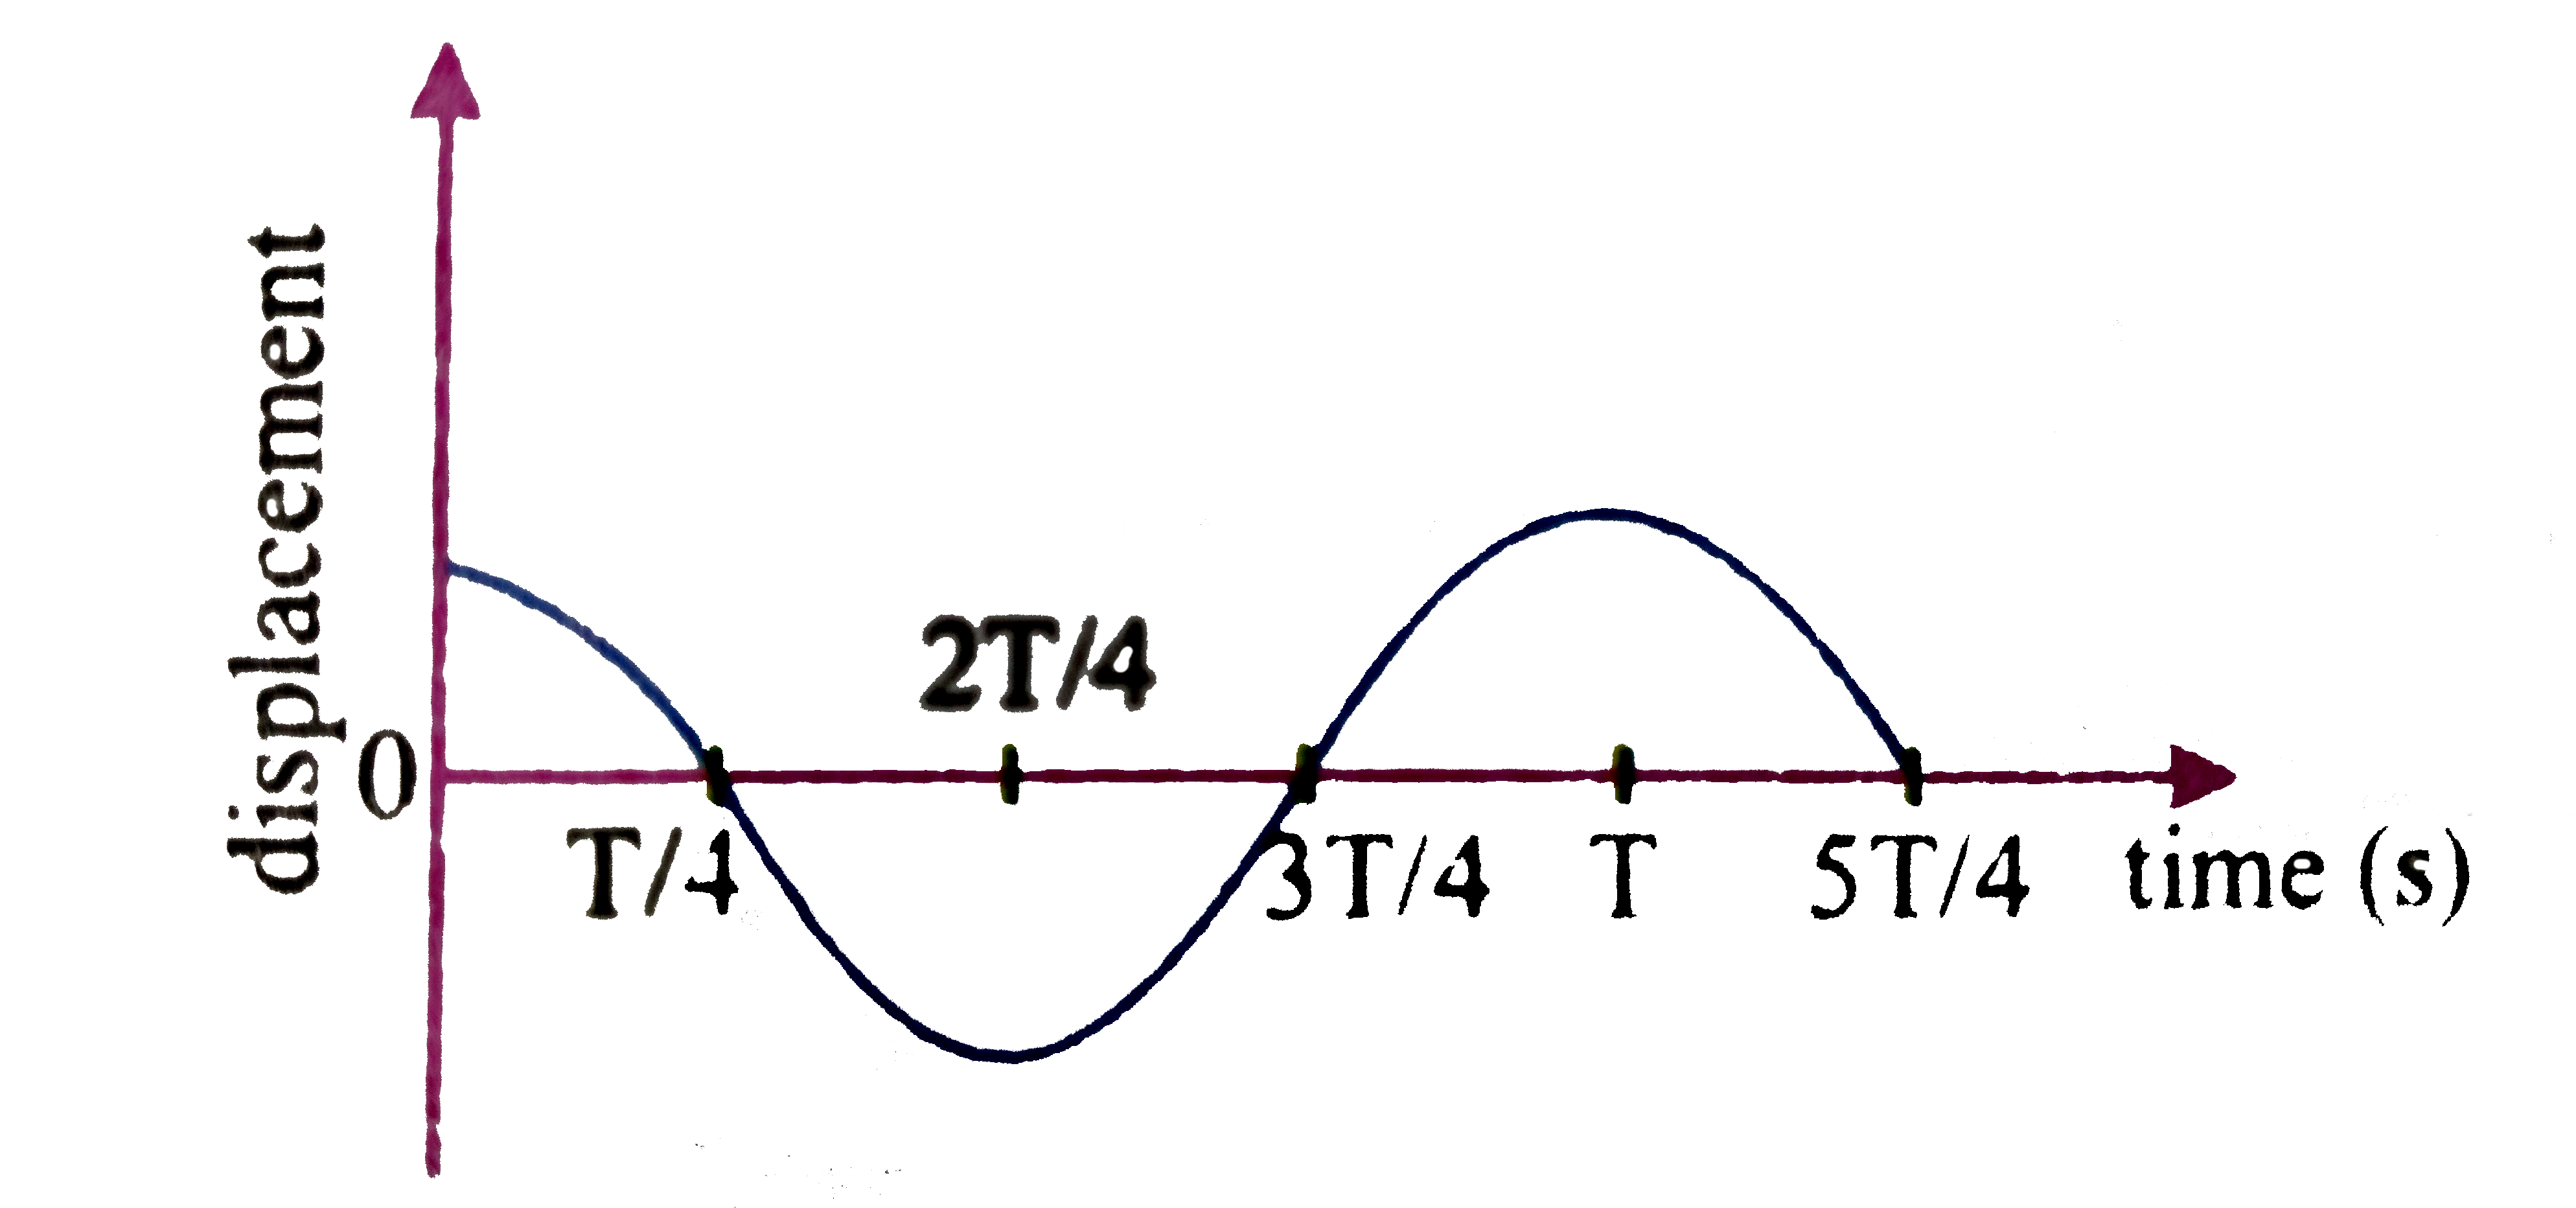
View SolutionThe velocity − time graph of a particle is as shown in figure

View SolutionThe displacement-time graph of a particle is as shown below. It indicates that
View Solution

