Which is correct curve for Charle's law, when the curve is plotted at 0.821 atm pressure for 10 mole ideal gas?
The correct Answer is:b
To solve the question regarding which curve is correct for Charles's law when plotted at 0.821 atm pressure for a 10 mole ideal gas, we can follow these steps:
1. Understand Charles's Law:
Charles's Law states that for a fixed amount of gas at constant pressure, the volume (V) of the gas is directly proportional to its absolute temperature (T). Mathematically, this can be expressed as:
V∝TorV=kT
where k is a constant.
2. Use the Ideal Gas Law:
The ideal gas law is given by:
PV=nRT
For this scenario, we know the pressure (P = 0.821 atm), the number of moles (n = 10), and the gas constant (R = 0.0821 L·atm/(K·mol)).
3. Rearranging the Ideal Gas Law:
Rearranging the ideal gas law for volume gives:
V=nRTP
Substituting the known values:
V=10×0.0821×T0.821
4. Calculate the Constant:
Simplifying the equation:
V=0.821T0.821⇒V=10×0.1T⇒V=1T
Thus, we can see that the slope k is equal to 10×0.08210.821.
5. Determine the Slope:
The slope of the graph (which is VT) is constant, and it indicates that as temperature increases, volume increases linearly.
6. Graph Analysis:
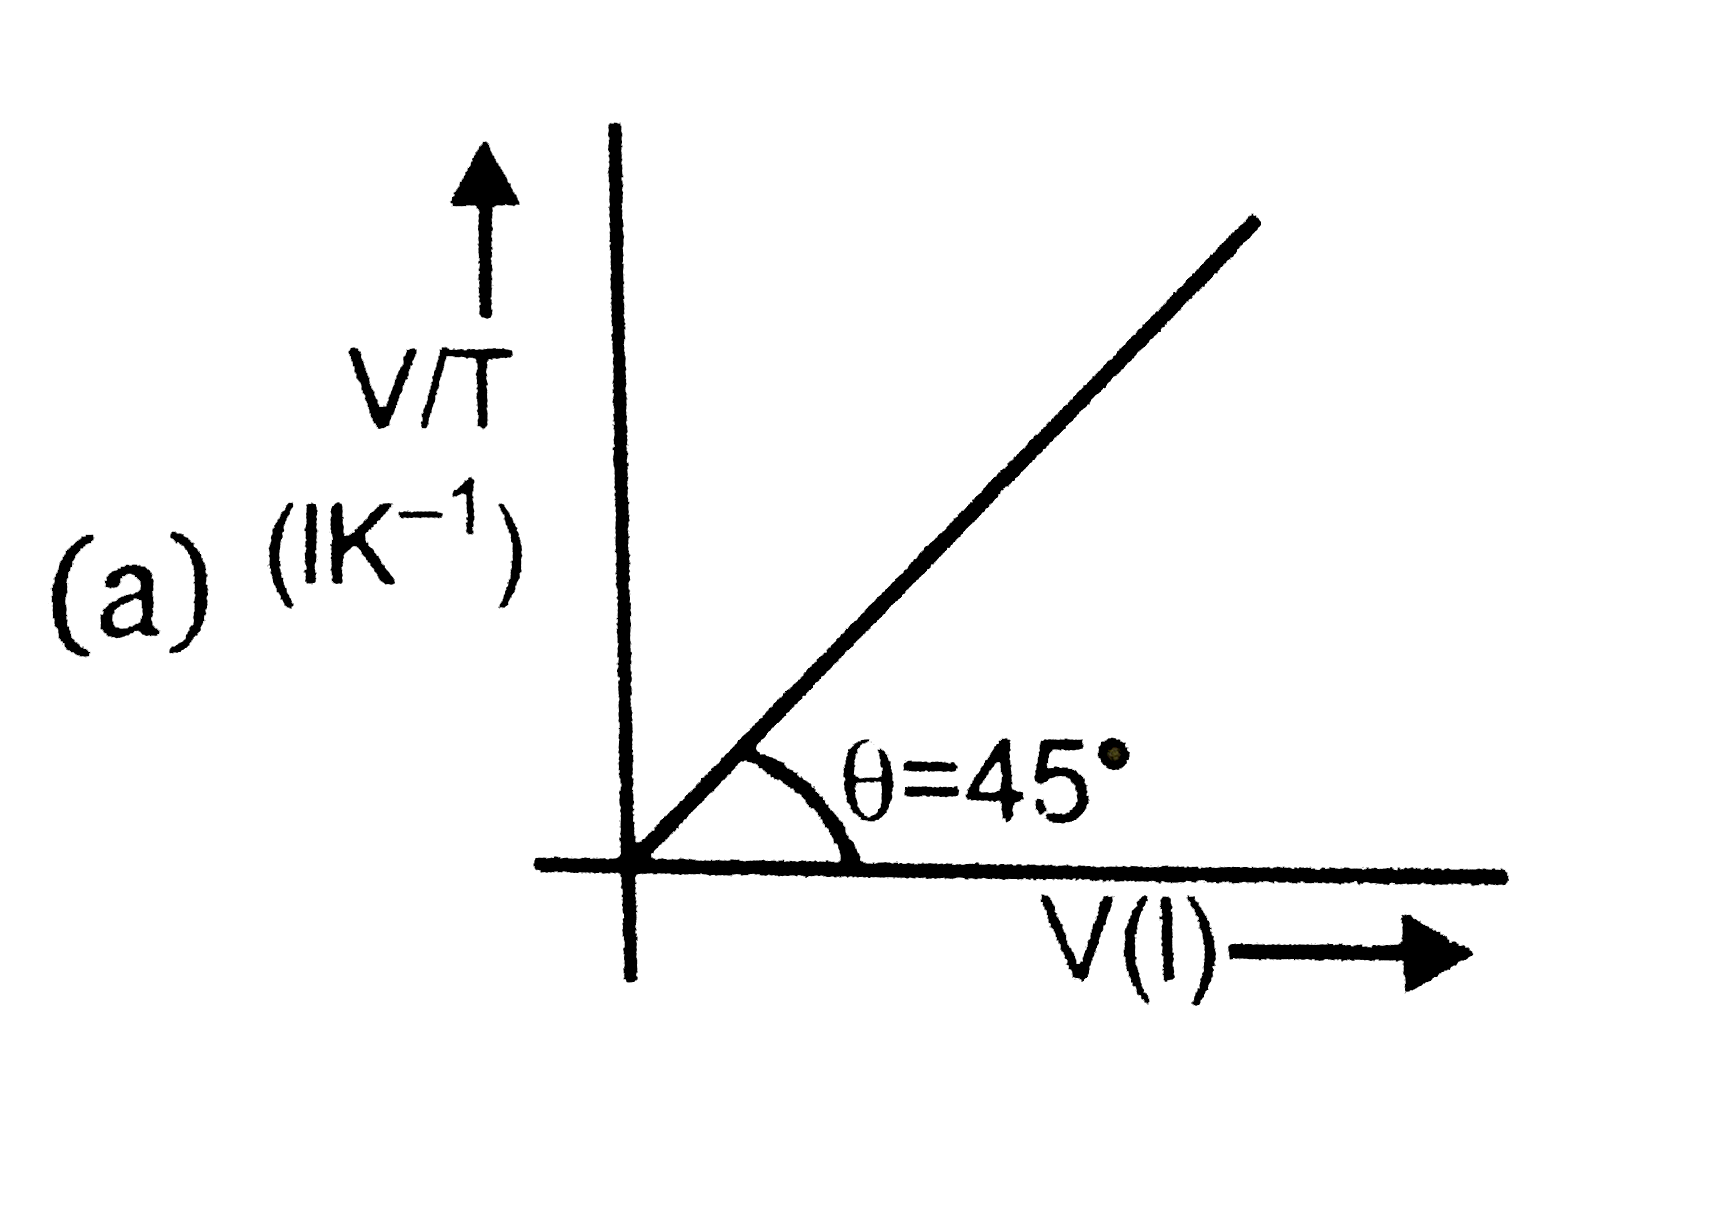
- Option A: If the graph shows V/T increasing, it is incorrect because V/T should be constant.
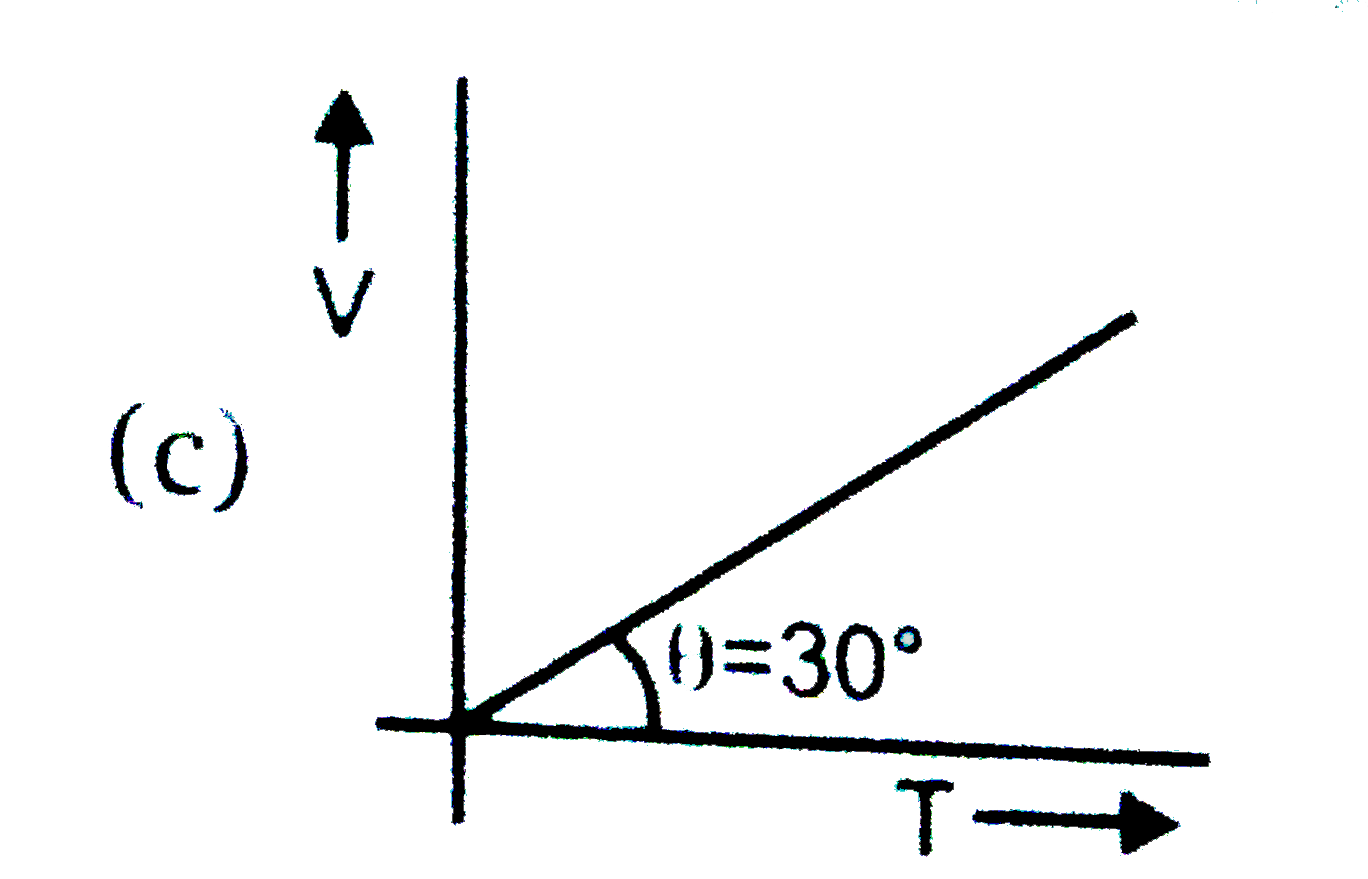
- Option B: If the graph shows a linear relationship between V and T, it is correct as it reflects Charles's Law.
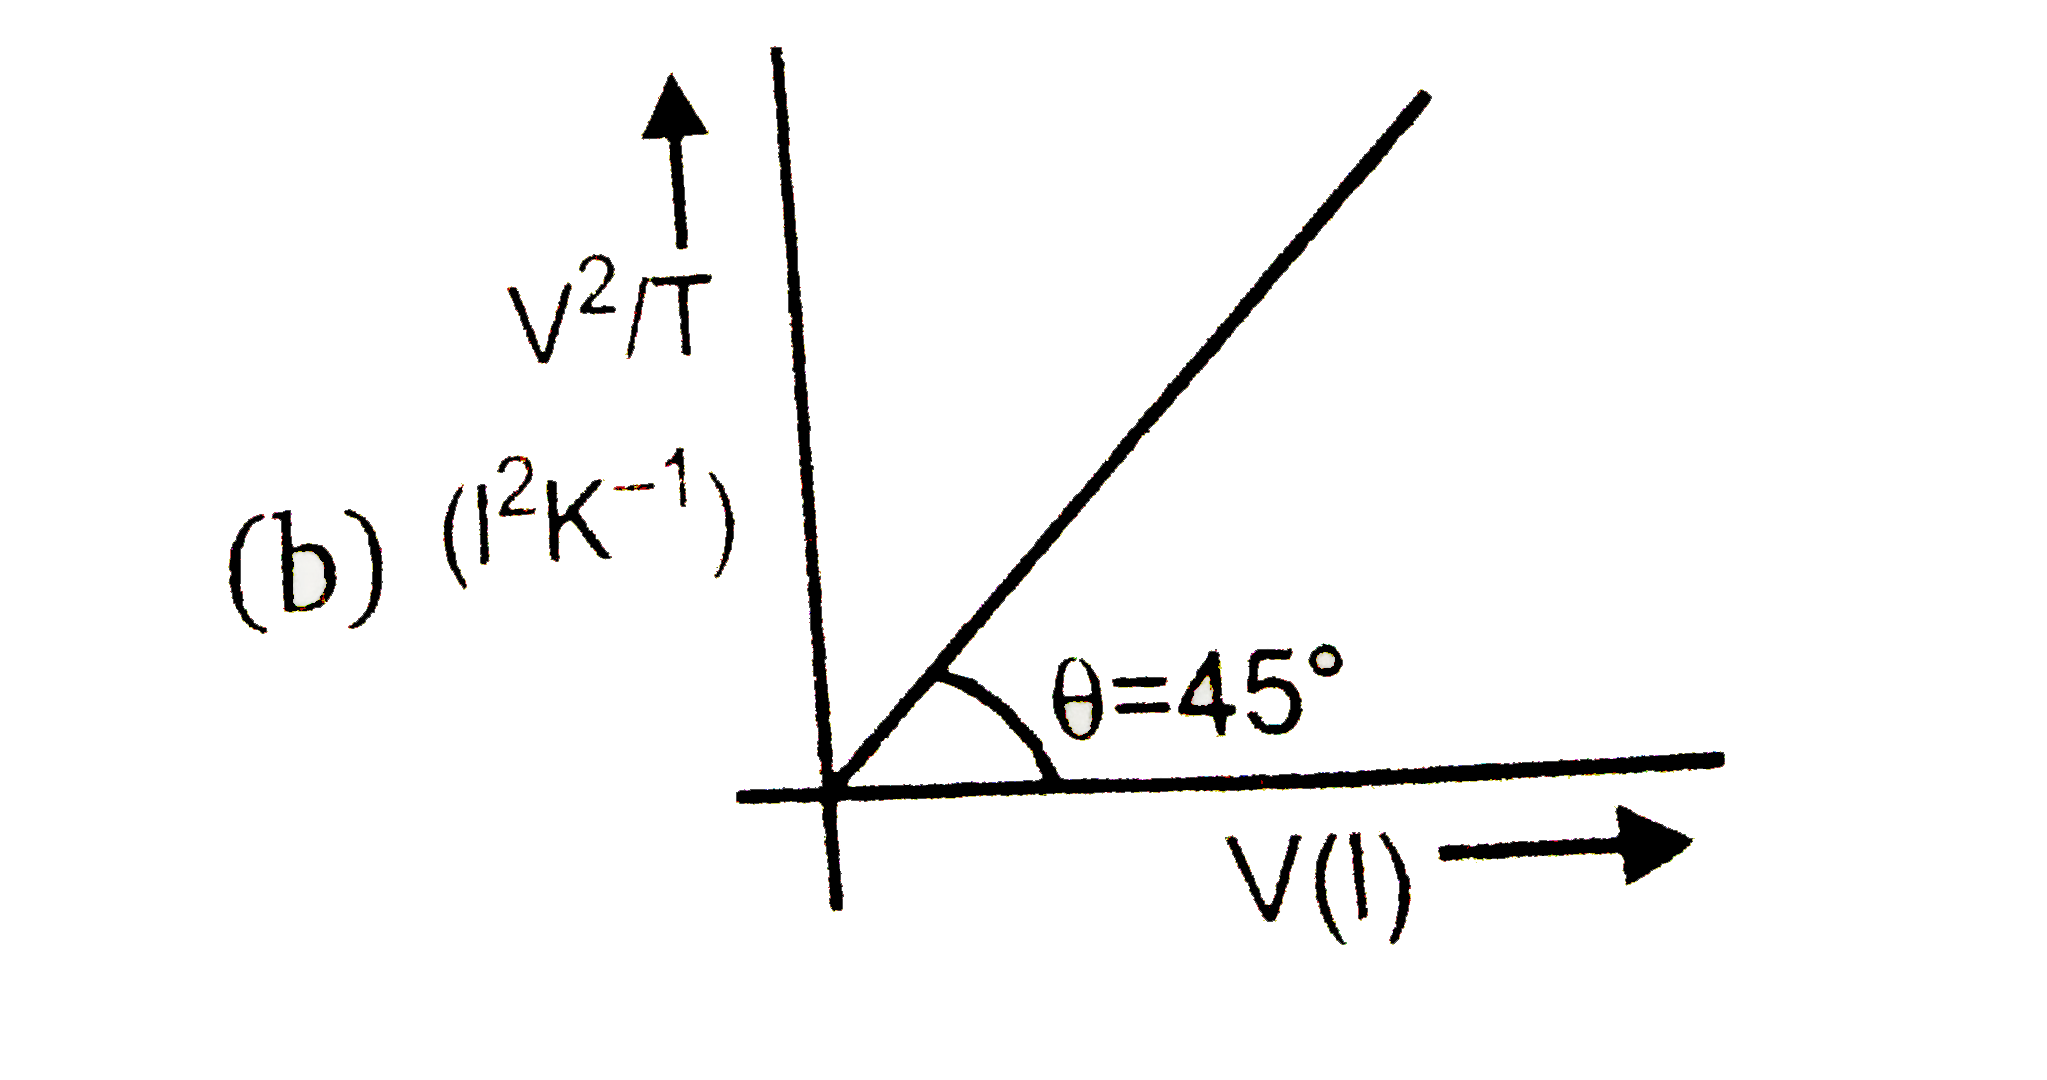
- Option C: If the graph shows V2/T versus V, it is incorrect as it does not represent a direct relationship.
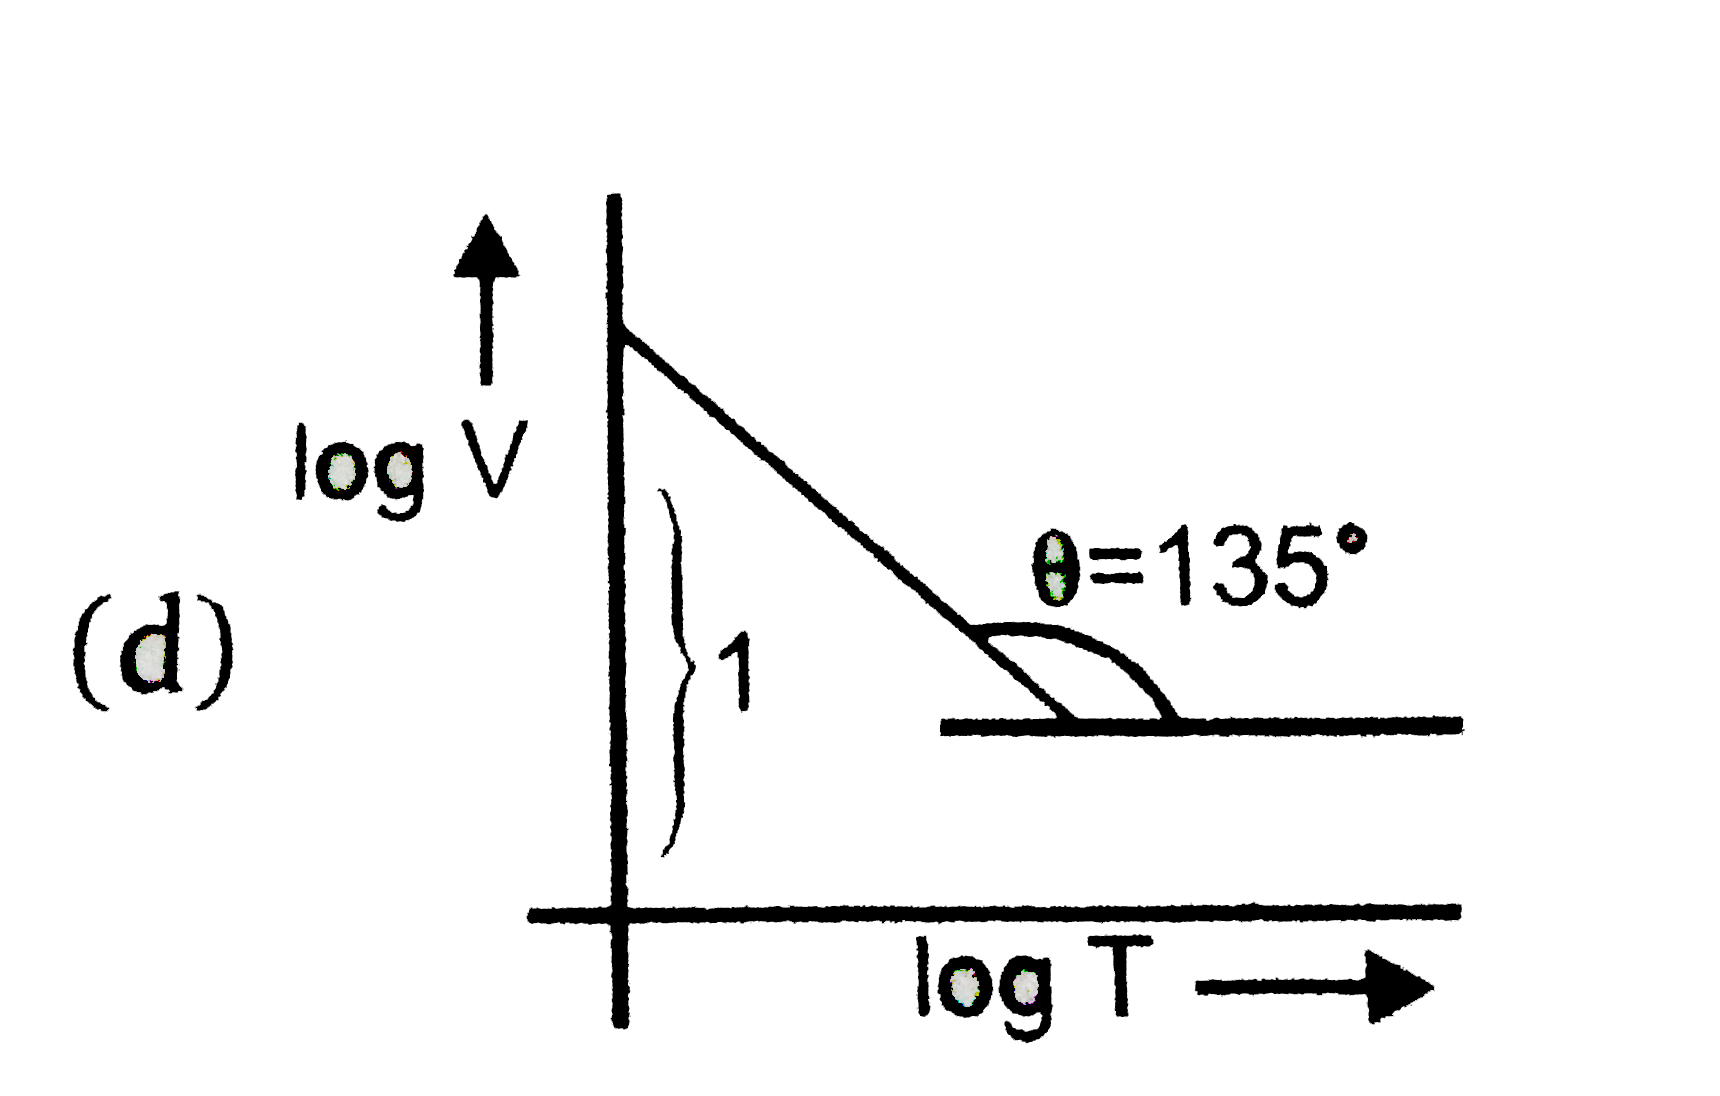
- Option D: If the graph shows logV versus logT, it is incorrect as it does not represent a linear relationship.
7. Conclusion:
The correct curve that represents Charles's Law at the given conditions is the one that shows a direct linear relationship between volume (V) and temperature (T), which corresponds to Option B.
Charles's Law states that for a fixed amount of gas at constant pressure, the volume (V) of the gas is directly proportional to its absolute temperature (T). Mathematically, this can be expressed as:
V∝TorV=kT
where k is a constant.
The ideal gas law is given by:
PV=nRT
For this scenario, we know the pressure (P = 0.821 atm), the number of moles (n = 10), and the gas constant (R = 0.0821 L·atm/(K·mol)).
Rearranging the ideal gas law for volume gives:
V=nRTP
Substituting the known values:
V=10×0.0821×T0.821
Simplifying the equation:
V=0.821T0.821⇒V=10×0.1T⇒V=1T
Thus, we can see that the slope k is equal to 10×0.08210.821.
The slope of the graph (which is VT) is constant, and it indicates that as temperature increases, volume increases linearly.
- Option A: If the graph shows V/T increasing, it is incorrect because V/T should be constant.
- Option B: If the graph shows a linear relationship between V and T, it is correct as it reflects Charles's Law.
- Option C: If the graph shows V2/T versus V, it is incorrect as it does not represent a direct relationship.
- Option D: If the graph shows logV versus logT, it is incorrect as it does not represent a linear relationship.
The correct curve that represents Charles's Law at the given conditions is the one that shows a direct linear relationship between volume (V) and temperature (T), which corresponds to Option B.
Topper's Solved these Questions
- GASEOUS STATEBook:NARENDRA AWASTHI ENGLISHChapter:GASEOUS STATEExercise:Level 2
Explore 30 Videos
- GASEOUS STATEBook:NARENDRA AWASTHI ENGLISHChapter:GASEOUS STATEExercise:Level 3 Passage 1
Explore 4 Videos
- ELECTROCHEMISTRYBook:NARENDRA AWASTHI ENGLISHChapter:ELECTROCHEMISTRYExercise:Subjective problems
Explore 14 Videos
- IONIC EEQUILIBRIUMBook:NARENDRA AWASTHI ENGLISHChapter:IONIC EEQUILIBRIUMExercise:Subjective problems
Explore 1 Video
Similar Questions
Which is incorrect curve for Boyle's law ?
View Solutionwhich in not correct curve for Gay-luacc's law ?
View SolutionWhich curve in figure represents the curve of ideal gas ?
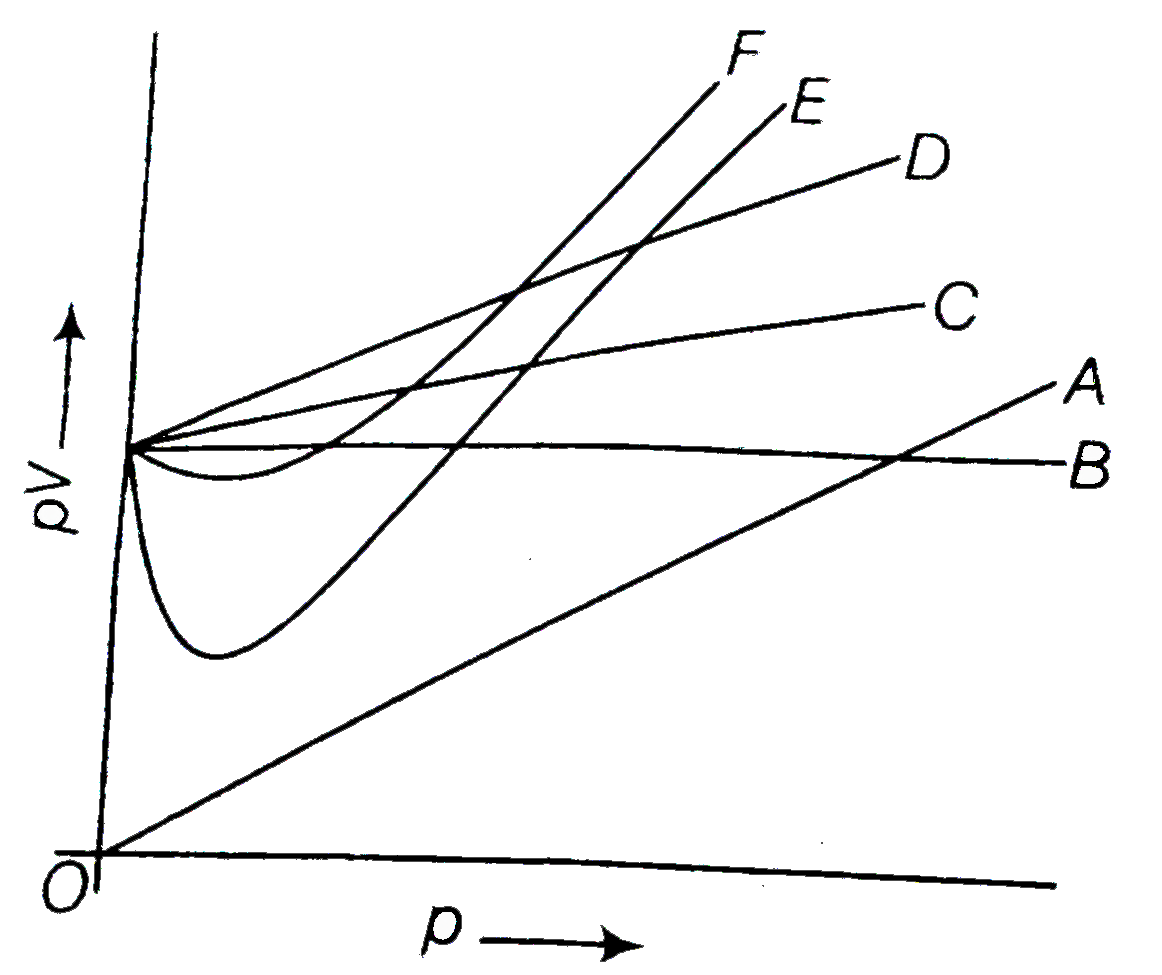
View SolutionWhich curve in figure represents the curve of ideal gas ?

View SolutionAccording to Charles's law, volume of gas is related to pressure as ..........
View SolutionWhat is the shape of the curve obtained on plotting P against PV at constant temperature for an ideal gas ?
View SolutionWhich of the following is/are correct about Charles's law?
View SolutionOut of the three states of matter, only the gases have most of the physical properties common. They neither have definite shapes nor volumes. Upon mixing they form homogeneous mixture irrespective of their nature and can also be compressed on applying pressure. In addition to these, the gases obey different gas laws such as boyle's Law, Charles's Law, Dalton's Law of partial pressures, Graham's Law of diffusion etc. Based upon these laws, ideal gas equation PV=nRT has been derived.
When the product of pressure and volume is plotted against pressure for a given amount of a gas, the obtained is
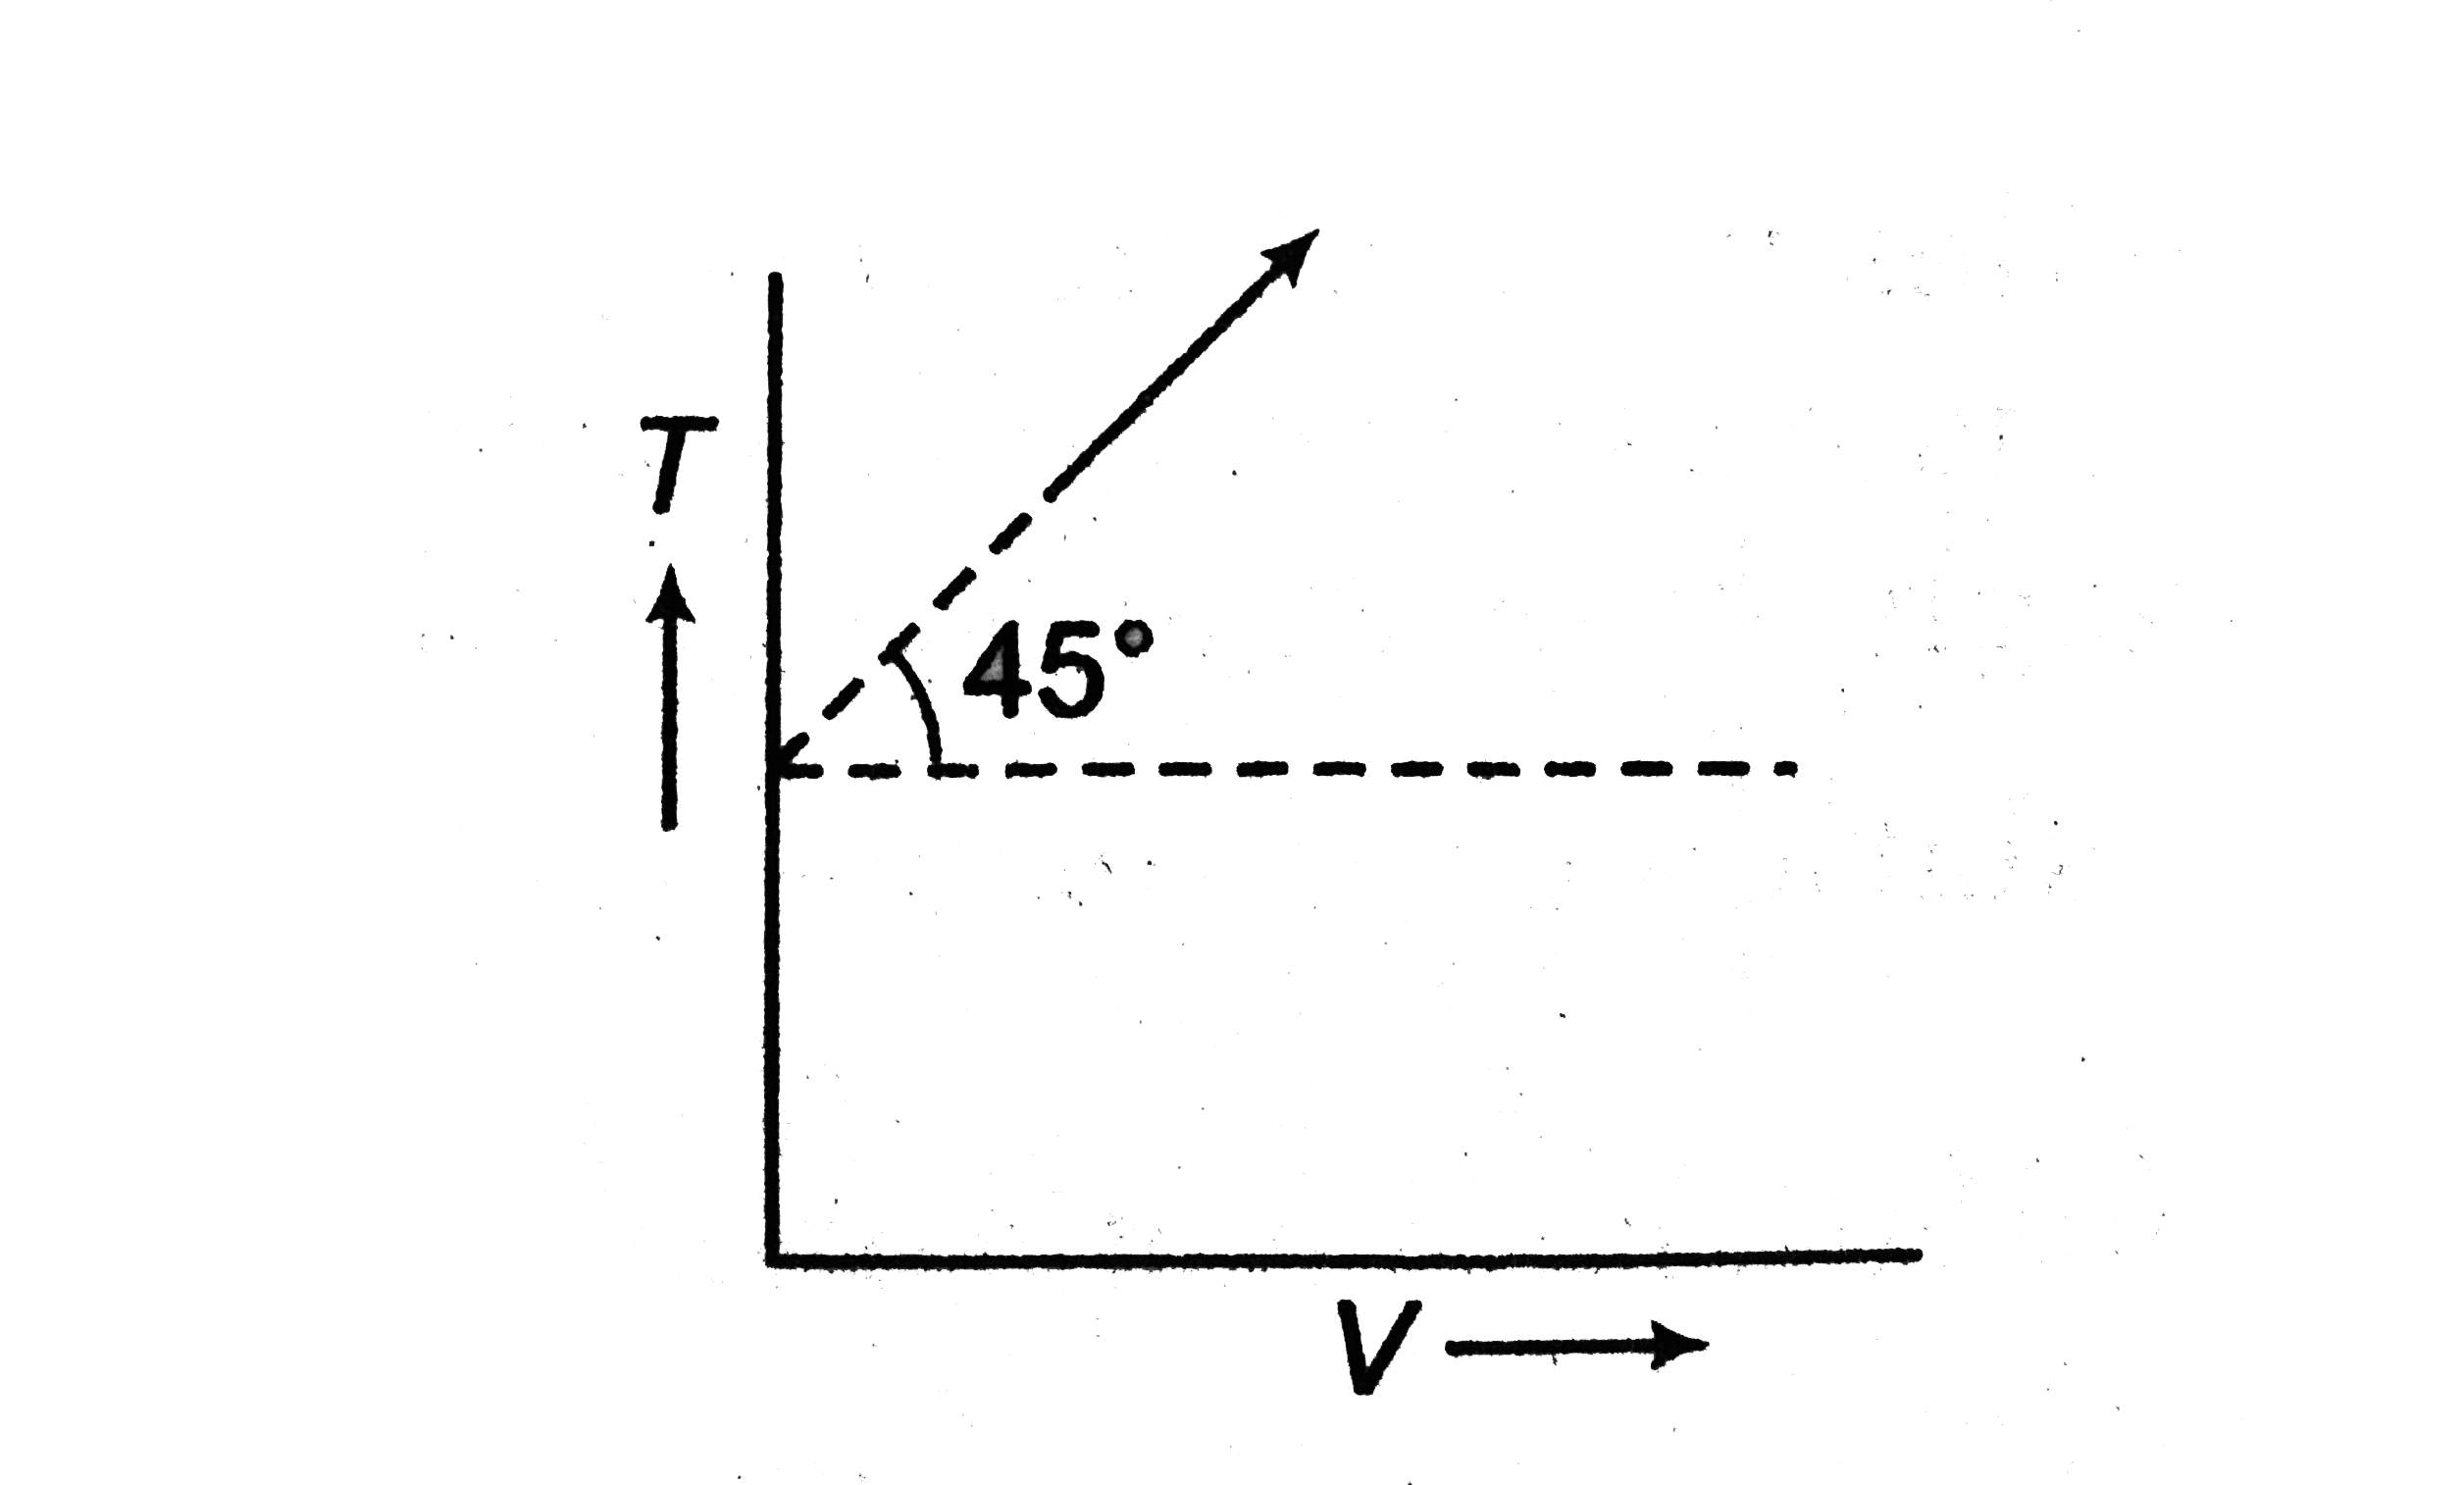
View SolutionThe given curve represents the variation of temperature as a function of volume for one mole of an ideal gas. Which of the following curves best represents the variation of pressure as a function of volume?
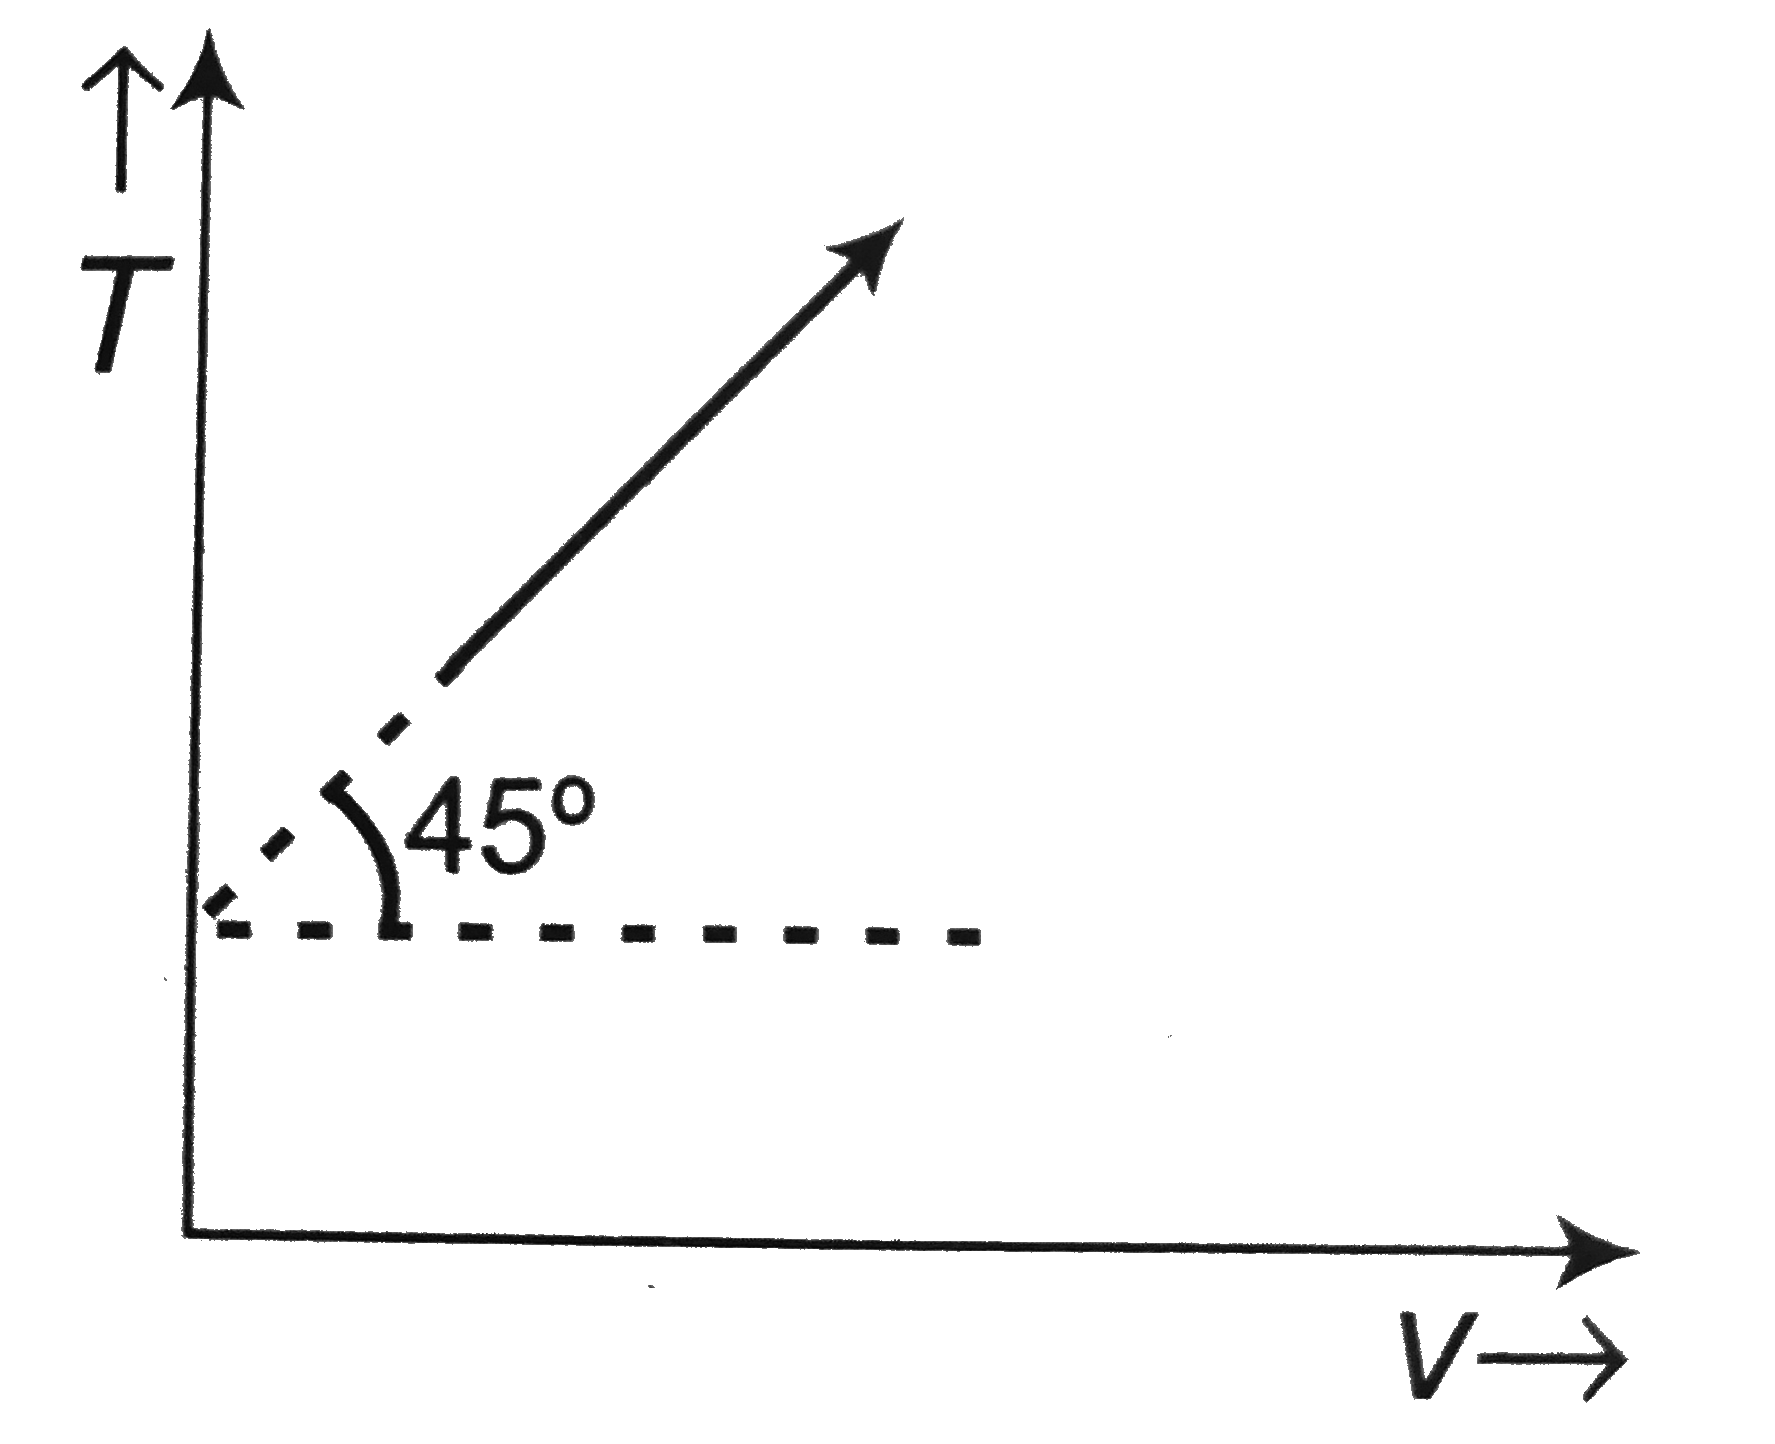
View SolutionThe given curve represents the variation of temperatue as a function of volume for one mole of an ideal gas. Which of the following curves best represents the variation of pressure as a function of volume ?
 .
.
View Solution