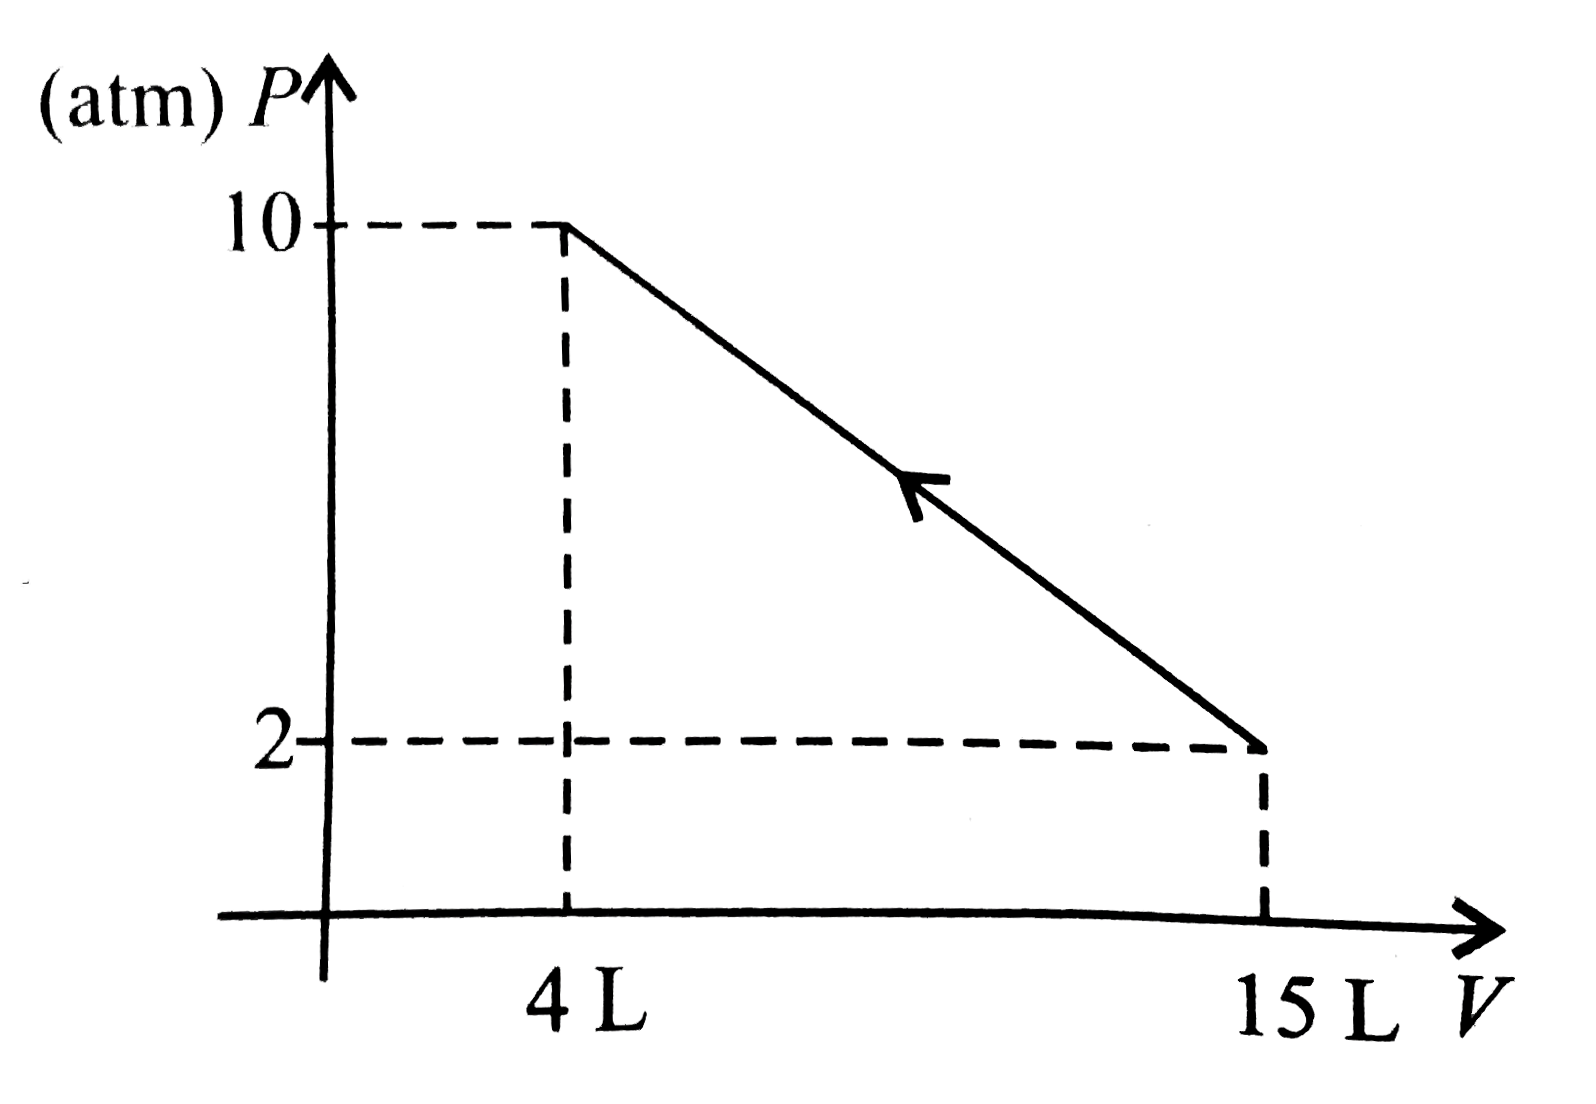
One mole of a gas changed from its initial state (15L,2 atm) to final state (4L,10 atm) reversibly. If this change can be represented by a straight line in P - V curve maximum temperature (approximate), the gas attained is Then find the value of x.
The correct Answer is:7
To solve the problem step by step, we will follow the process outlined in the video transcript, ensuring we derive the maximum temperature the gas attained during the reversible change from its initial state to its final state.
Step 1: Understand the Initial and Final States
We have:
- Initial state: V1=15L, P1=2atm
- Final state: V2=4L, P2=10atm
Step 2: Plot the Points on a P-V Diagram
On a P-V diagram, we plot the initial state at (15 L, 2 atm) and the final state at (4 L, 10 atm). The line connecting these two points will represent the reversible process.
Step 3: Find the Equation of the Line
Using the two points, we can find the equation of the line in the form P−P1=P2−P1V2−V1(V−V1).
Substituting the values:
- P1=2
- P2=10
- V1=15
- V2=4
The slope m of the line is:
m=10−24−15=8−11=−811
Now, we can write the equation of the line:
P−2=−811(V−15)
Rearranging gives:
P=−811V+12011+2
P=−811V+14211
Step 4: Relate Pressure, Volume, and Temperature
Using the ideal gas law:
PV=nRT
For one mole of gas (n=1):
T=PVR
Substituting for P:
T=VR(−811V+14211)
T=1R(−811V2+14211V)
Step 5: Find the Maximum Temperature
To find the maximum temperature, we differentiate T with respect to V and set the derivative to zero:
dTdV=1R(−1611V+14211)=0
Setting the equation to zero gives:
−1611V+14211=0
Solving for V:
V=14216=8.875L
Step 6: Calculate the Maximum Temperature
Substituting V=8.875 L back into the temperature equation:
T=1R(−811(8.875)2+14211(8.875))
Using R=0.0821L atm K−1mol−1:
T=10.0821(−811(79.515625)+14211(8.875))
Calculating the values:
T=10.0821(−636.12511+1260.2511)
T=10.0821(624.12511)
T≈56.830.0821≈693.07K
Step 7: Express in the Required Form
The temperature can be expressed as:
T≈6.93×10²K
Thus, x≈7.
Final Answer
The value of x is 7.
We have:
- Initial state: V1=15L, P1=2atm
- Final state: V2=4L, P2=10atm
On a P-V diagram, we plot the initial state at (15 L, 2 atm) and the final state at (4 L, 10 atm). The line connecting these two points will represent the reversible process.
Using the two points, we can find the equation of the line in the form P−P1=P2−P1V2−V1(V−V1).
- P1=2
- P2=10
- V1=15
- V2=4
m=10−24−15=8−11=−811
P−2=−811(V−15)
Rearranging gives:
P=−811V+12011+2
P=−811V+14211
Using the ideal gas law:
PV=nRT
For one mole of gas (n=1):
T=PVR
Substituting for P:
T=VR(−811V+14211)
T=1R(−811V2+14211V)
To find the maximum temperature, we differentiate T with respect to V and set the derivative to zero:
dTdV=1R(−1611V+14211)=0
Setting the equation to zero gives:
−1611V+14211=0
Solving for V:
V=14216=8.875L
Substituting V=8.875 L back into the temperature equation:
T=1R(−811(8.875)2+14211(8.875))
Using R=0.0821L atm K−1mol−1:
T=10.0821(−811(79.515625)+14211(8.875))
Calculating the values:
T=10.0821(−636.12511+1260.2511)
T=10.0821(624.12511)
T≈56.830.0821≈693.07K
The temperature can be expressed as:
T≈6.93×10²K
Thus, x≈7.
The value of x is 7.
Topper's Solved these Questions
- GASEOUS STATEBook:NARENDRA AWASTHI ENGLISHChapter:GASEOUS STATEExercise:Assertion-ReasonType Questions
Explore 16 Videos
- ELECTROCHEMISTRYBook:NARENDRA AWASTHI ENGLISHChapter:ELECTROCHEMISTRYExercise:Subjective problems
Explore 14 Videos
- IONIC EEQUILIBRIUMBook:NARENDRA AWASTHI ENGLISHChapter:IONIC EEQUILIBRIUMExercise:Subjective problems
Explore 1 Video
Similar Questions
1mol of a gas is changed from its initial state (15L,2atm) to final state (4L,10atm). If this change can be represented by a straight line in P−V curve, calculate the maximum temperature that, the gas attained.
View SolutionWhen a sample of ideal gas is changed from an initial state to a final state, various curves can be plotted for the process like P-V curve, V-T curve,P-T curve etc.
For example, P-V curve for a fixed amount of an ideal gas at constant temperature is a rectangular hyperbola, V-T curve for a fixed amount of an ideal gas at constant volume is again a straight line. However, the shapes may vary if the constant parameters are also changed.
Now, answer the following questions :
Two moles of an ideal gas is changed from its initial state (16 atm, 6L) to final state (4 atm, 15L) in such a way that this change can be represented by a straight line in P-V curve.The maximum temperature attained by the gas during the above change is :(Take : R=112LatmK−1mol−1)
View Solution
Knowledge Check
One mole of an ideal gas goes from an initial state A to final state B via two processs : It first undergoes isothermal expansion from volume V to 3V and then its volume is reduced from 3V to V at constant pressure. The correct P−V diagram representing the two process in (figure)
A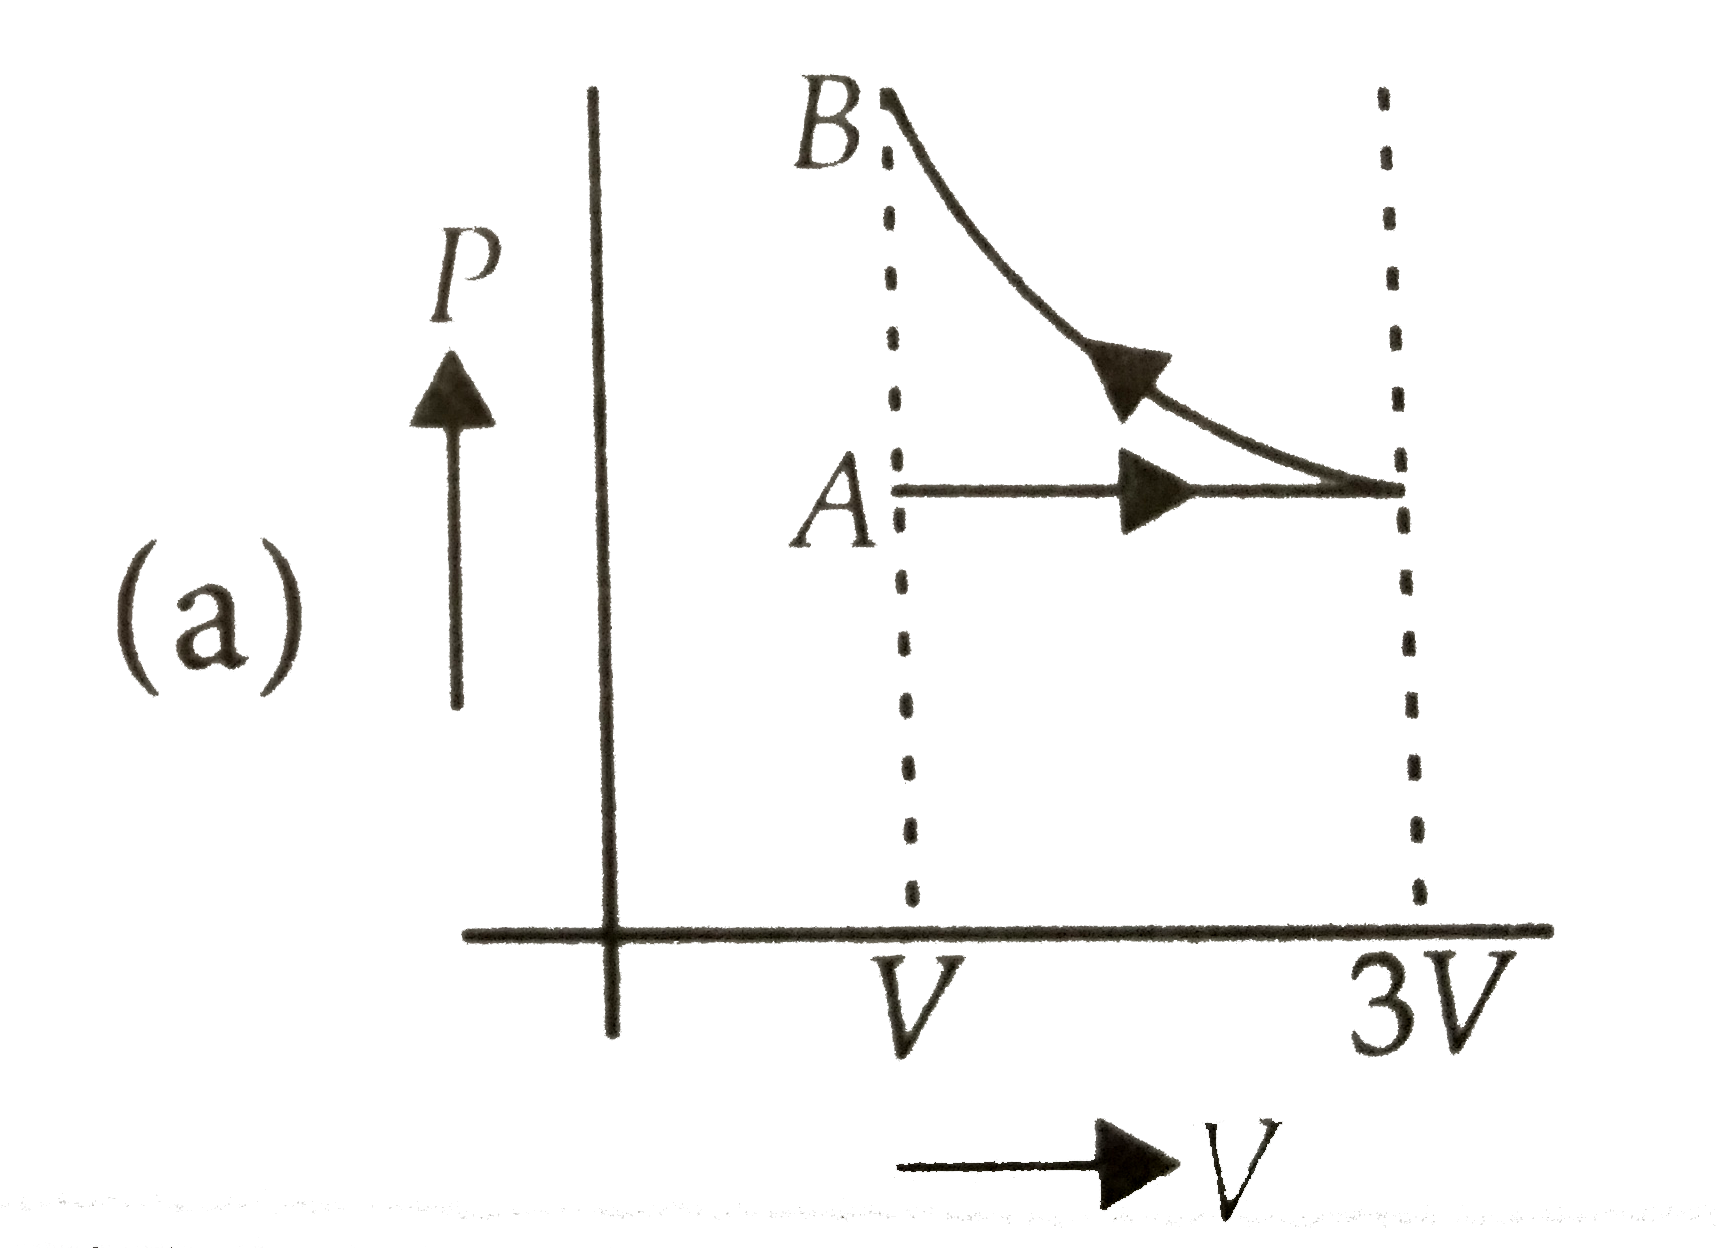 B
B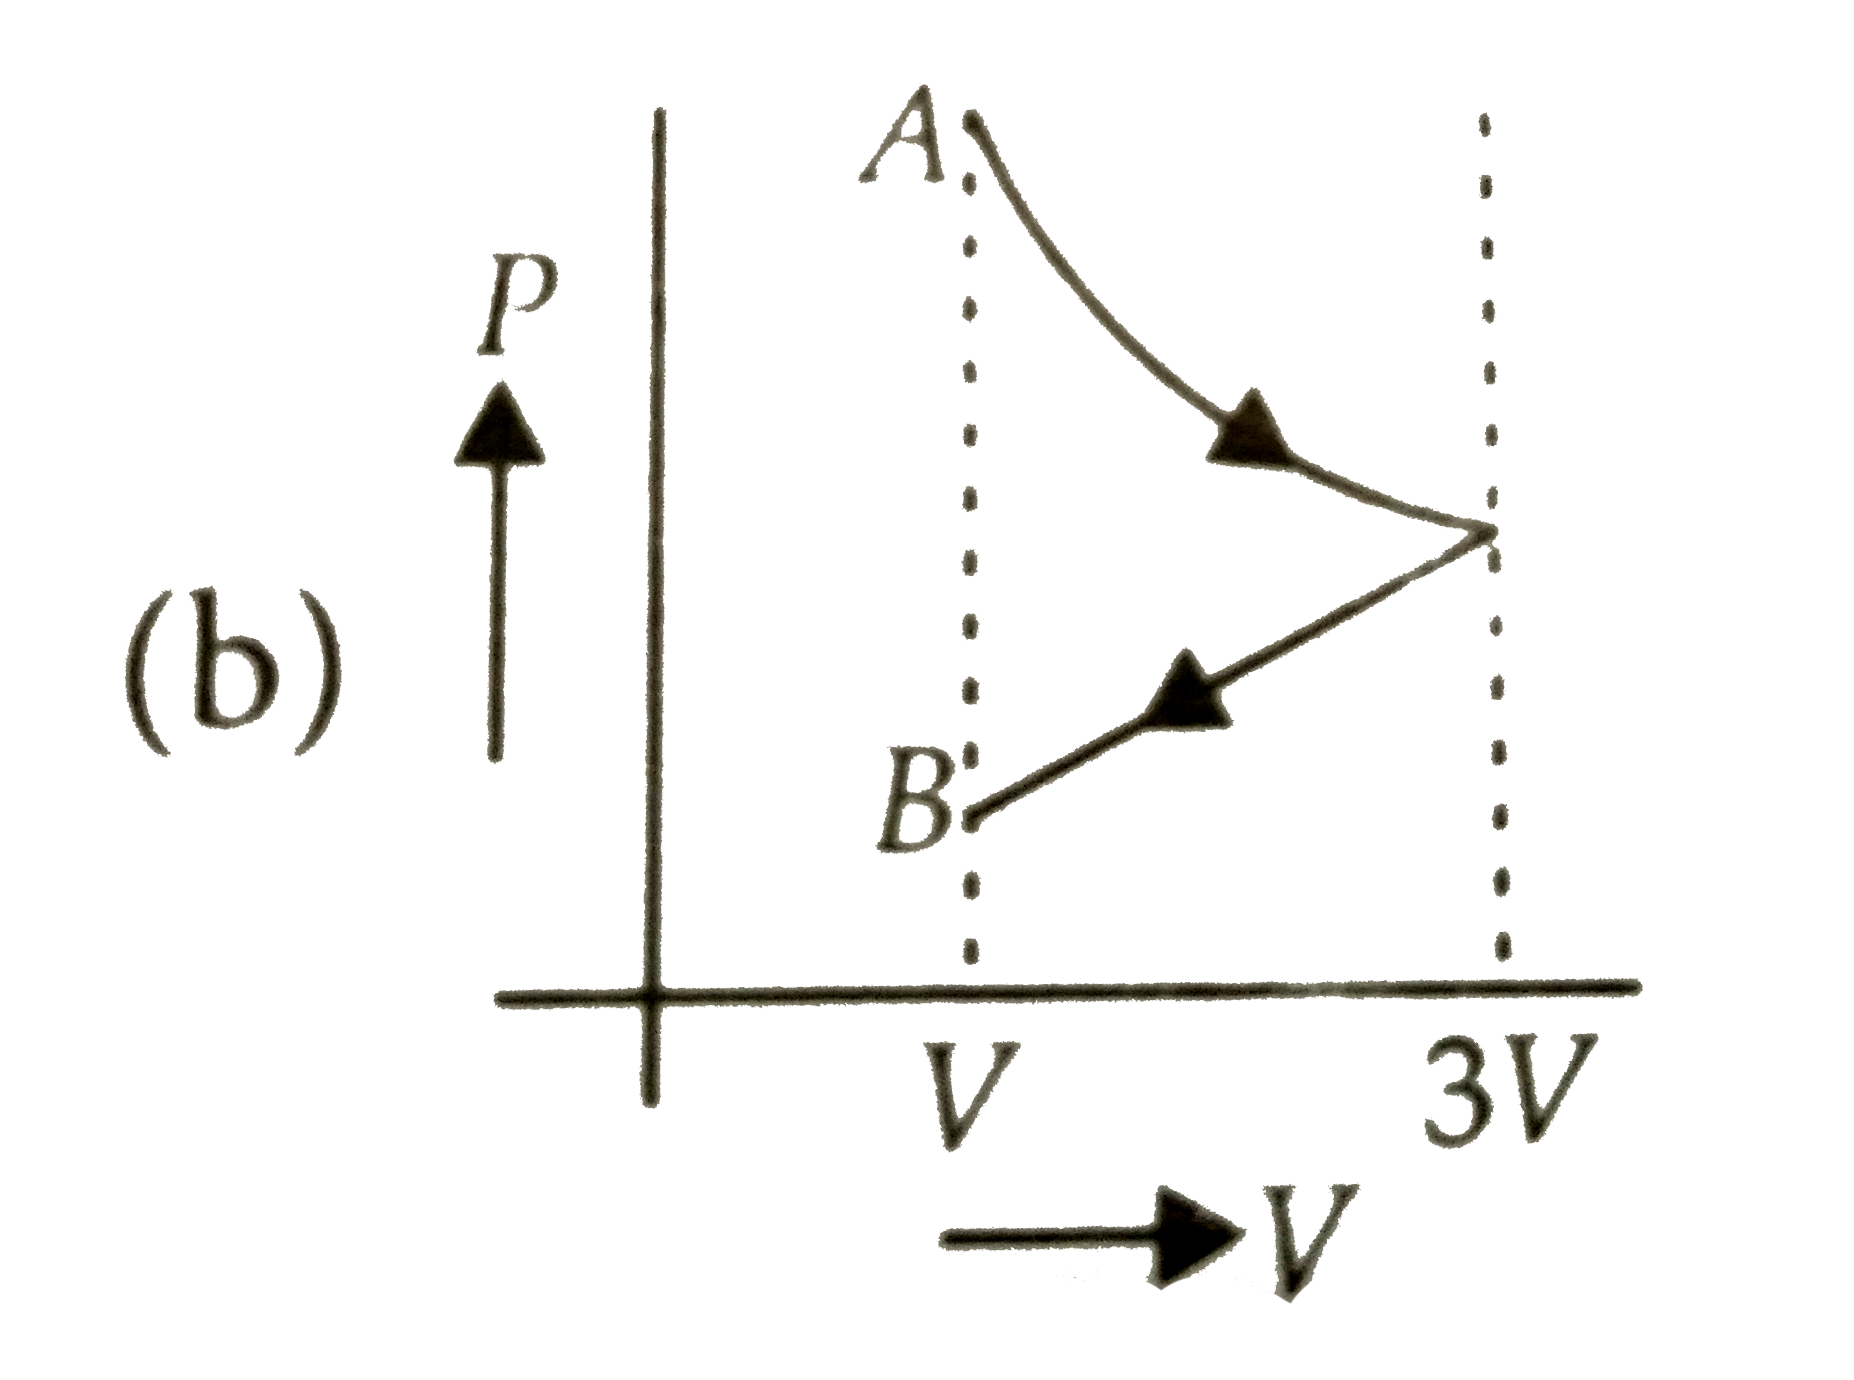 C
C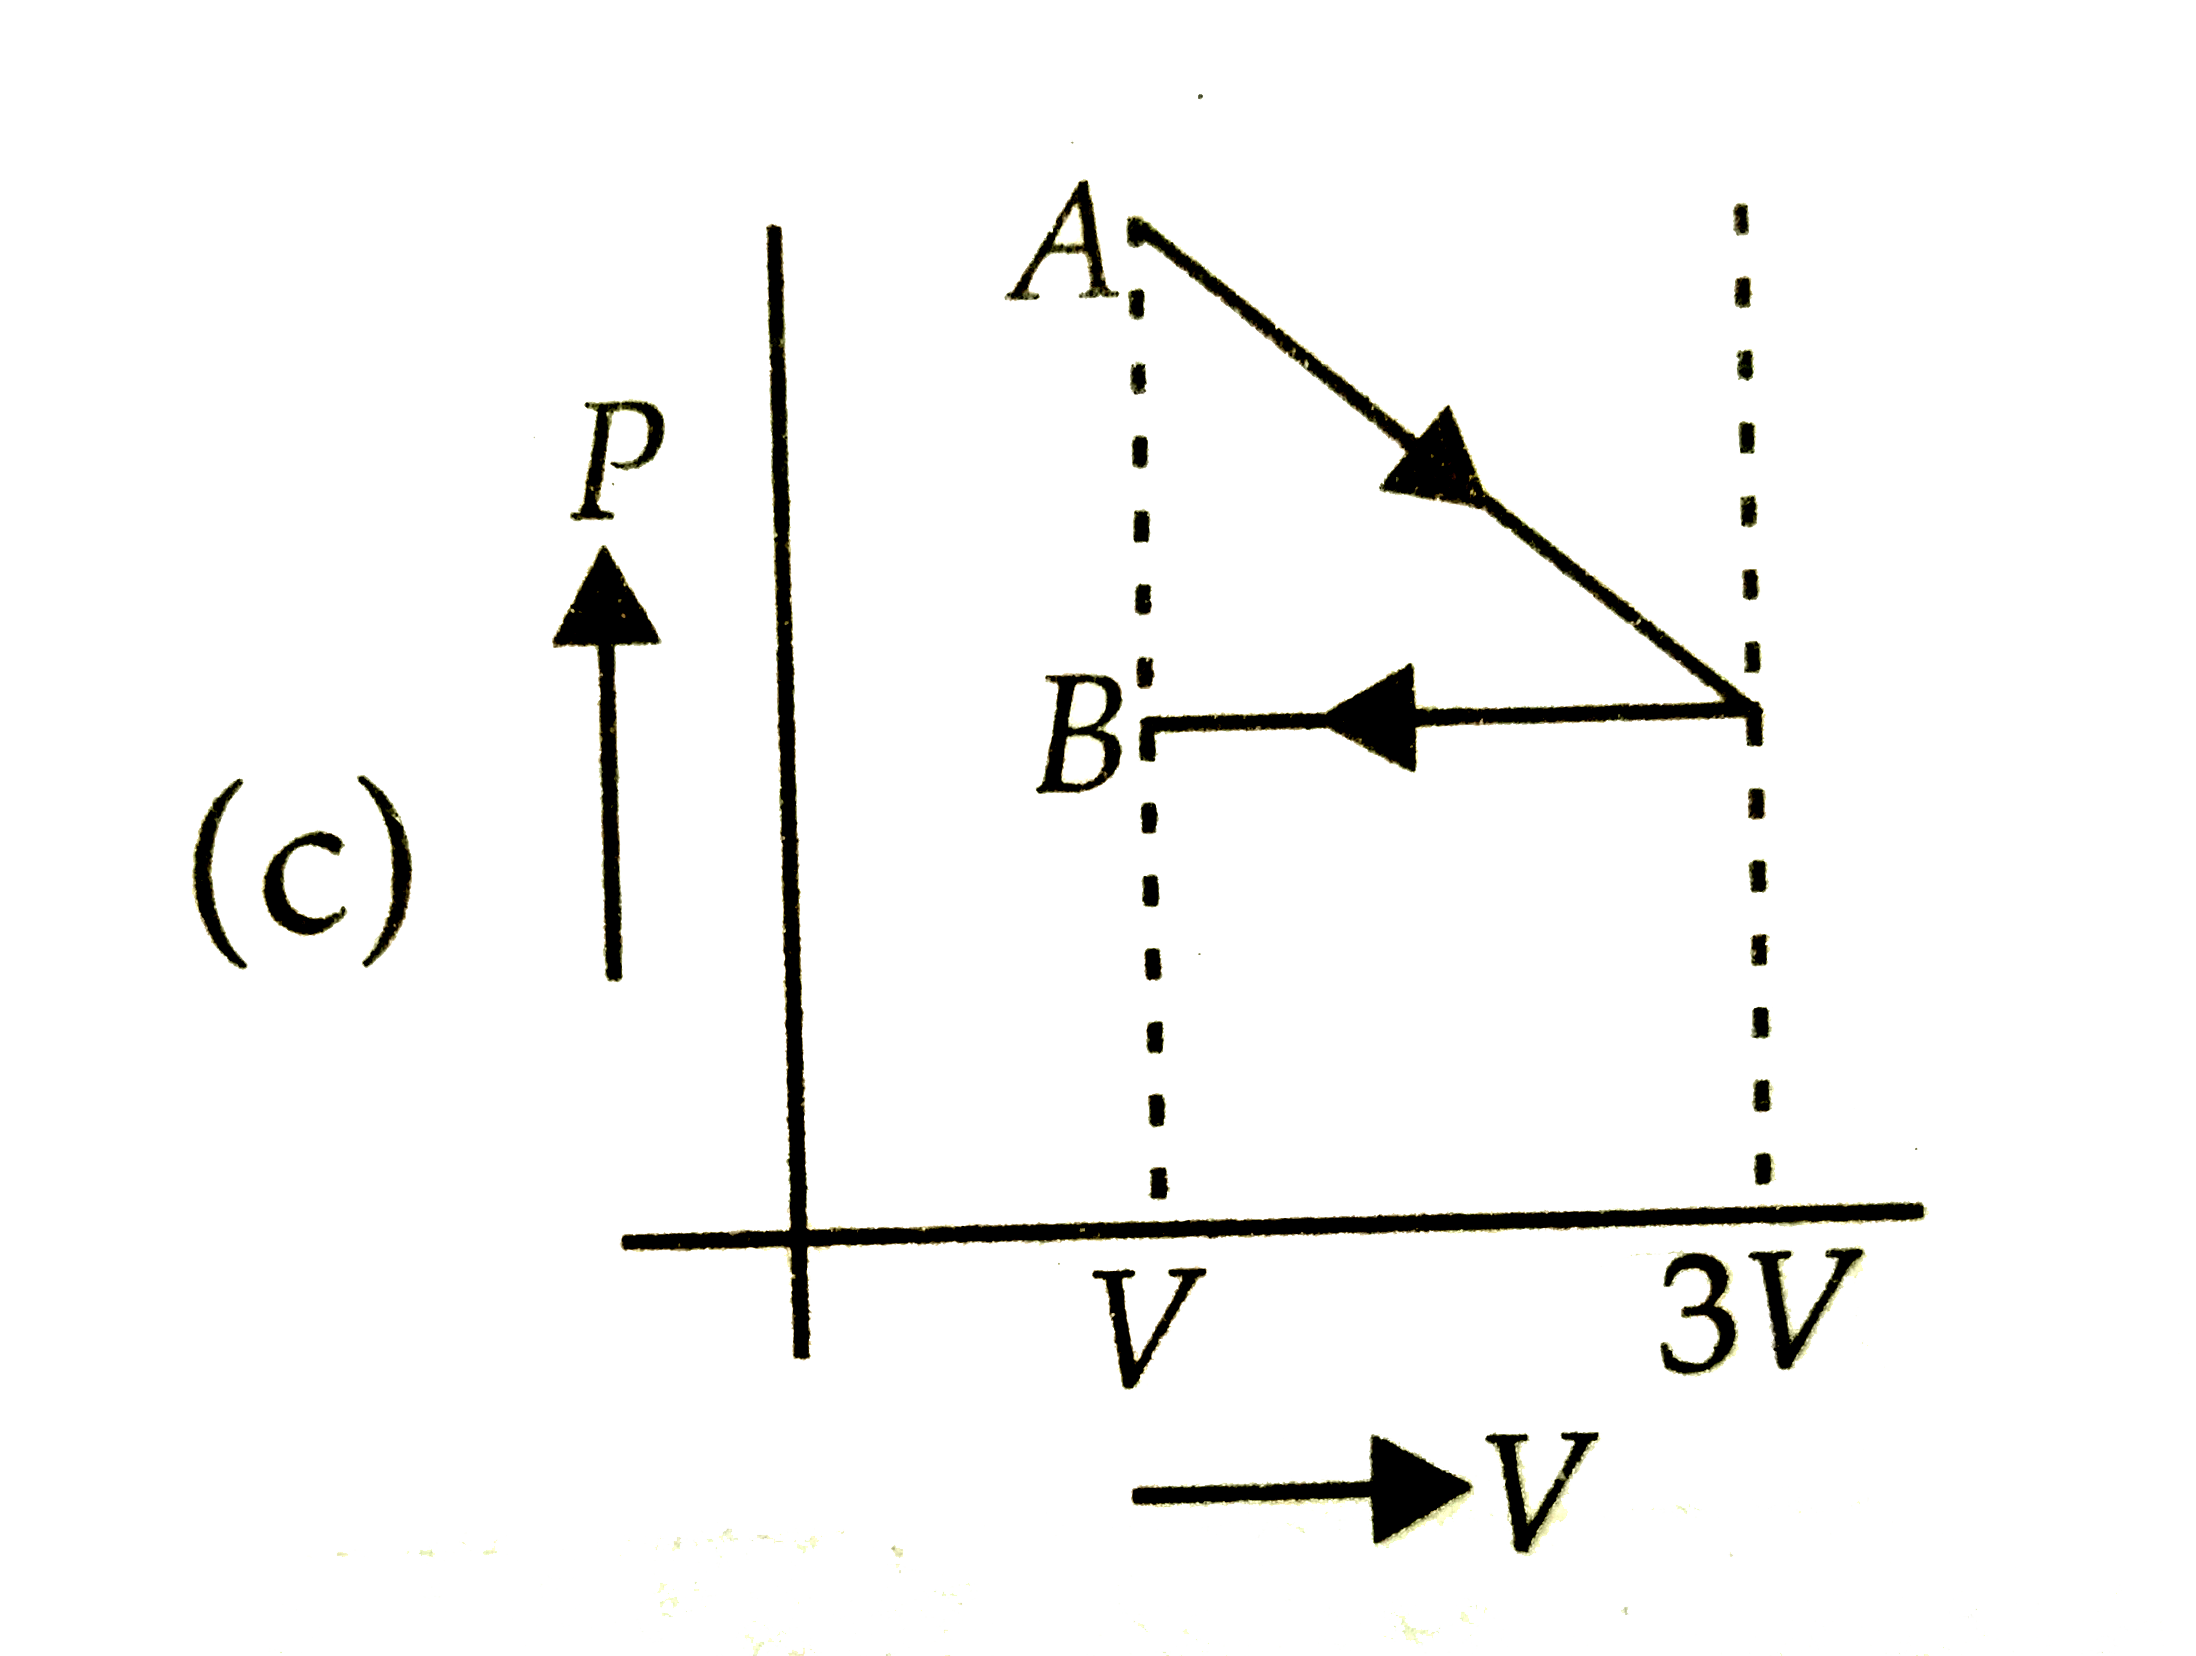 D
D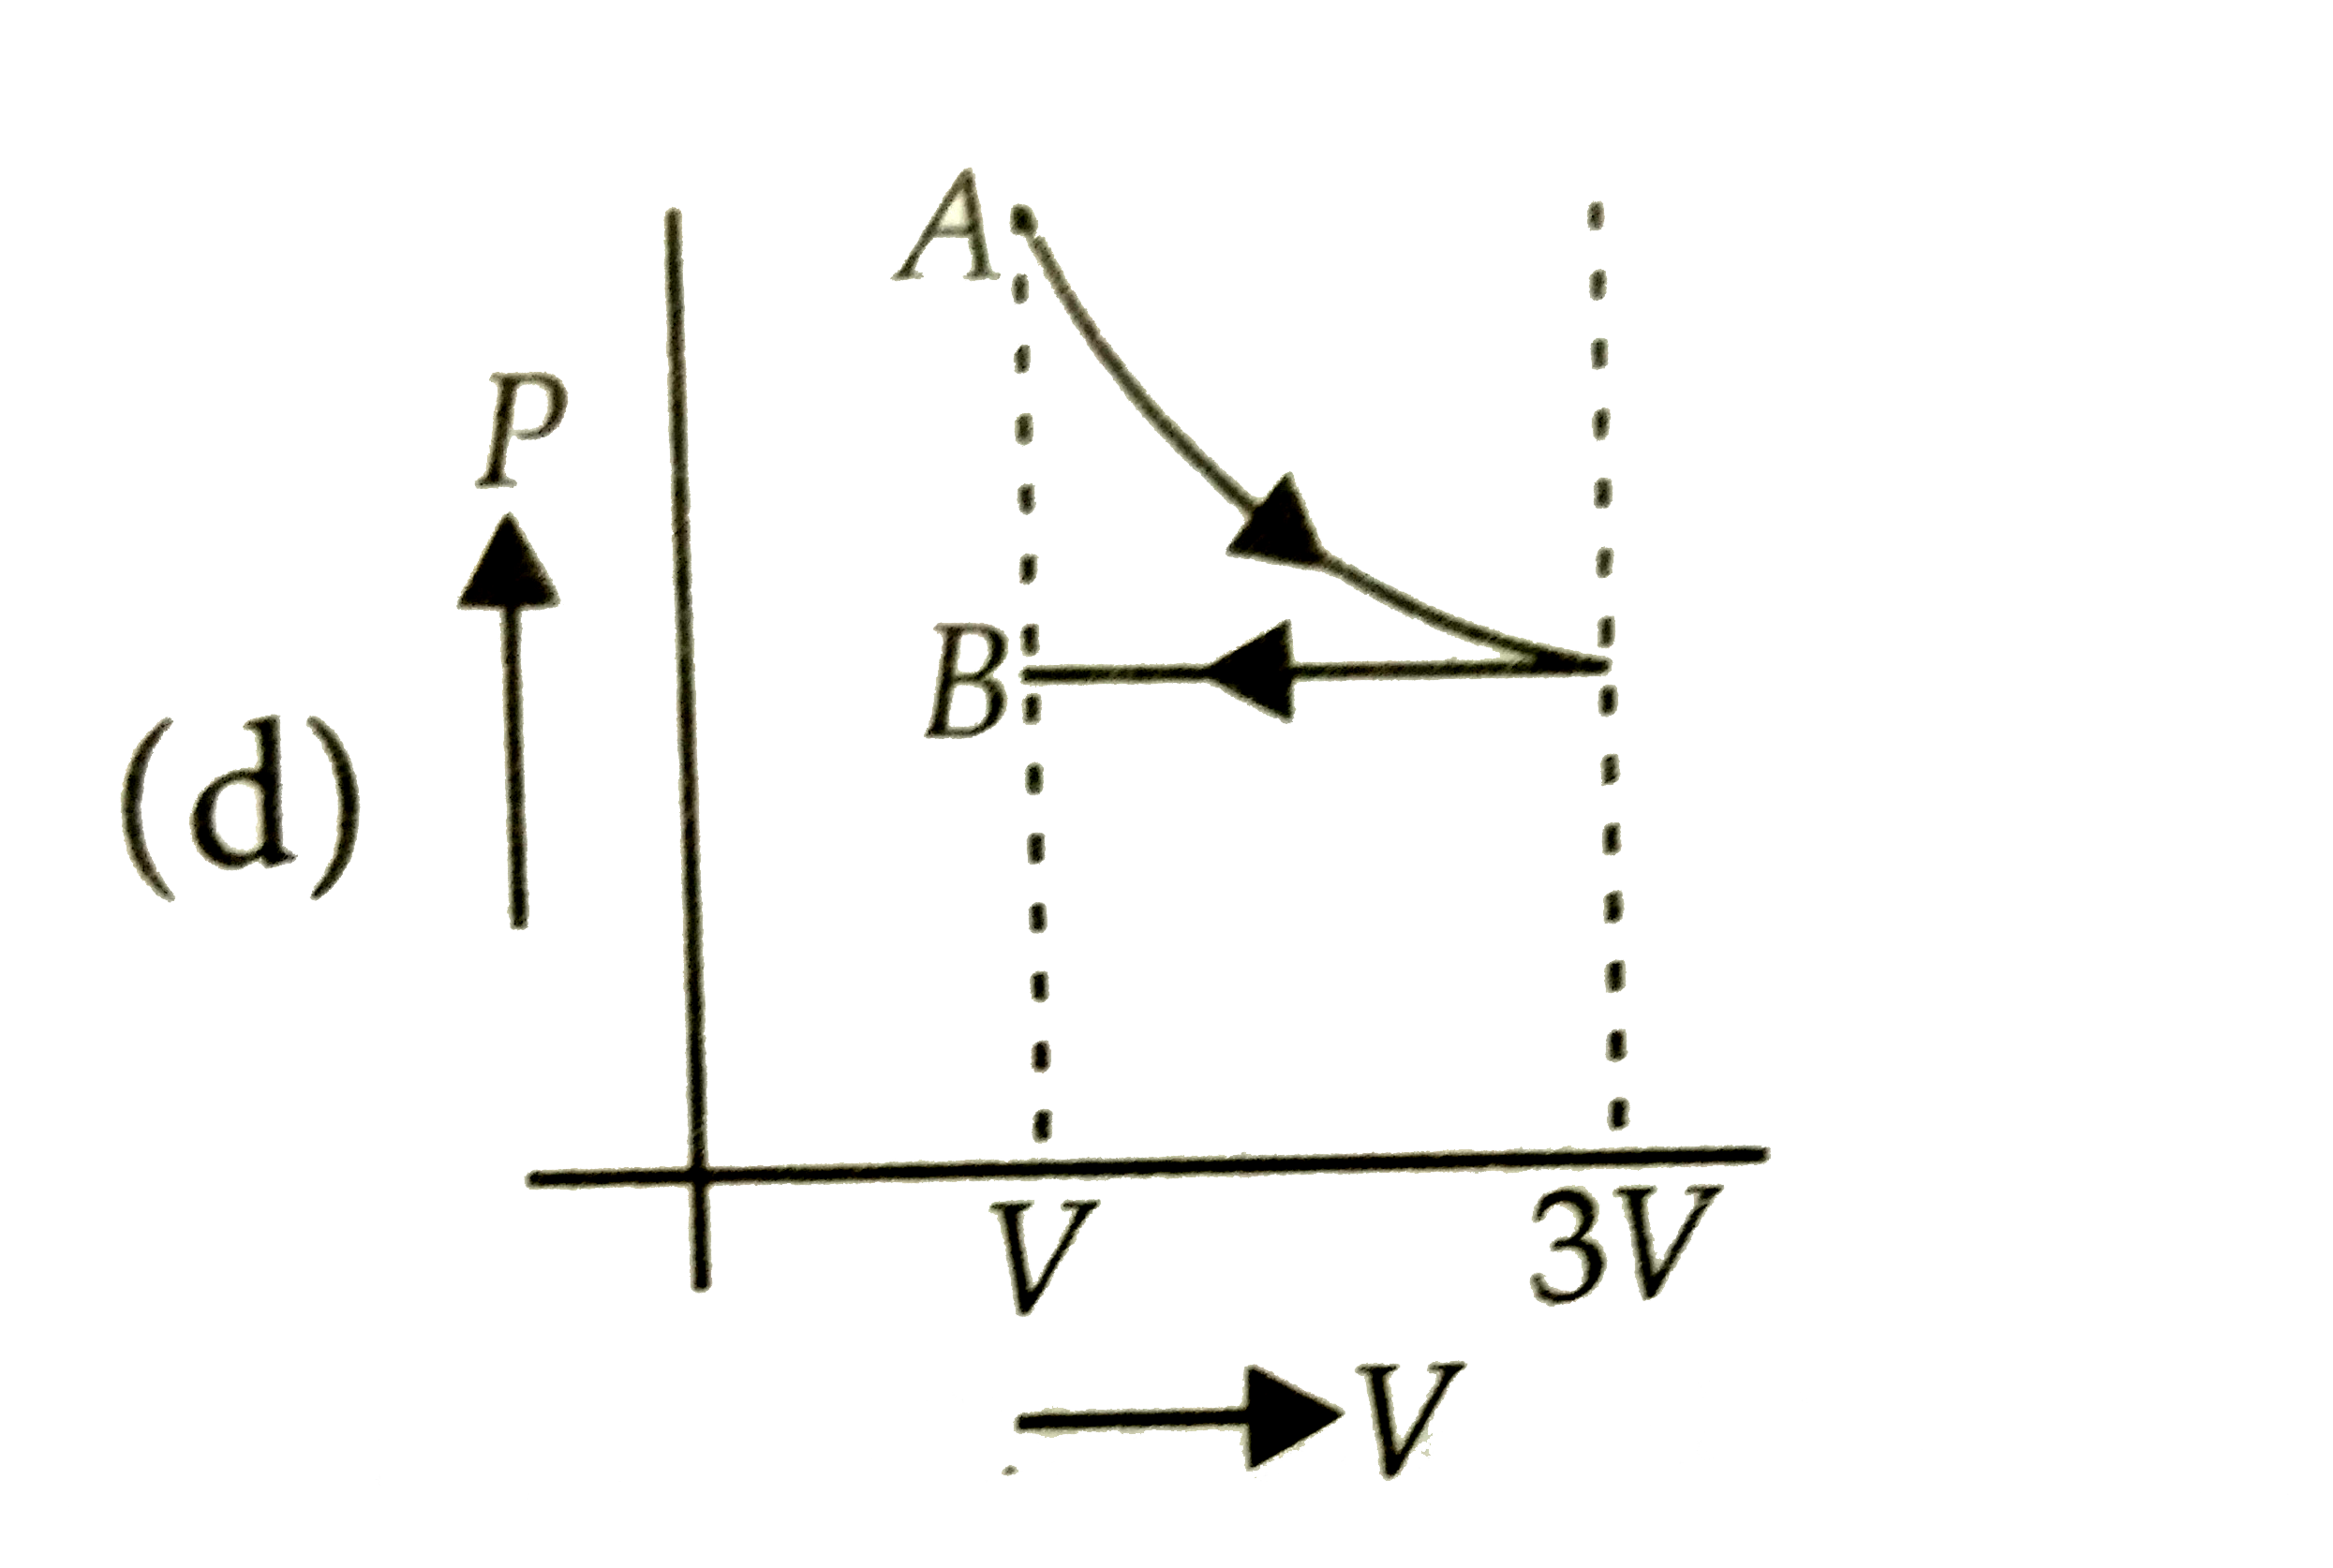
One mole of an ideal gas undergoes change of state from (4 L, 3 atm) to (6 L, 5 atm). If the change in internal energy is 45 L-atm then the change of enthalpy for the process is
View SolutionWhen a sample of ideal gas is changed from an initial state to a final state, various curves can be plotted for the process like P-V curve, V-T curve,P-T curve etc.
For example, P-V curve for a fixed amount of an ideal gas at constant temperature is a rectangular hyperbola, V-T curve for a fixed amount of an ideal gas at constant volume is again a straight line. However, the shapes may vary if the constant parameters are also changed.
Now, answer the following questions :
Which of the following graphs is not possible for a fixed amount of ideal gas upon moving from initial state A to final state B :
View SolutionWhen a sample of ideal gas is changed from an initial state to a final state, various curves can be plotted for the process like P-V curve, V-T curve,P-T curve etc.
For example, P-V curve for a fixed amount of an ideal gas at constant temperature is a rectangular hyperbola, V-T curve for a fixed amount of an ideal gas at constant volume is again a straight line. However, the shapes may vary if the constant parameters are also changed.
Now, answer the following questions :
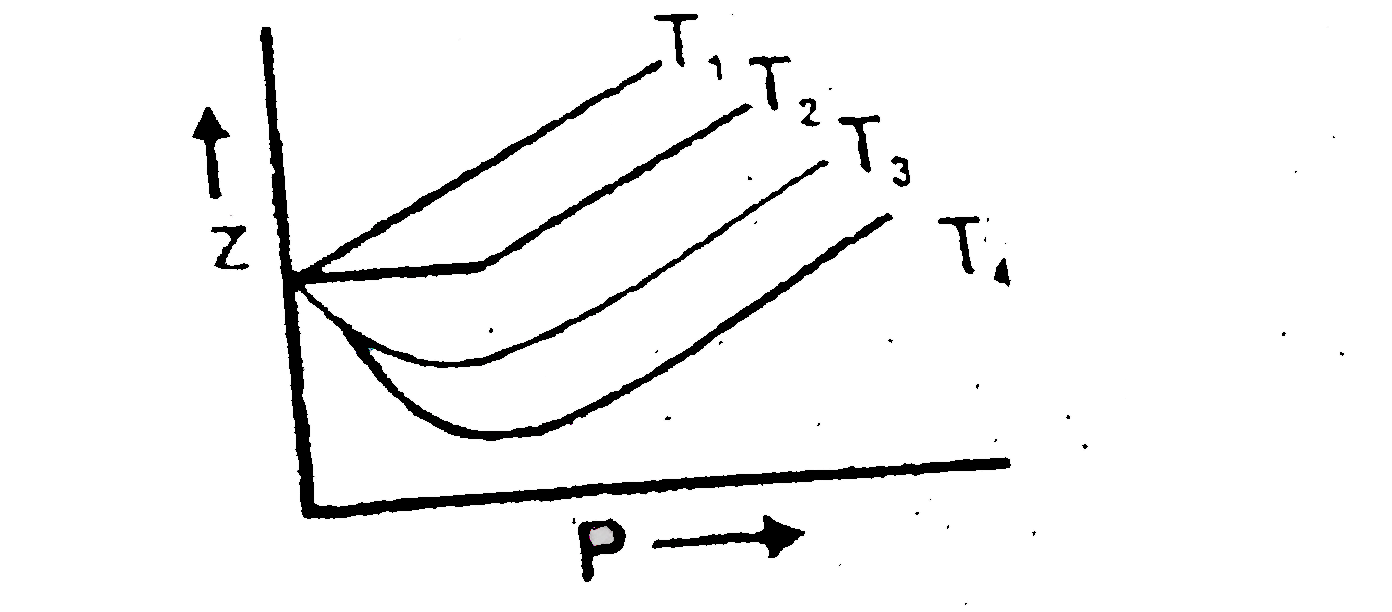
From the given plot between Z and P for a real gas the correct is :
View SolutionWhen a sample of ideal gas is changed from an initial state to a final state, various curves can be plotted for the process like P-V curve, V-T curve,P-T curve etc.
For example, P-V curve for a fixed amount of an ideal gas at constant temperature is a rectangular hyperbola, V-T curve for a fixed amount of an ideal gas at constant volume is again a straight line. However, the shapes may vary if the constant parameters are also changed.
Now, answer the following questions :
Two Vander waals gases have same value 'b' but different 'a' value then which of the following statement is correct under simialr condition .
View SolutionOne mole of a monatomic gas at pressure 2 atm ,273 K taken to final pressure 4 atm by a reversible path described by P/V = constant .Given Cv 12.5k mol-1 K-1 Calculate the magnitude of ΔEw for the process .
View SolutionOne mole of an ideal gas undergoes a change of state (2.0) atm, 3.0 L) to (2.0 atm, 7.0 L) with a change in internal energy (ΔU)=30 L-atm. The change in enthalpy (ΔH) of the process in L-atm :
View SolutionOne mole of non− ideal gas undergoes a change of state (1.0atm,3.0L,200K) to (4.0atm,5.0L,250K) with a change in internal energy (ΔU)=40L−atm. The change in enthalpy of the process in L−atm,
View Solution

