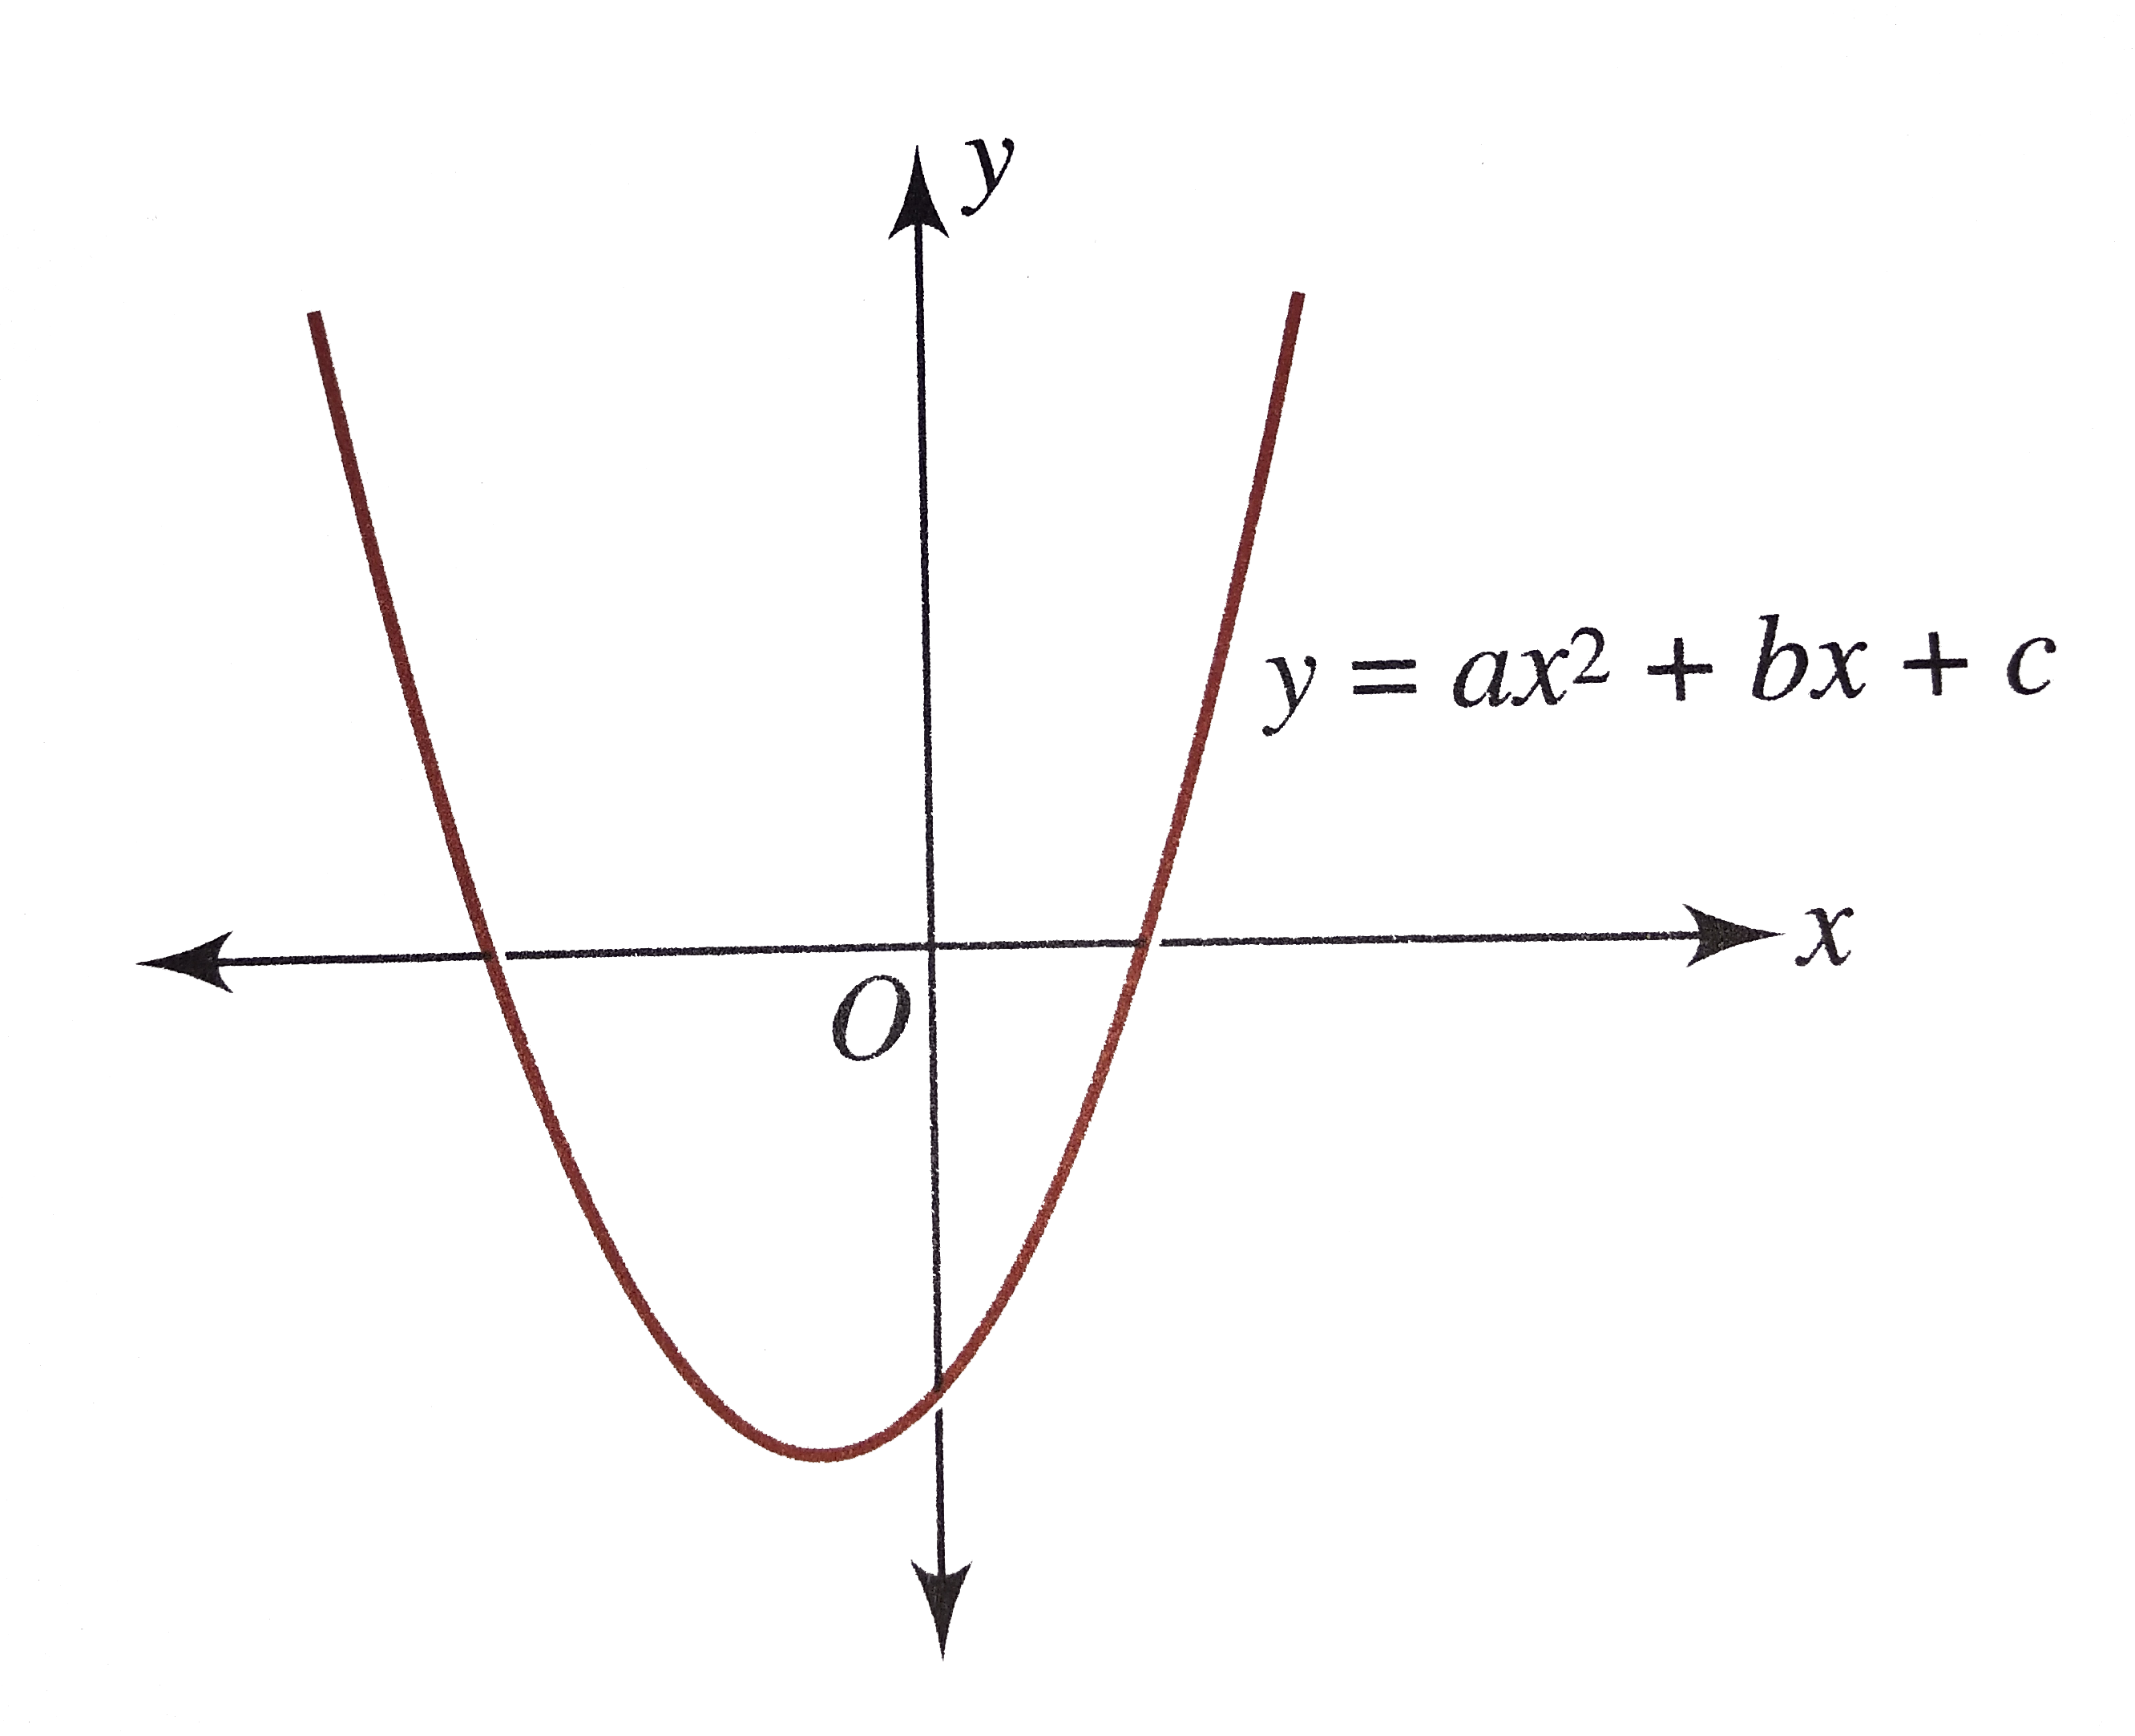
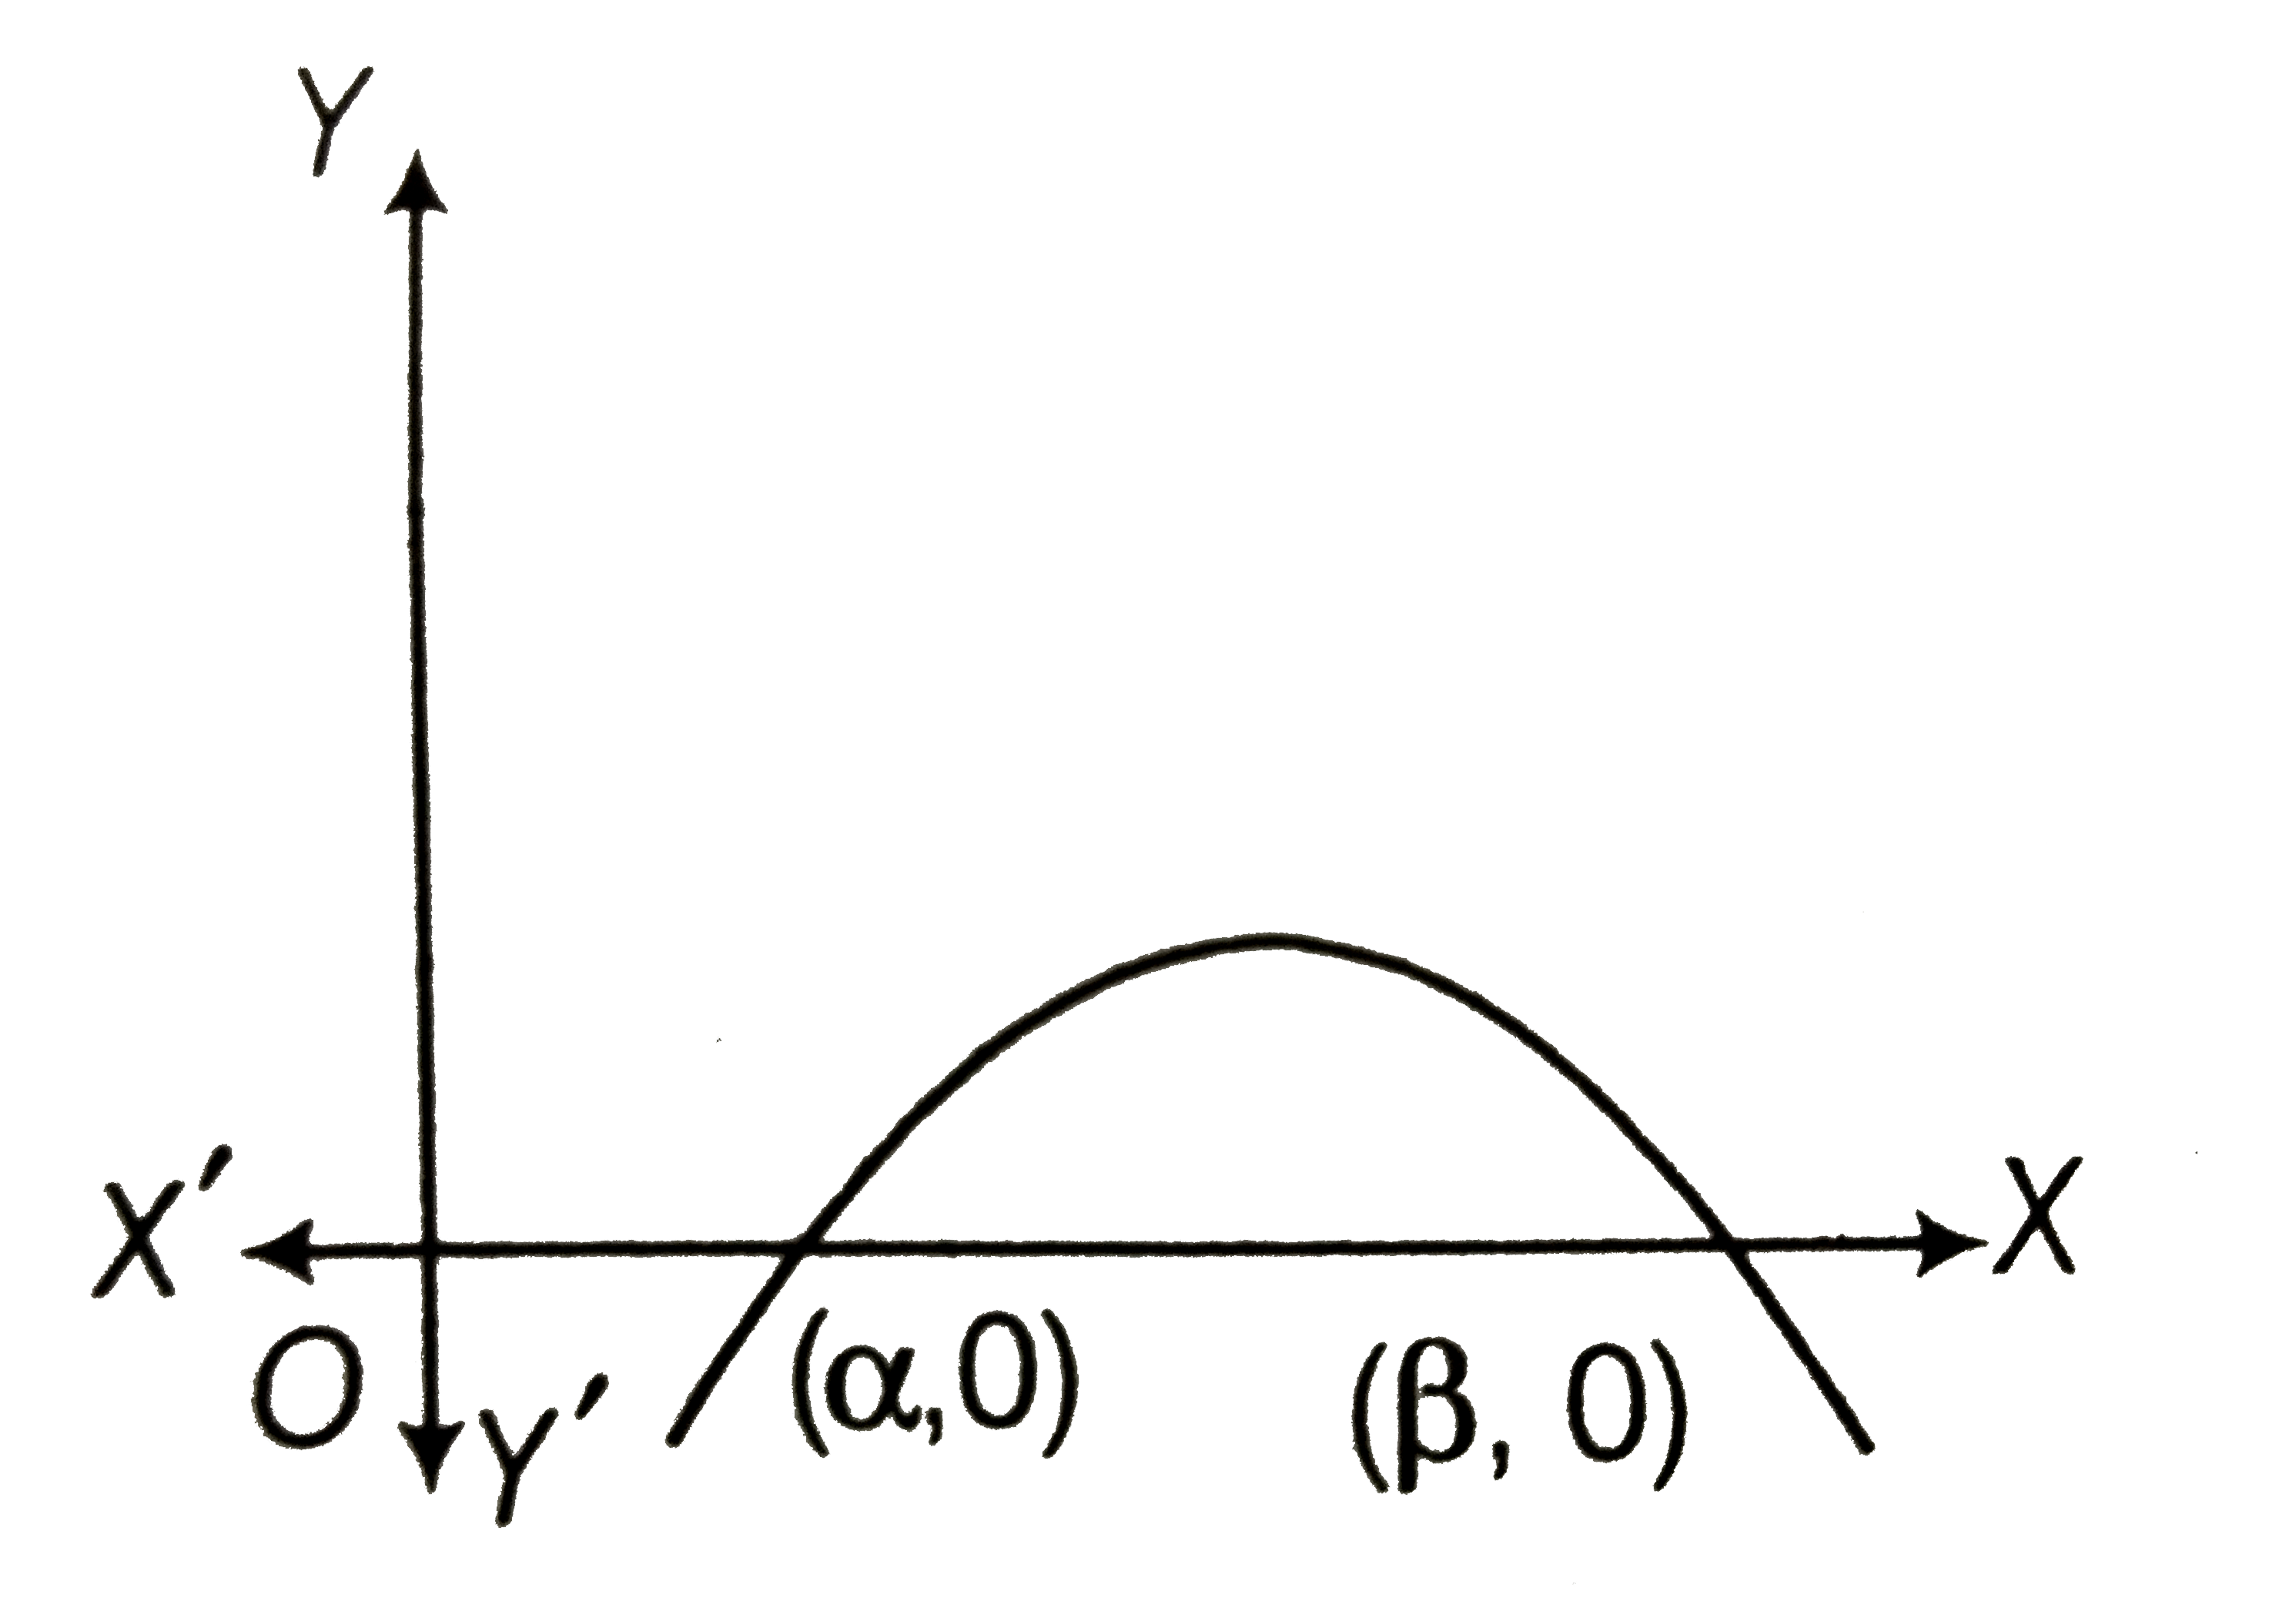
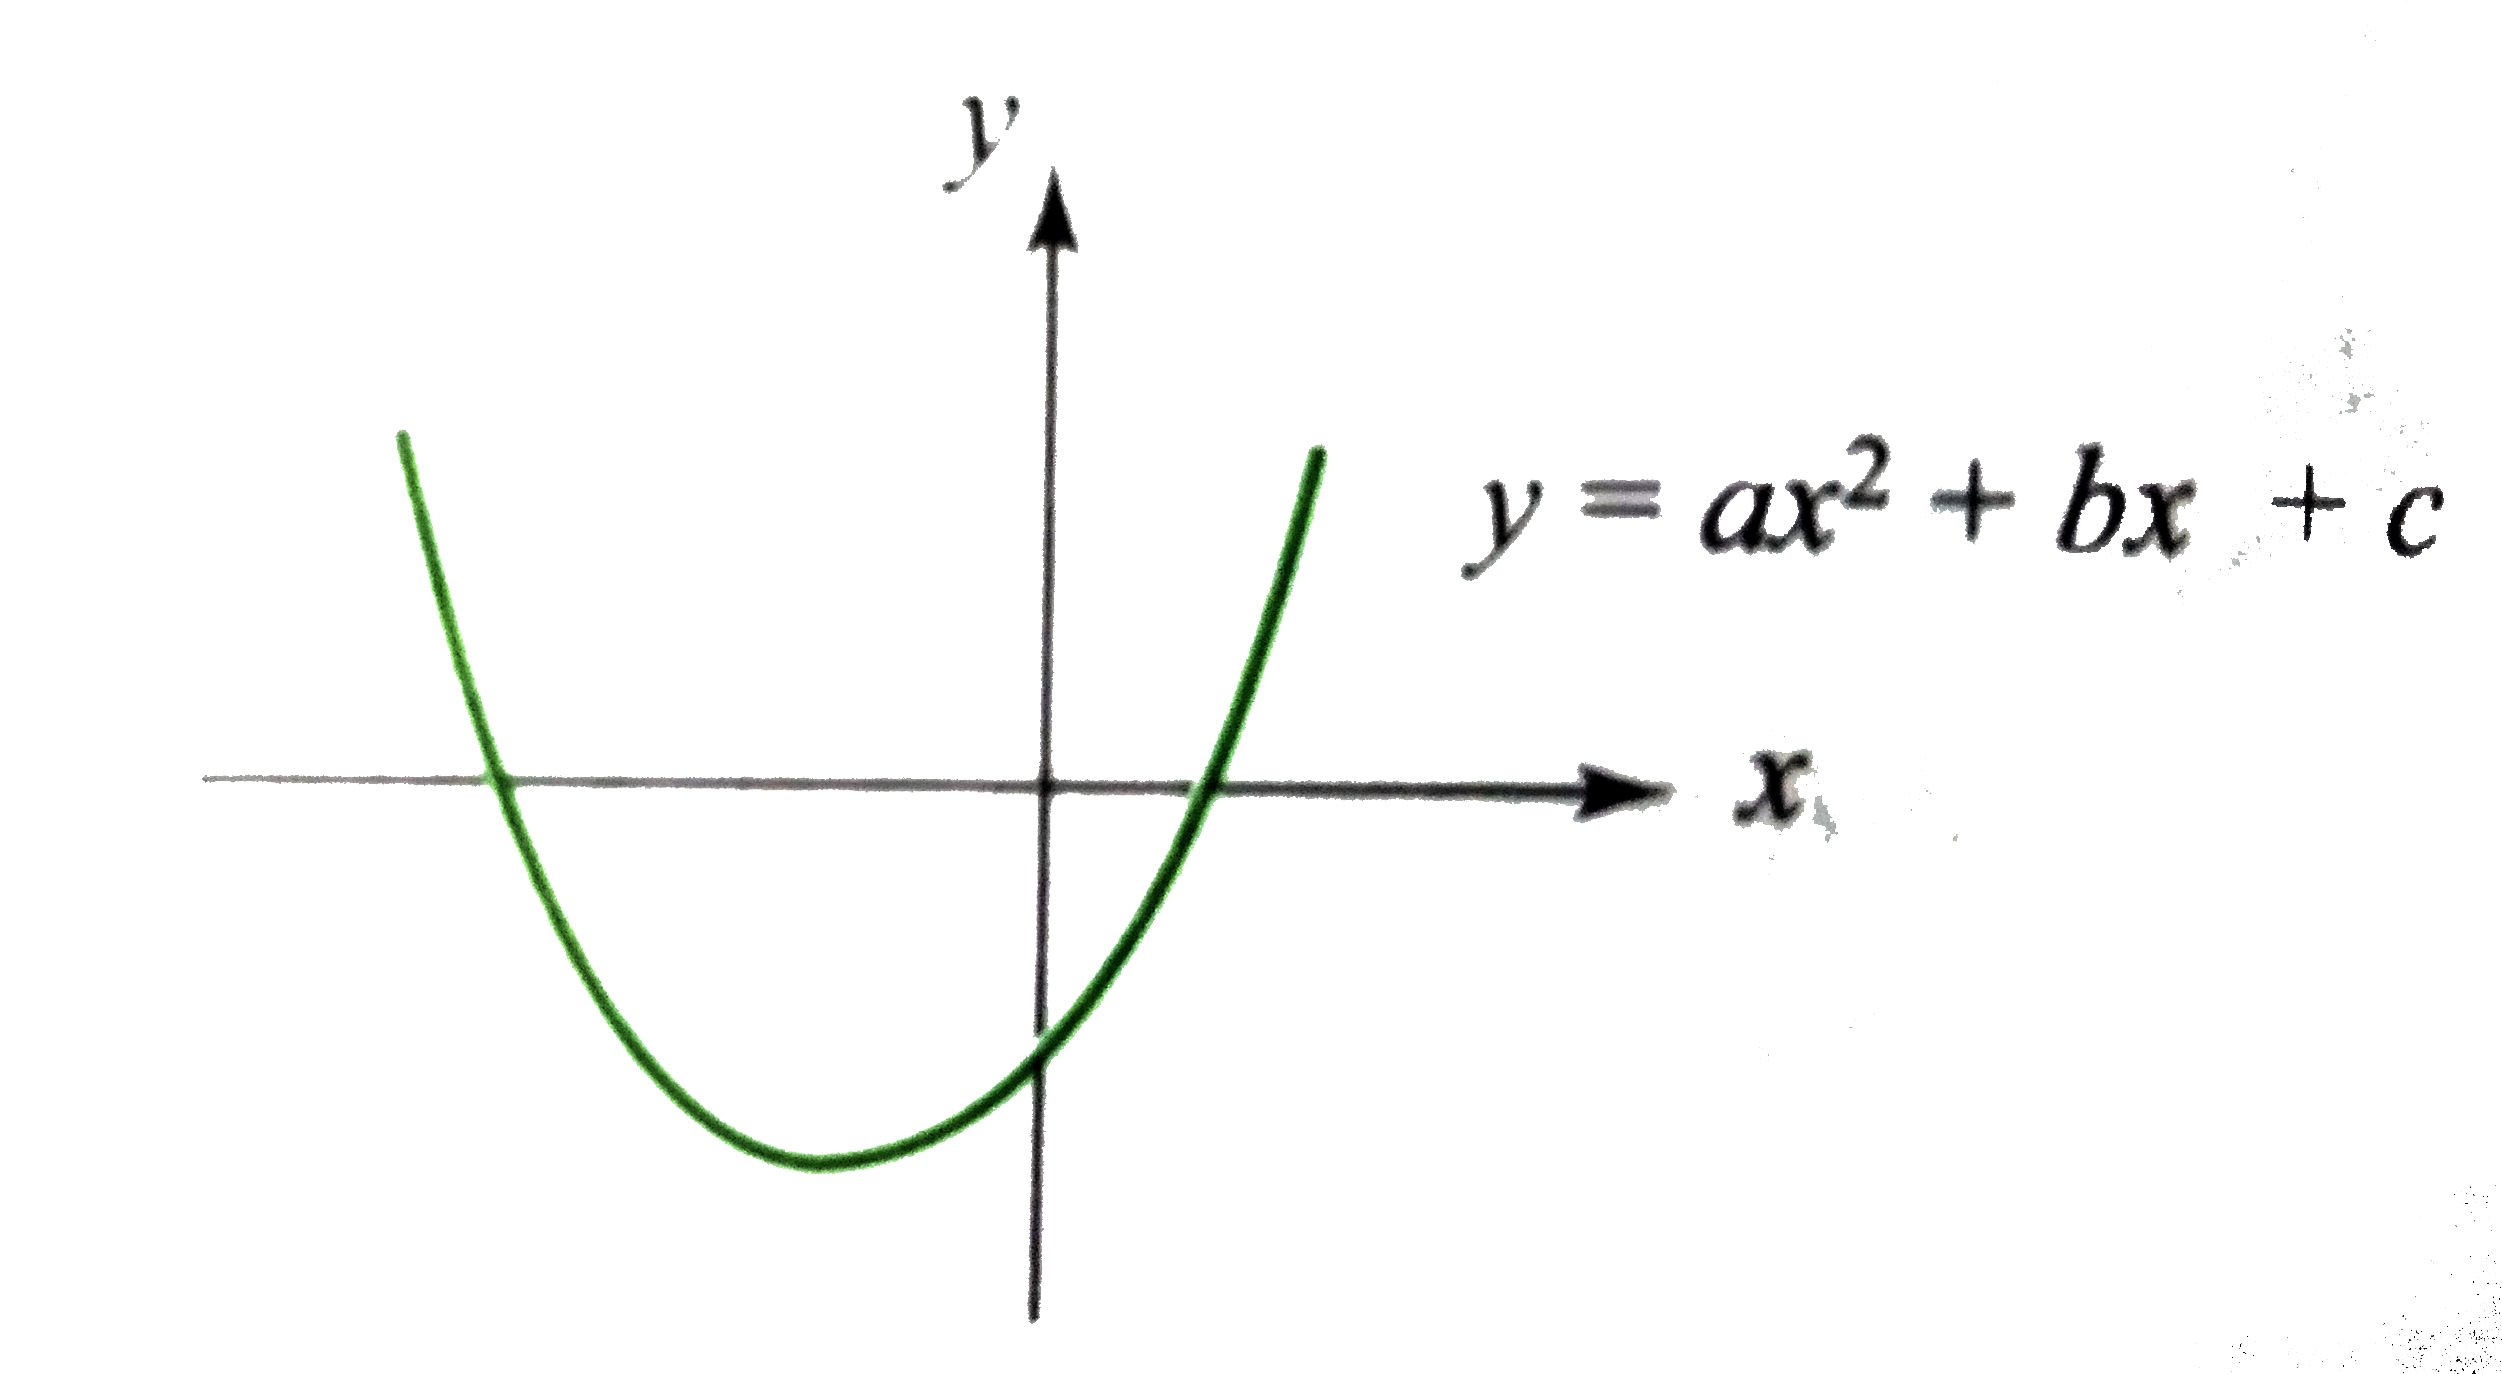
The following figure shows the graph of f(x)=ax2+bx+c, find the signs of a,bandc.
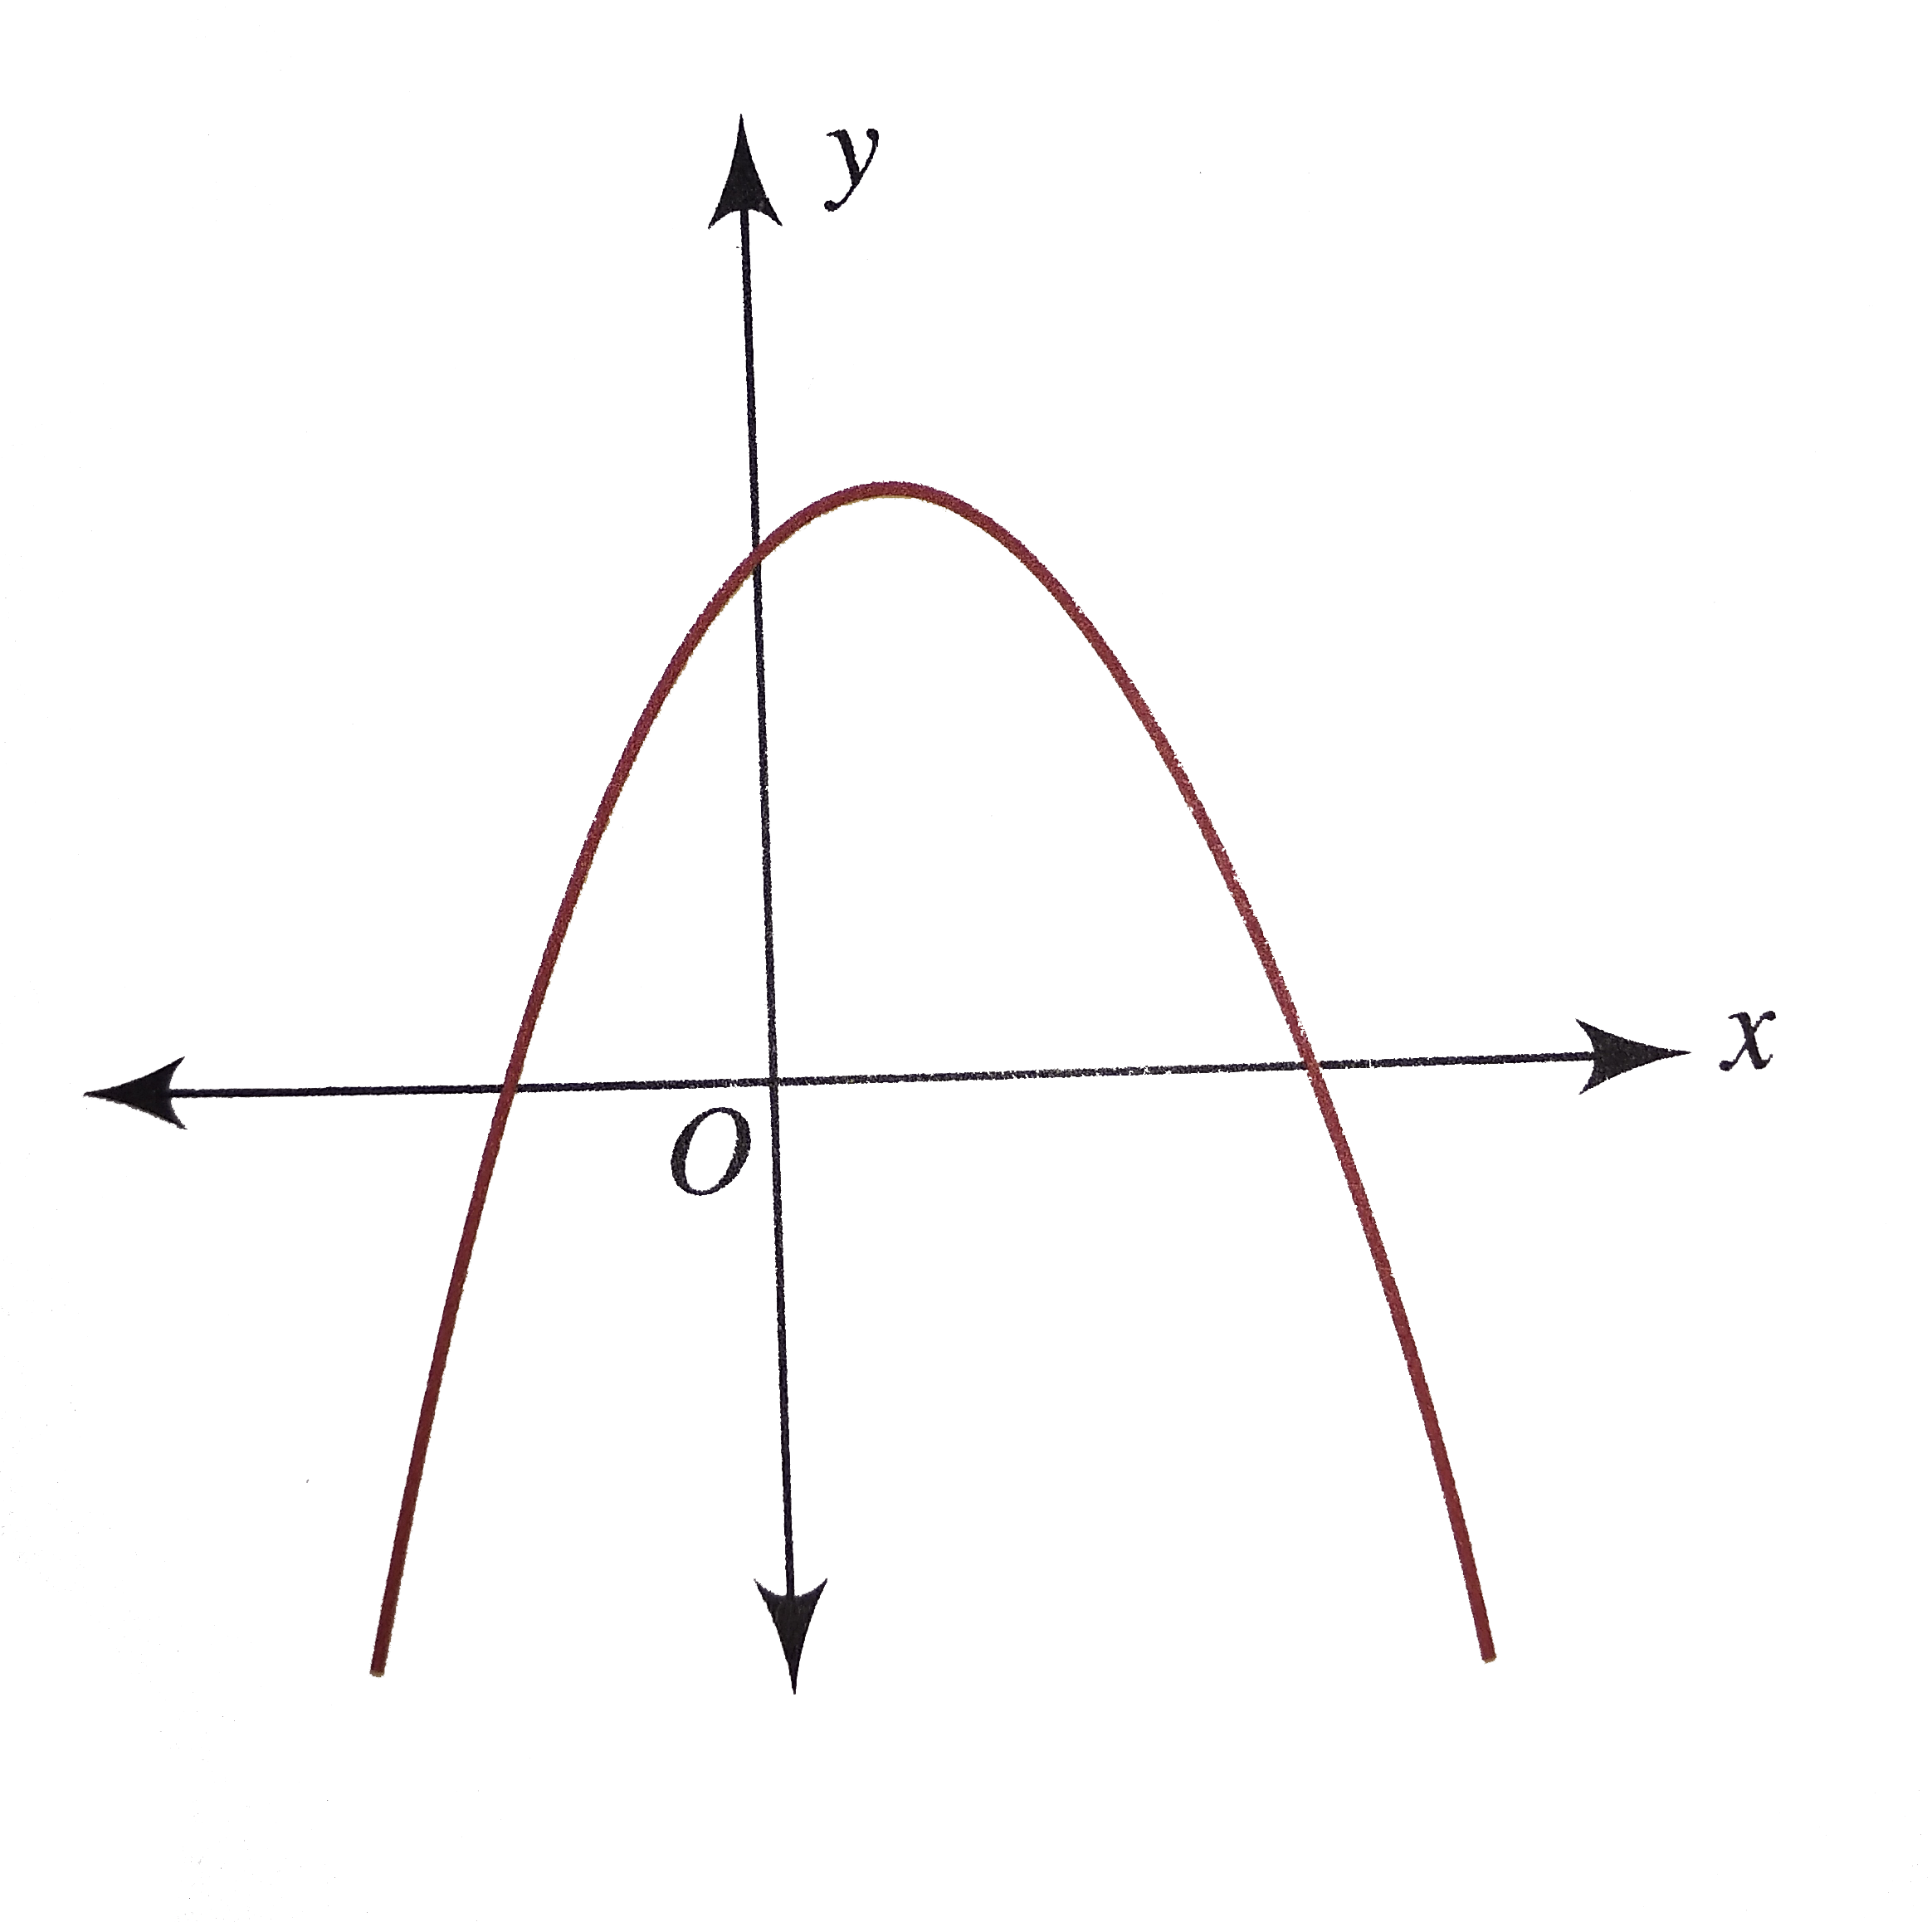
Fromt the graph, f(0)=c>0 (as the graph intersects the y-axis on the positive side)
Also the graph is concave downwards, so a<0.
Further, the vertex lies on the right-hand side of y-axis, so the abscissa of the vertex is −b2a>0⇒b> (as a<0).
Topper's Solved these Questions
- GRAPHS OF ELEMENTARY FUNCTIONS Book:CENGAGE ENGLISHChapter:GRAPHS OF ELEMENTARY FUNCTIONS Exercise:EXERCISES
Explore 34 Videos
- GRAPHS OF POLYNOMIAL AND RATIONAL FUNCTIONSBook:CENGAGE ENGLISHChapter:GRAPHS OF POLYNOMIAL AND RATIONAL FUNCTIONSExercise:Exercises
Explore 17 Videos
- GRAPHS OF TRIGONOMETRIC FUNCTIONSBook:CENGAGE ENGLISHChapter:GRAPHS OF TRIGONOMETRIC FUNCTIONSExercise:Exercises
Explore 22 Videos
Similar Questions
Knowledge Check
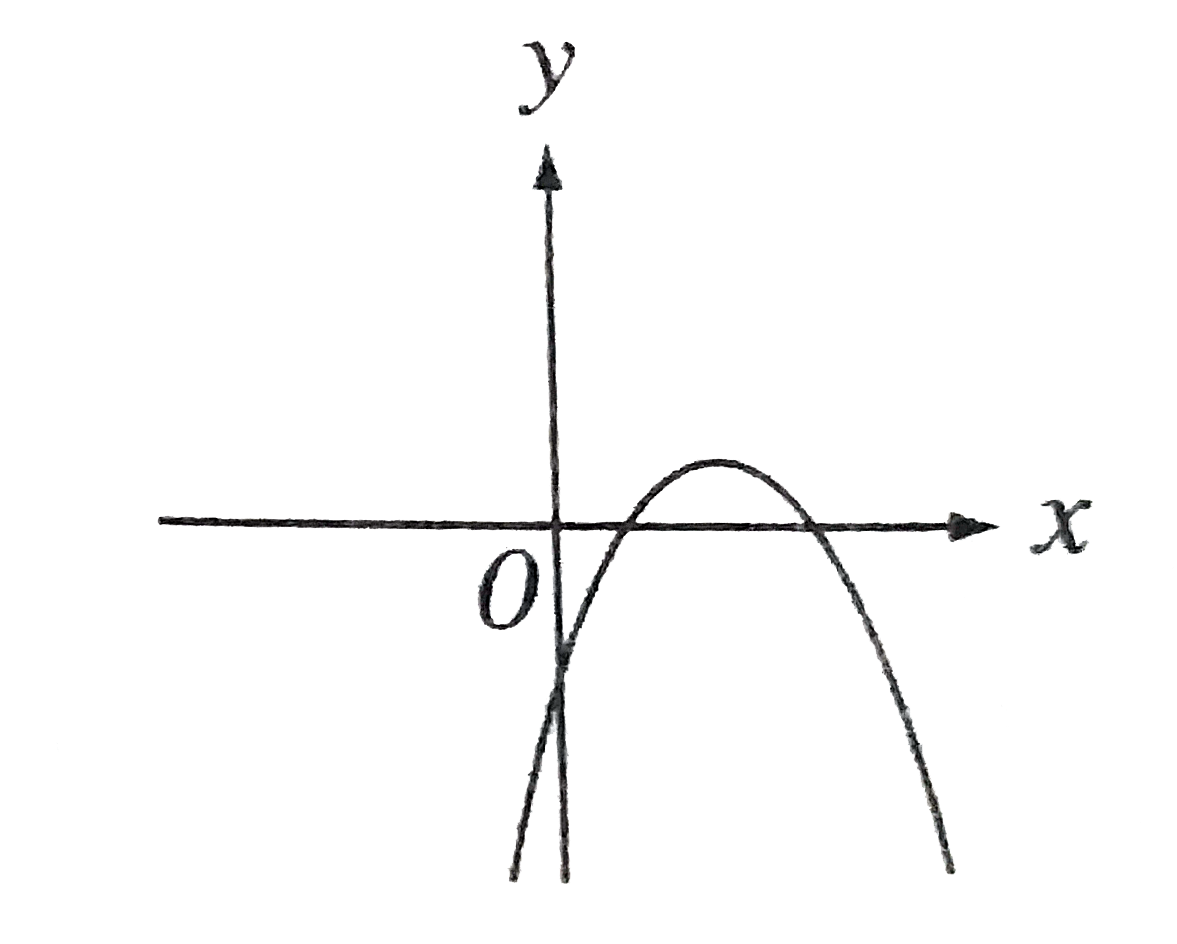
The graph of y=g(x) is shown in the figure above. If g(x)=ax2+bx+c for constants a,b and c and if abc≠0, then which of the following must be true?Aac>1Bc>1Cac>0Da>0
Figure 2.23 show the graph of the polynomial f(x) = ax² + bx + c for which (a) a < 0, b > 0 and c > 0 (b) a < 0, b < 0 and c > 0 (c) a < 0, b < 0 and c < 0 (d) a > 0, b > 0 and c < 0
View Solutionwhich of the following graph represents the expression f(x)=ax2+bx+c (a≠0) when a>0,b<0 $ c<0 ?
View SolutionIf sinαandcosα are the roots of ax2+bx+c=0 , then find the relation satisfied by a, b and c .
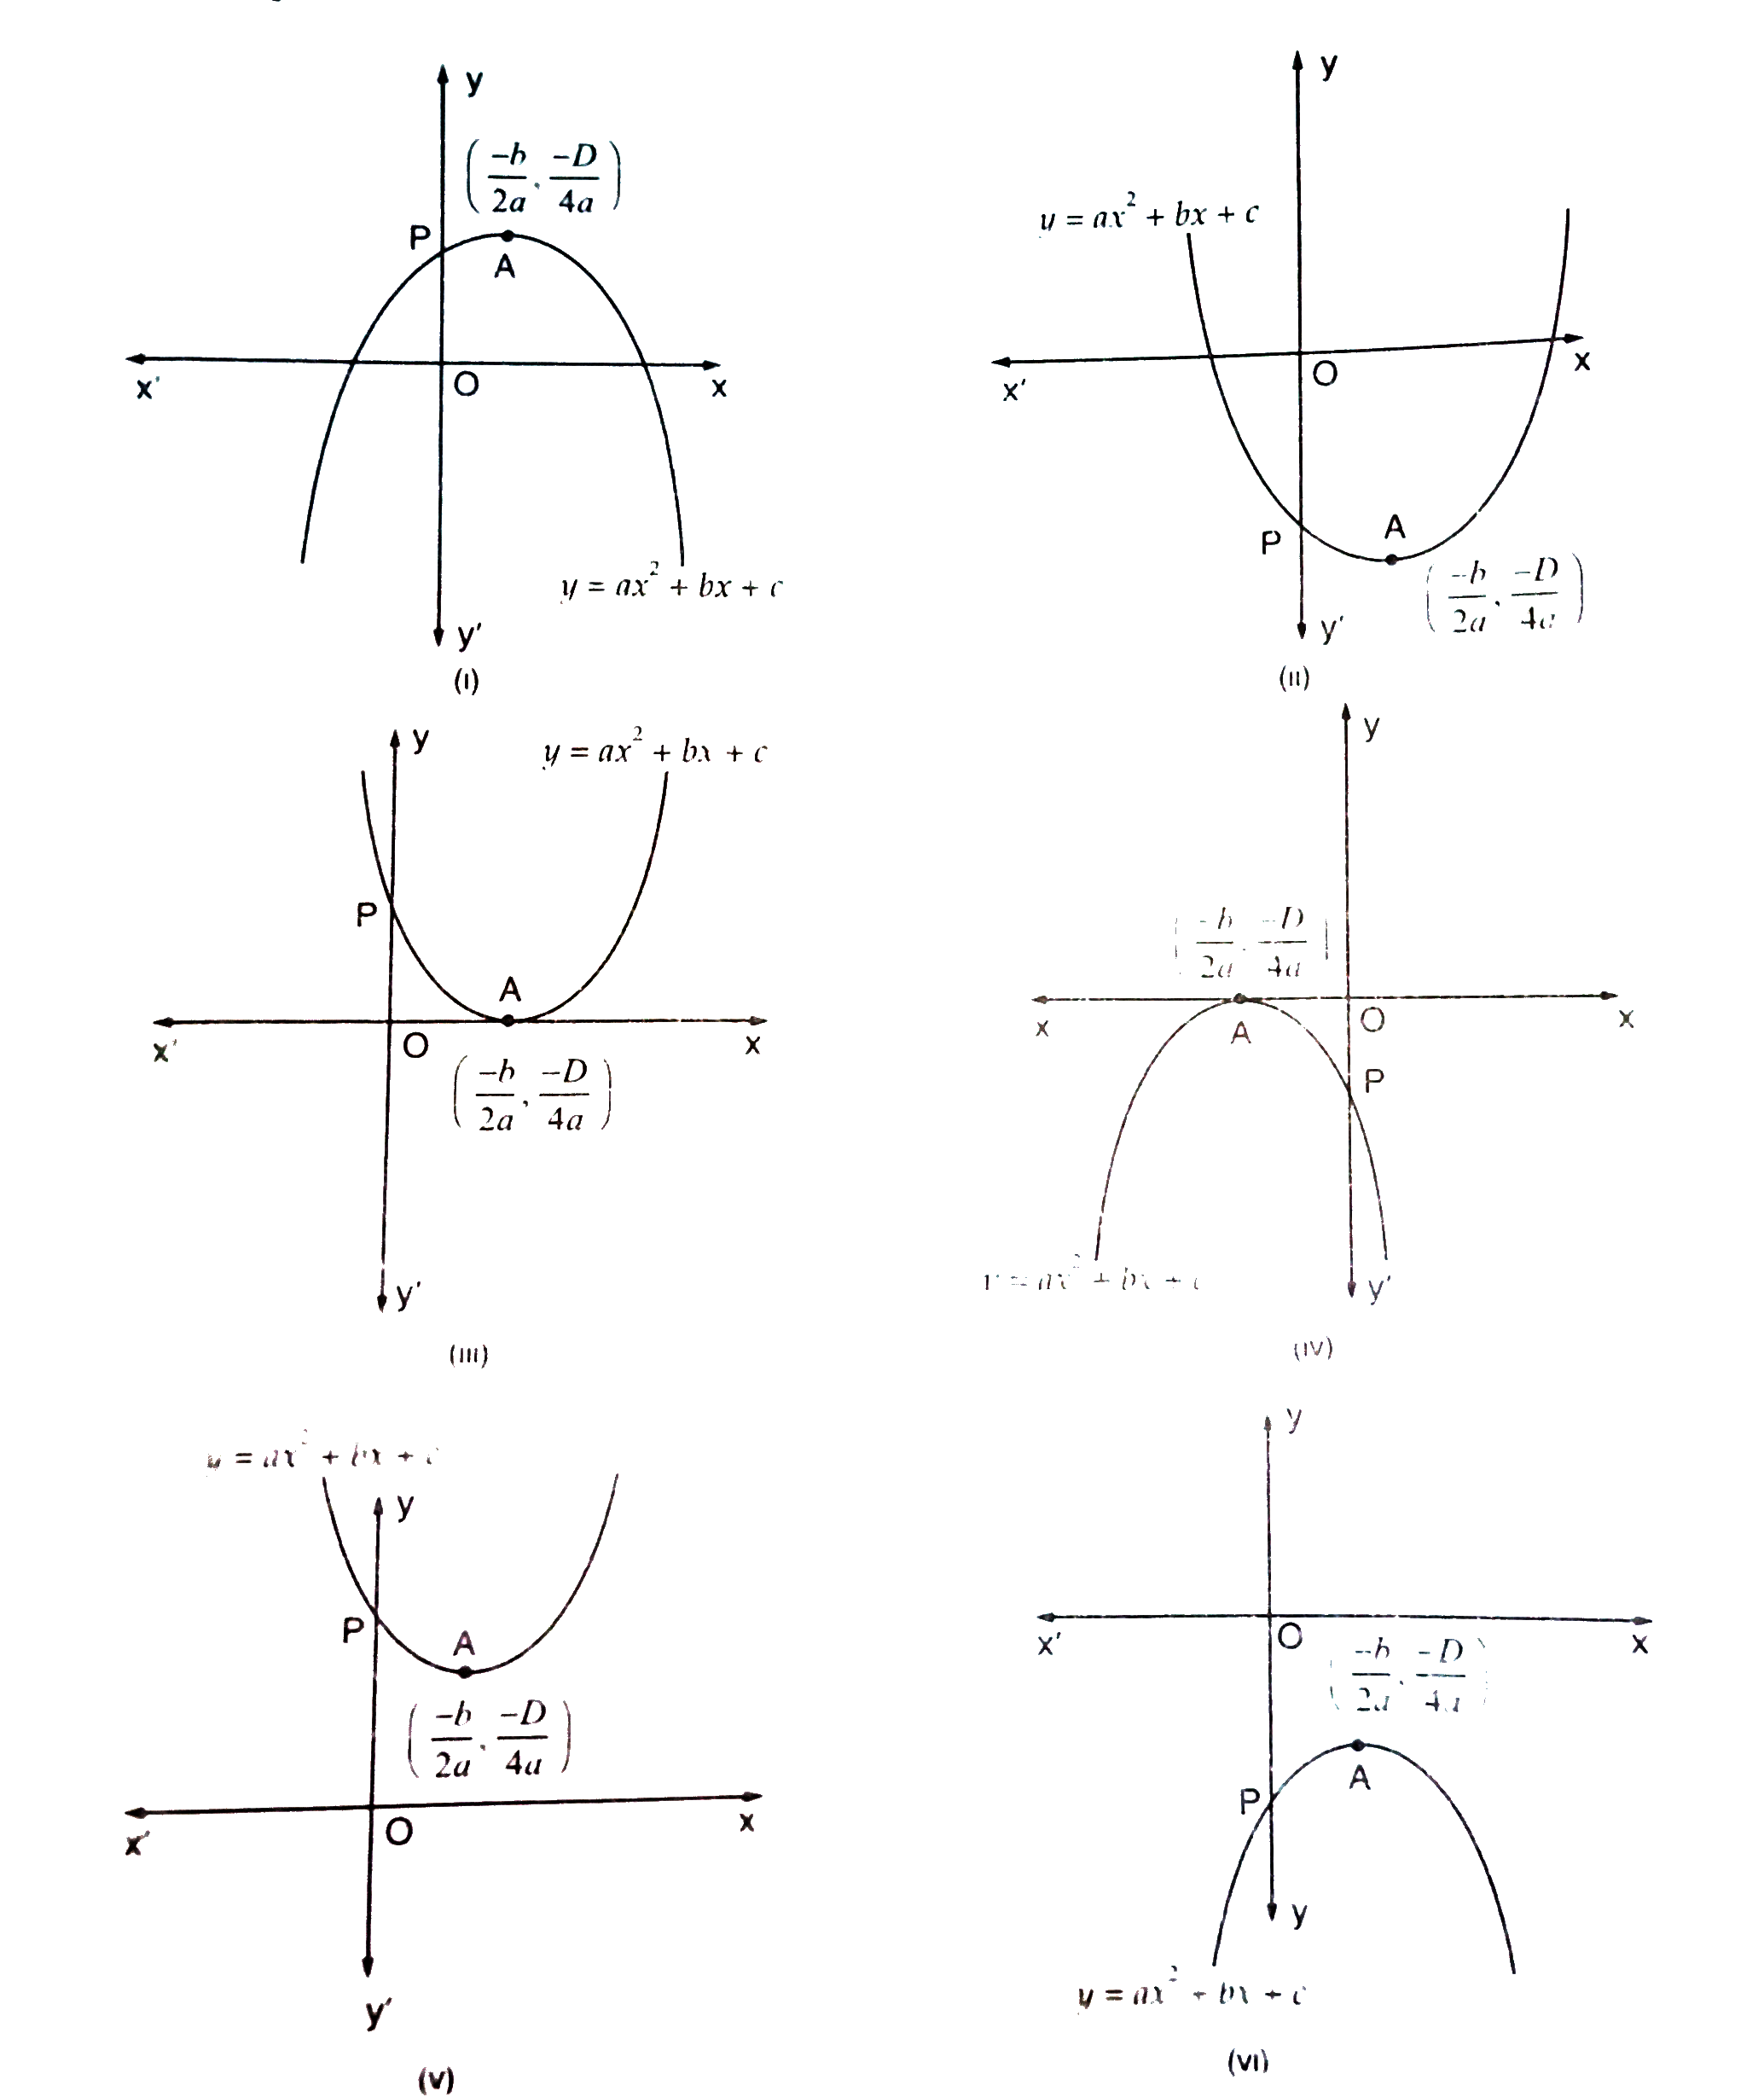
View SolutionThe graphs of y=ax2+bx+c are given in Fig. Identify the signs of a, b and c in each of the following: (FIGURE)
View SolutionIf the graph of y=ax2+bx+c lies completely above the x-axis, then
View SolutionFor which of the following graphs the quadratic expression y=ax2+bx+c the product abc is negative ?
View SolutionLet f(X)=ax2+bx+c. Consider the following diagram
 .
.
View Solution


