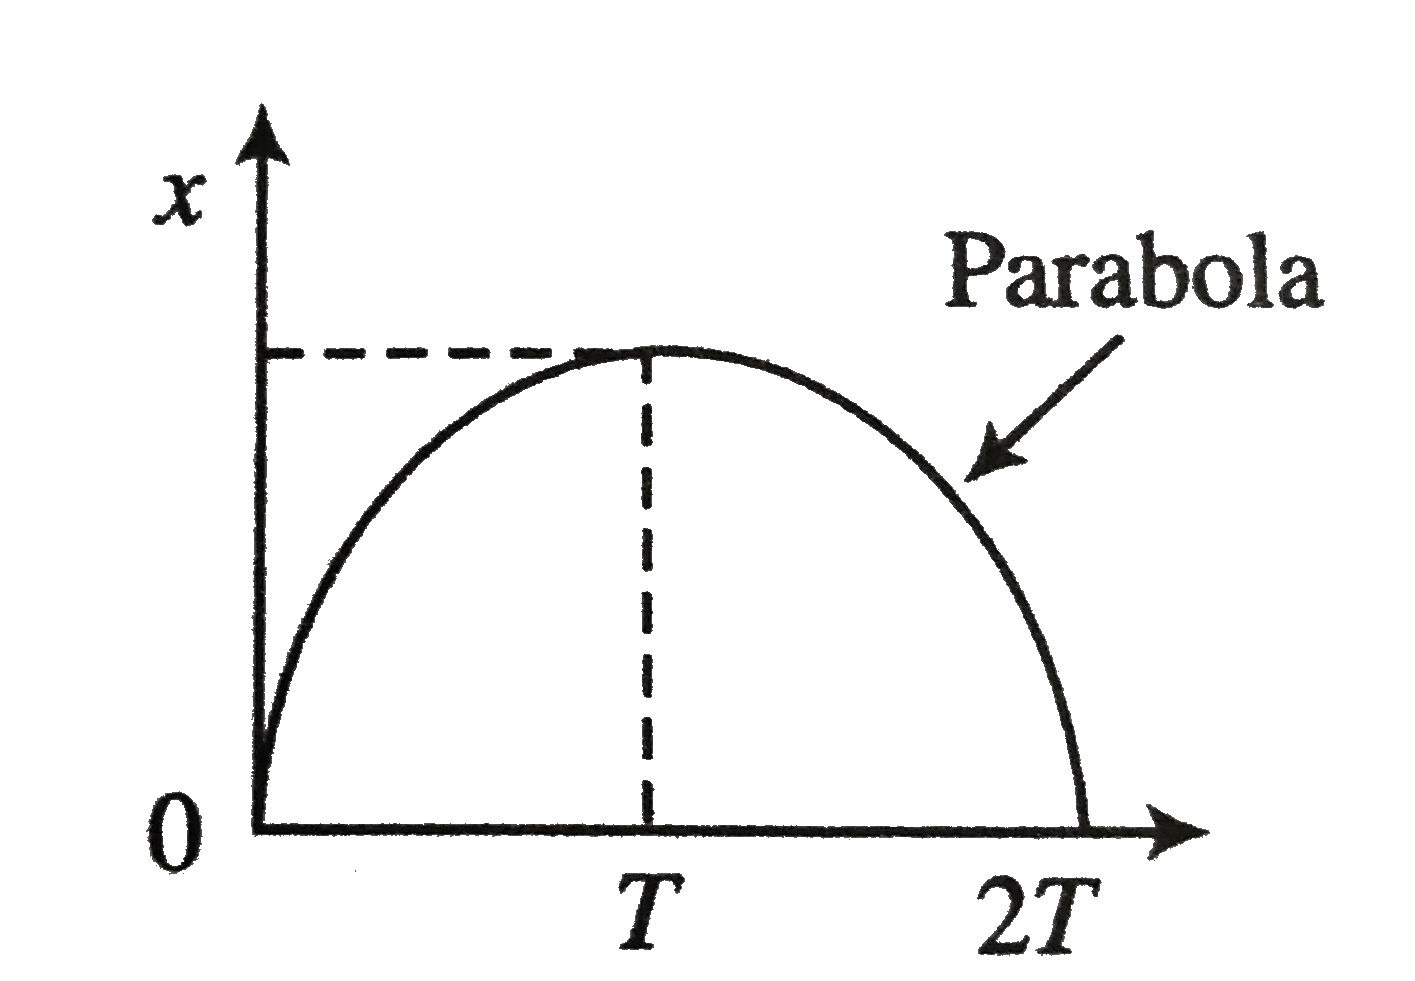
The x-t graph shown in figure represents
 Solution in Telugu
constant velocity
velocity of the body is continuously changing
instantaneous velocity
the body travels with constant speed up to time t1 and then stops
The correct Answer is:D
Step by step video, text & image solution for The x-t graph shown in figure represents by Physics experts to help you in doubts & scoring excellent marks in Class 12 exams.
Updated on:21/07/2023Topper's Solved these Questions
- MOTION IN A STRAIGHT LINE BOOK - AAKASH SERIESCHAPTER - MOTION IN A STRAIGHT LINE EXERCISE - EXERCISE -II
80 Videos
- MOTION IN A STRAIGHT LINE BOOK - AAKASH SERIESCHAPTER - MOTION IN A STRAIGHT LINE EXERCISE - PRACTICE EXERCISE
58 Videos
- MOTION IN A STRAIGHT LINE BOOK - AAKASH SERIESCHAPTER - MOTION IN A STRAIGHT LINE EXERCISE - very Short answer type question
15 Videos
- MOTION IN A PLANEBOOK - AAKASH SERIESCHAPTER - MOTION IN A PLANEEXERCISE - QUESTION FOR DESCRIPTIVE ANSWER
7 Videos
- MOVING CHARGES AND MAGNETISMBOOK - AAKASH SERIESCHAPTER - MOVING CHARGES AND MAGNETISMEXERCISE - EXERCISE-III
45 Videos
Similar Questions
A person travels along a straight road for half the distance with velocity V1 and the remaining half distance with velocity V2 the average velocity is given by
View SolutionIf a cyclist takes two minutes to compete half revolution on a circular path of 120 m radius. What is the average speed?
View SolutionGive two examples of the motion of big objects where the object can be treated as a particle and where it cannot be?
View SolutionA particle is projected over a triangle from one end of a horizontal base and garzing the vertex falls on the other end of the base . If α and β the base angles and θ the angle of projection then show that tanθ=tanα+tanβ.
View SolutionA proton, a deuteron and an a particle having same momentum enter a uniform magnetic field at right angles to the field. Then the ratio of their angular momenta during their motion in the magnetic field is
View SolutionThe x-t graph of a particle moving along a straight line is shown in figure

The v-t graph of the particle is correctly shown by
View SolutionThe x-t graph of a particle moving along a straight line is shown in figure The a-t graph of the particle is correctly shown by
View SolutionThe x-t graph of a particle moving along a straight line is shown in figure

The speed-time graph of the particle is correctly shown by
View SolutionThe x-t graph of particle moving along a straight line is shown in figure The v-t graph of the particles is correctly shown by
View SolutionThe x-t graph of particle moving along a straight line is shown in figure The a-t graph of the particle is correctly shown by
View Solution
Figure shows the displacement tiime (x-t) graph of a body moving in a straight line which one of the graph shown in figure represents the velocity- time (v-t) graph of the motion of the body.
View SolutionIn the rho -T graph shown in figure, match the following.
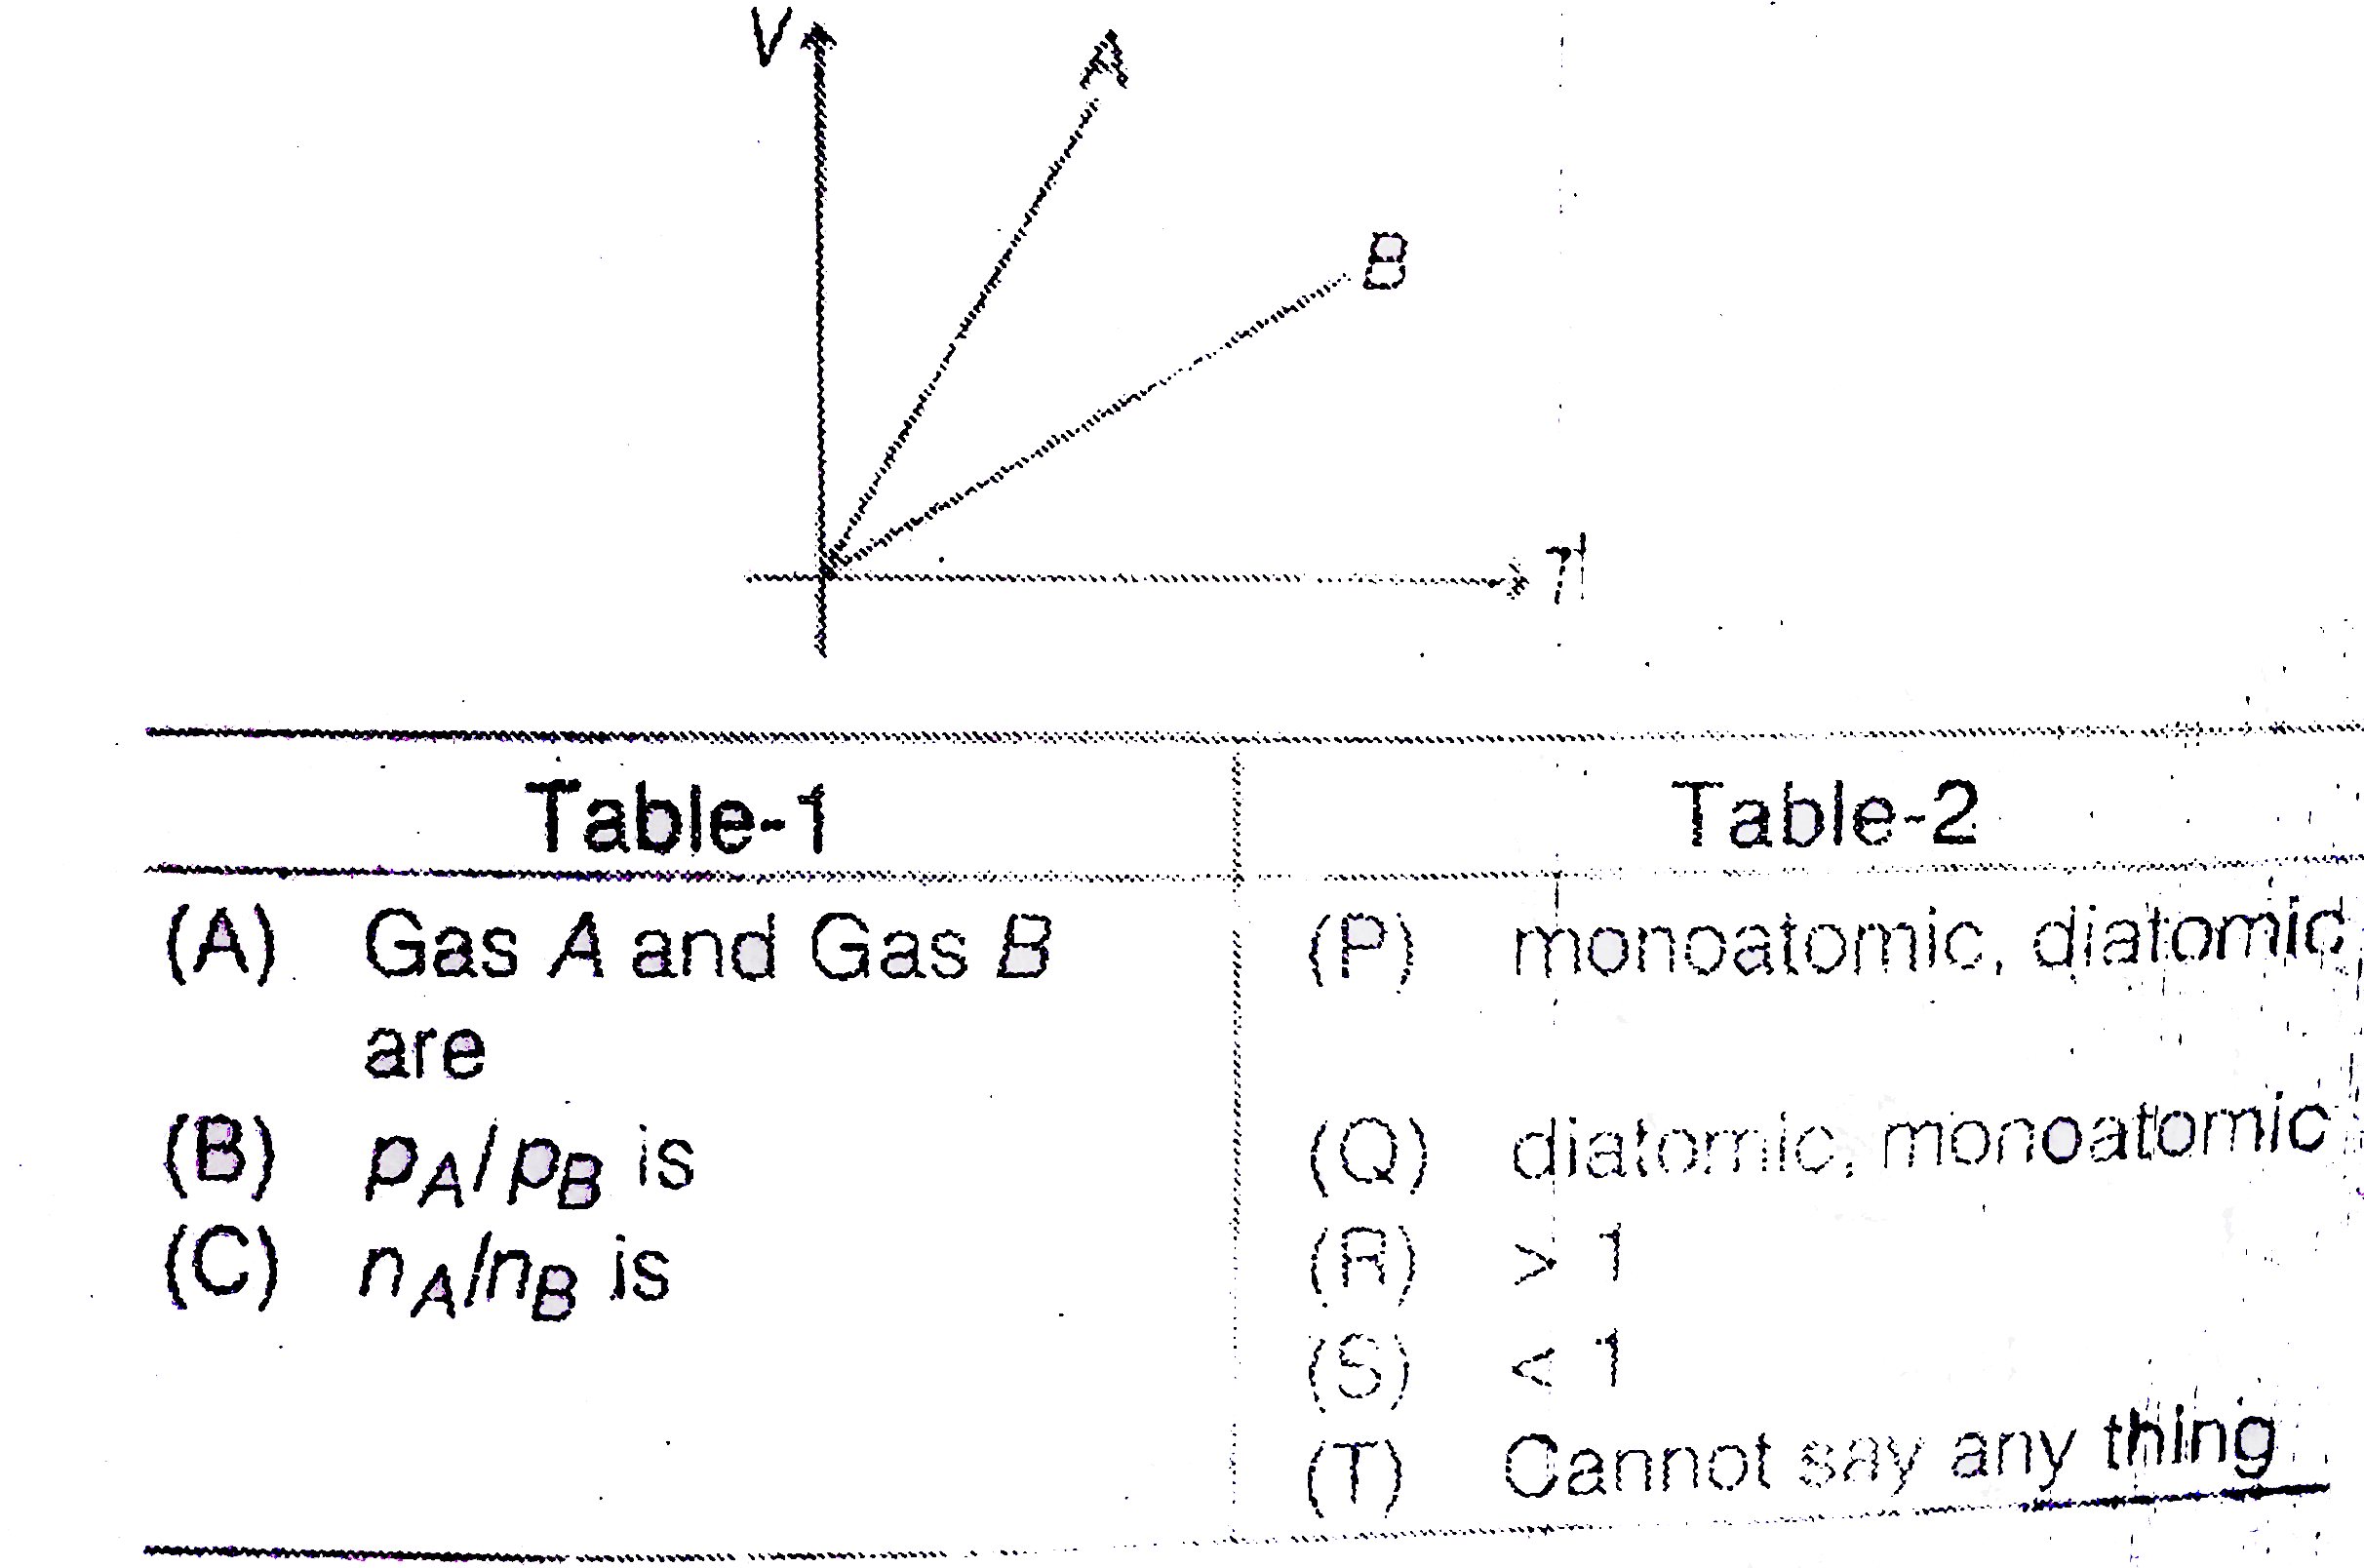
View SolutionIn the V-T graph shown in figure match the following.

View SolutionThe graph in figure shows the velocity v versus time t for a body. Which of the graphs shown in figure represents the correesponding acceleration versus time graphs ?
View SolutionThe velocity (v) - time (t) graph for a particle moving along x - axis is shown in the figure. The corresponding position (x) - time (t) is best represented by
View SolutionThe displacement x of a particle with a function of time t is shown in the figure. The graph shows that
View Solution
