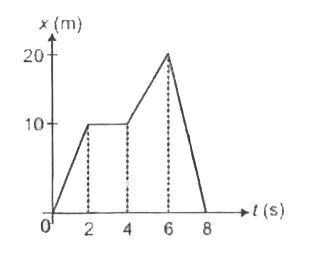
The x−t graph of particle moving along a straight line is shown in figure
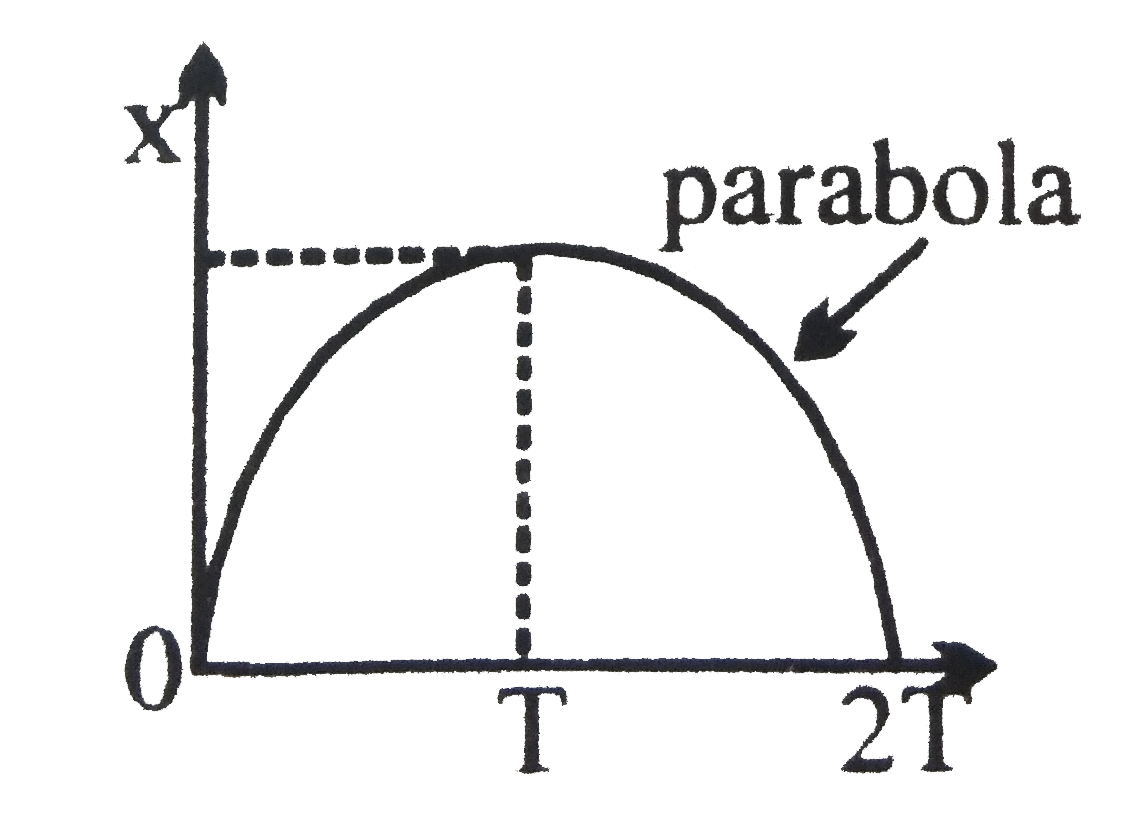
The v−t graph of the particles is correctly shown by
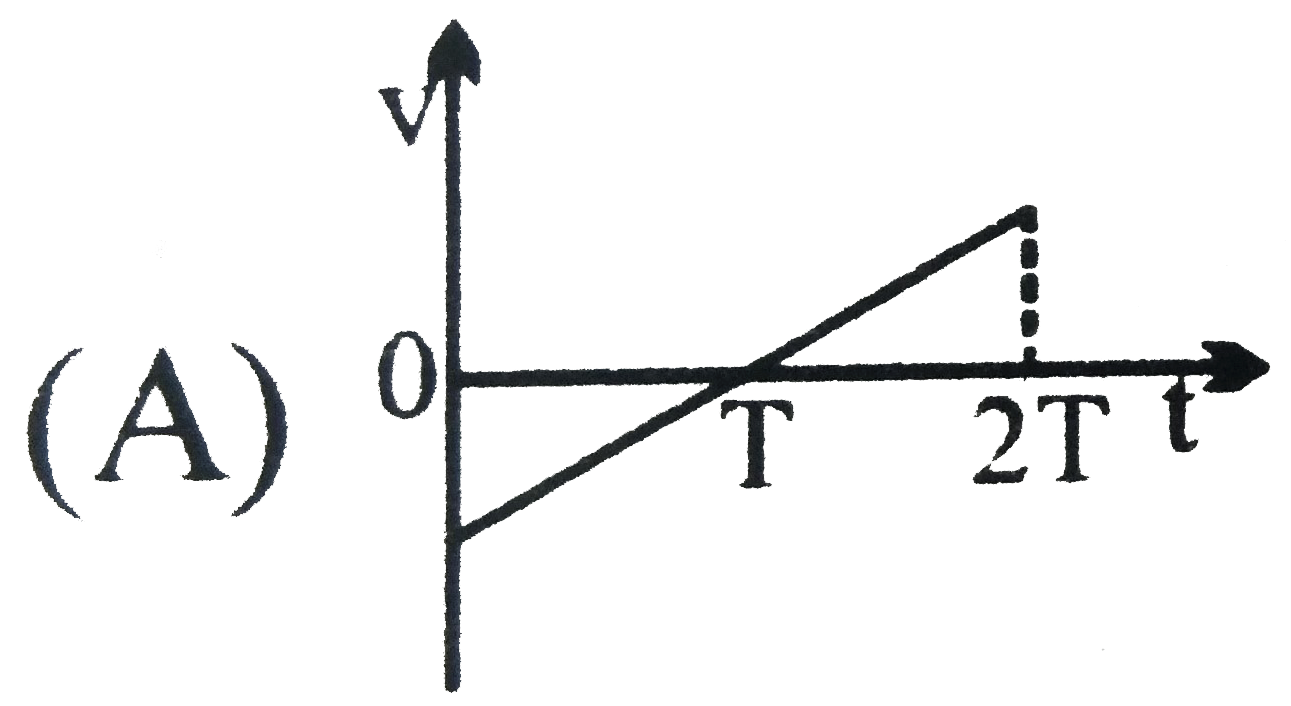
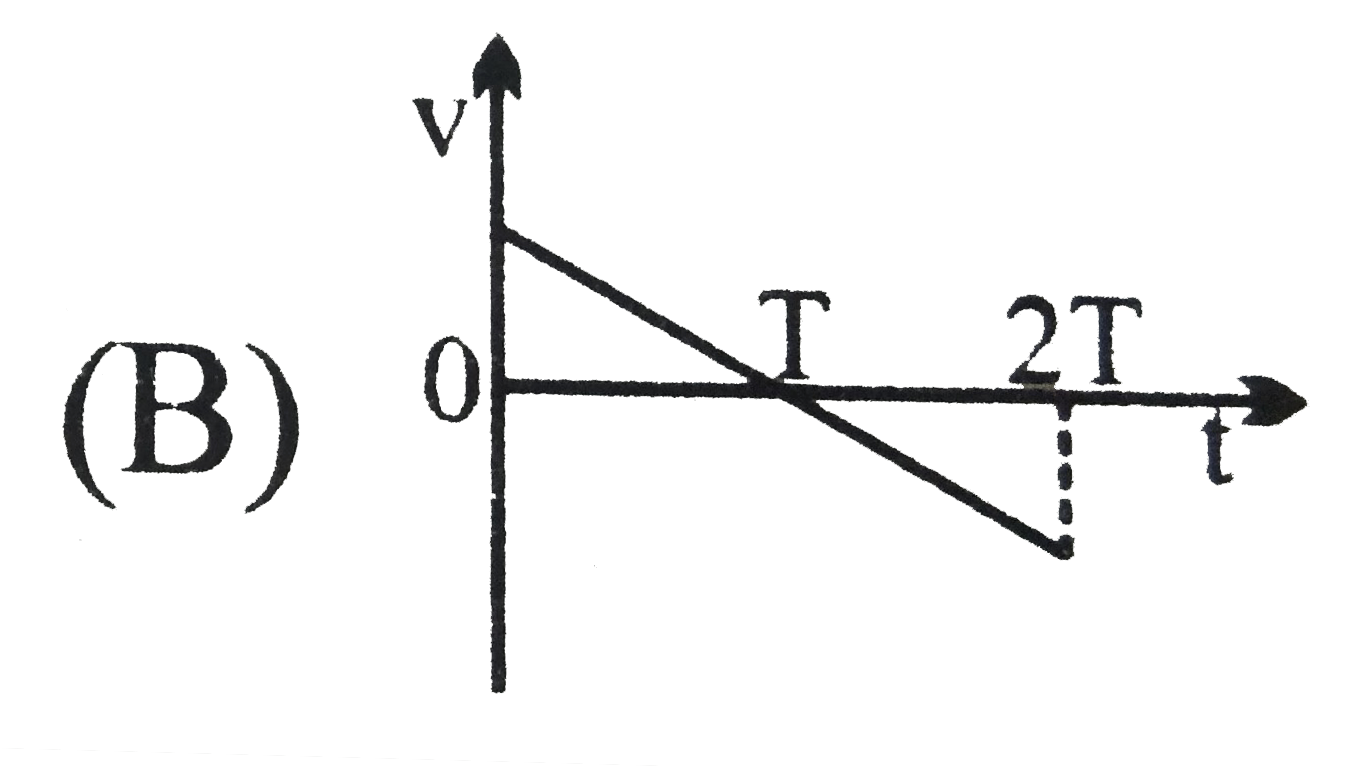
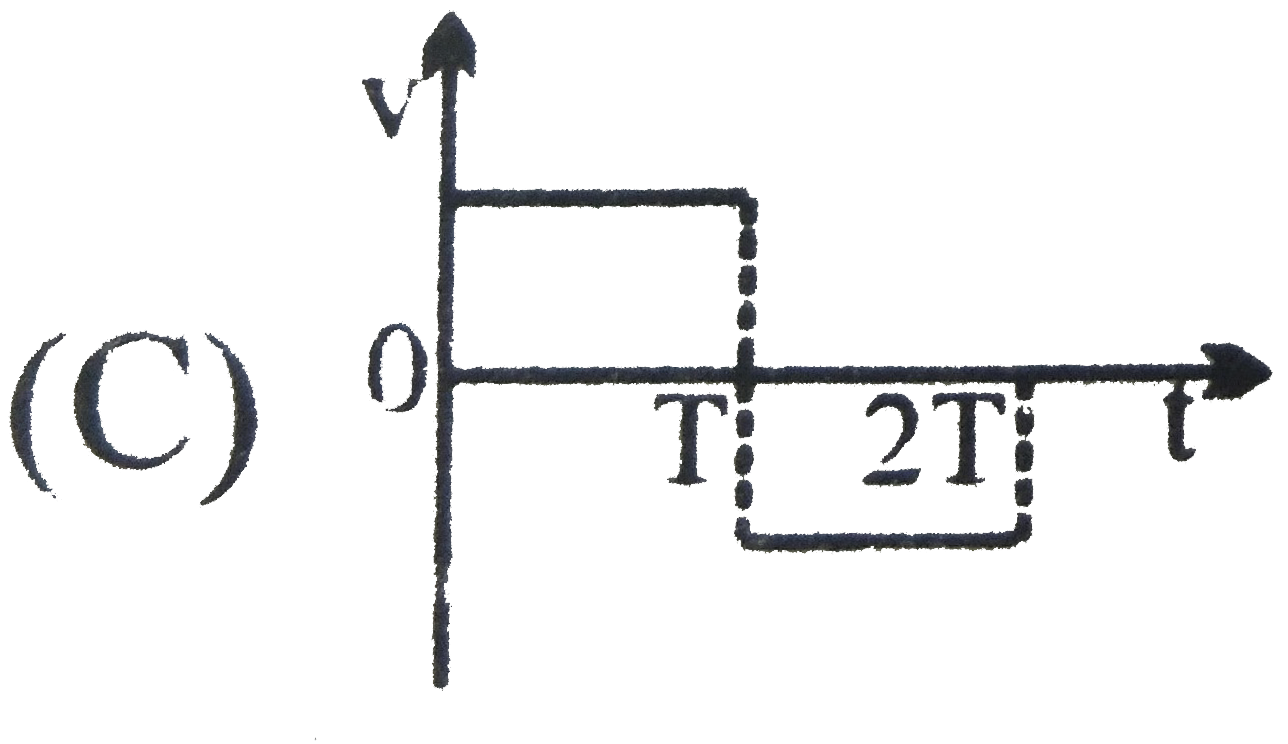
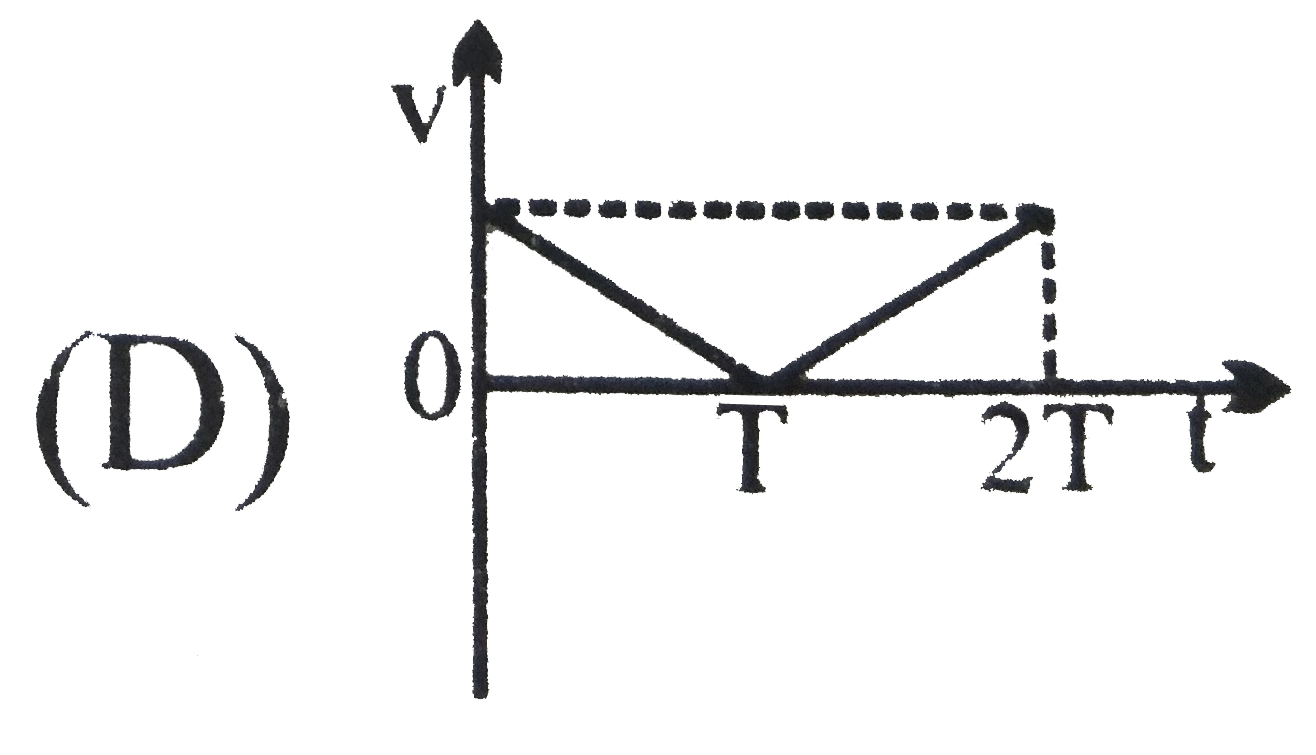
The correct Answer is:B
The x−t graph of a aprticle moving along a stright line is hown in fig.
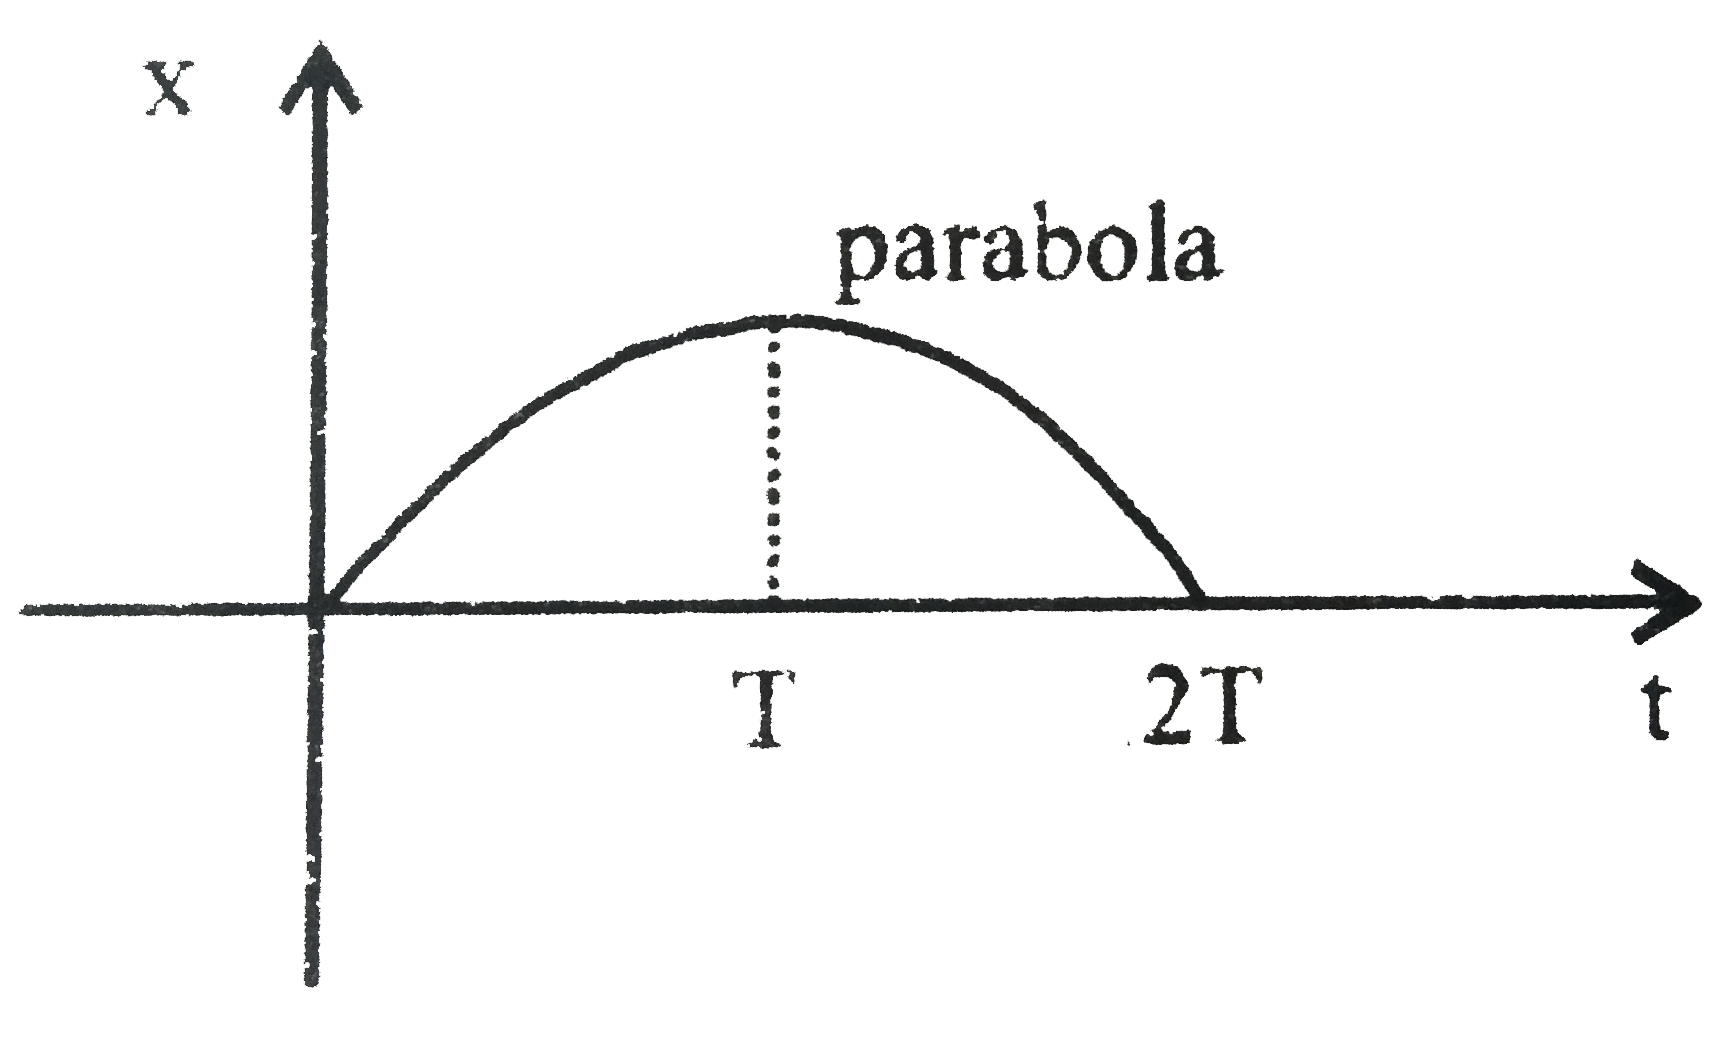
x=at−bt2⇒v=dxdt−a−2bt
Similar Questions
The velocity-time graph of a particle moving along a straight line is shown in the figure-given below
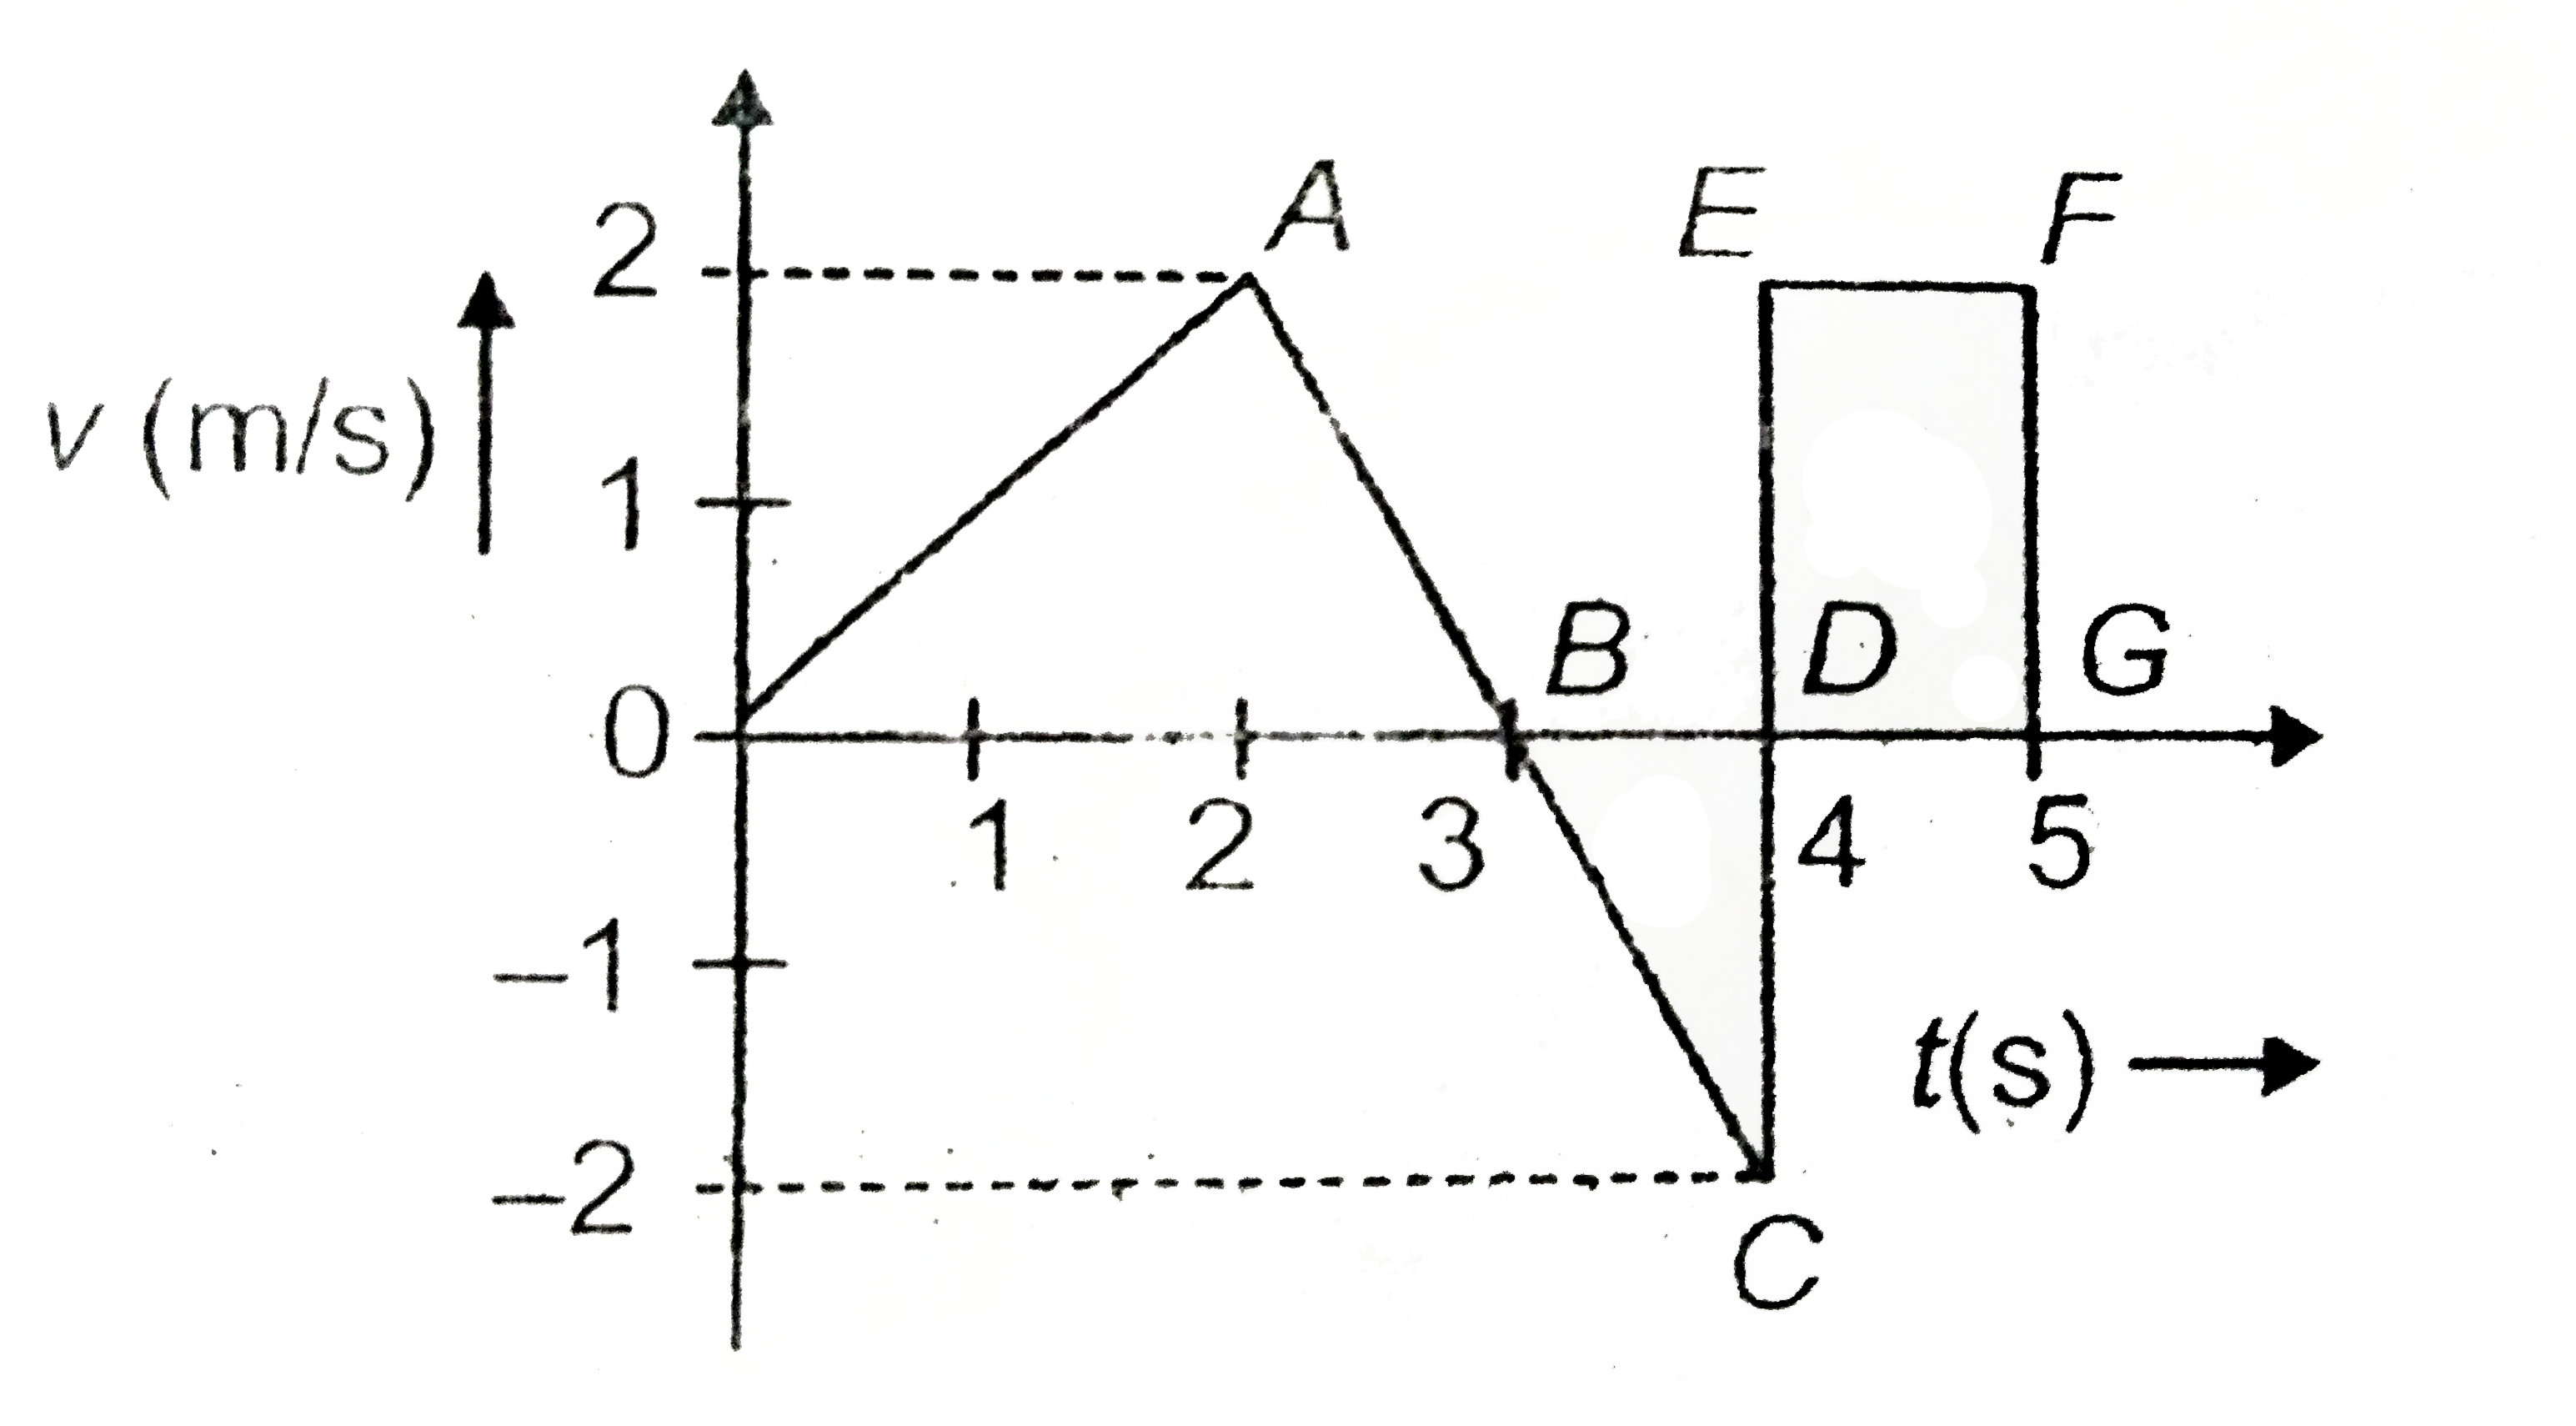
The displacement of the particle in 5 second is
View SolutionThe x-t graph of a particle moving along a straight line is shown in figure
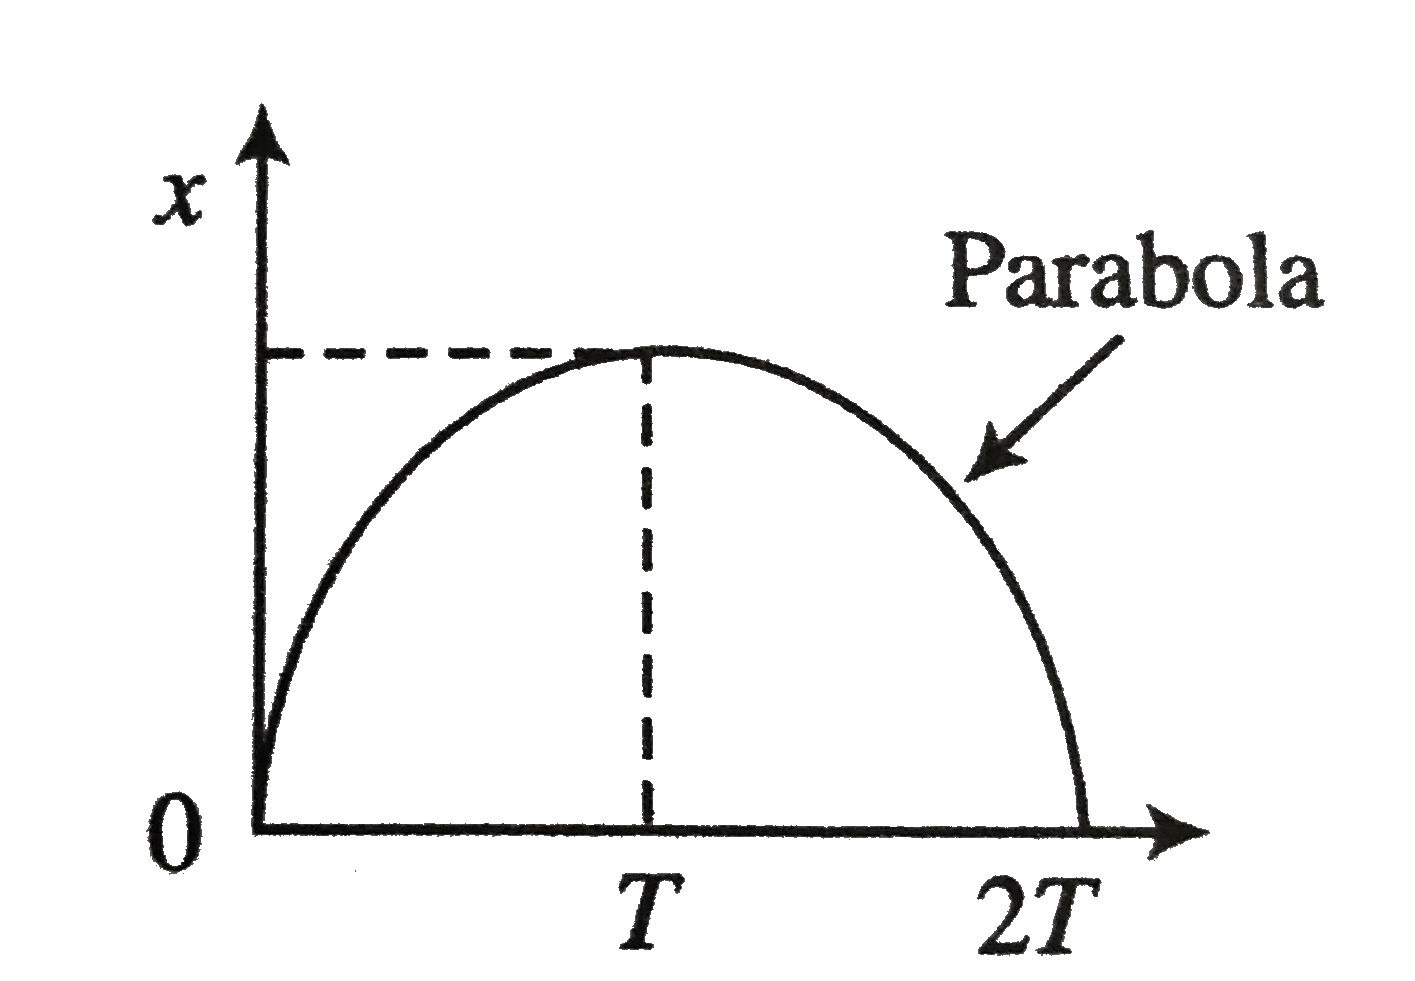
The speed-time graph of the particle is correctly shown by
View Solution
Knowledge Check
The x-t graph of a particle moving along a straight line is shown in figure

The v-t graph of the particle is correctly shown byA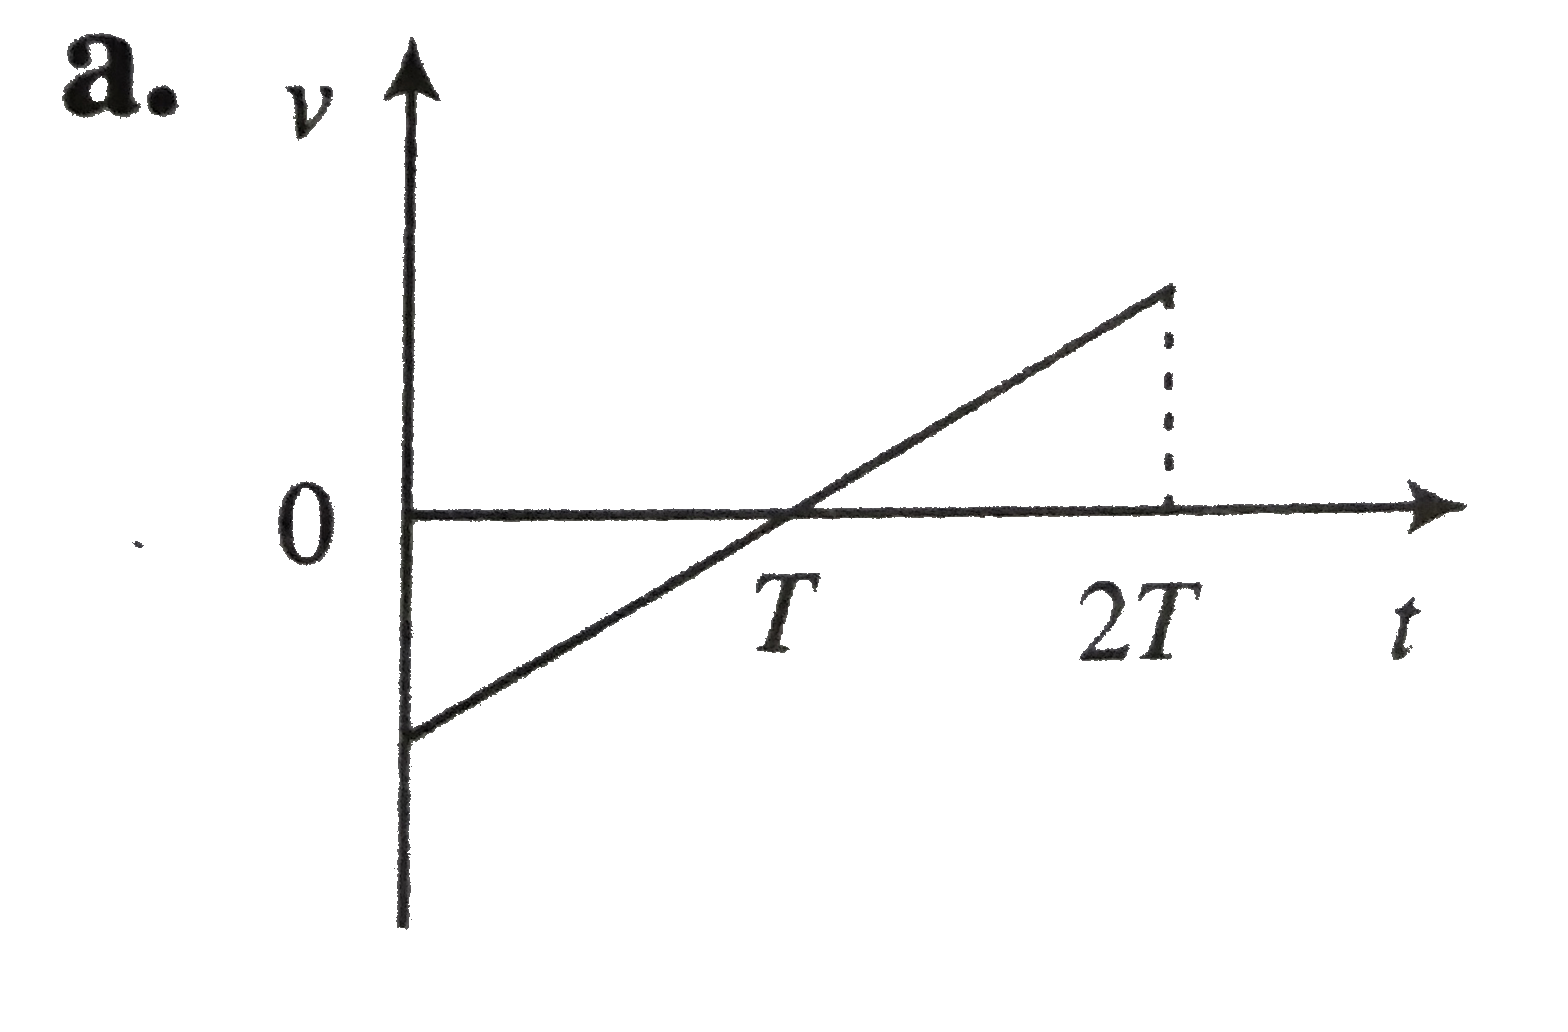 B
B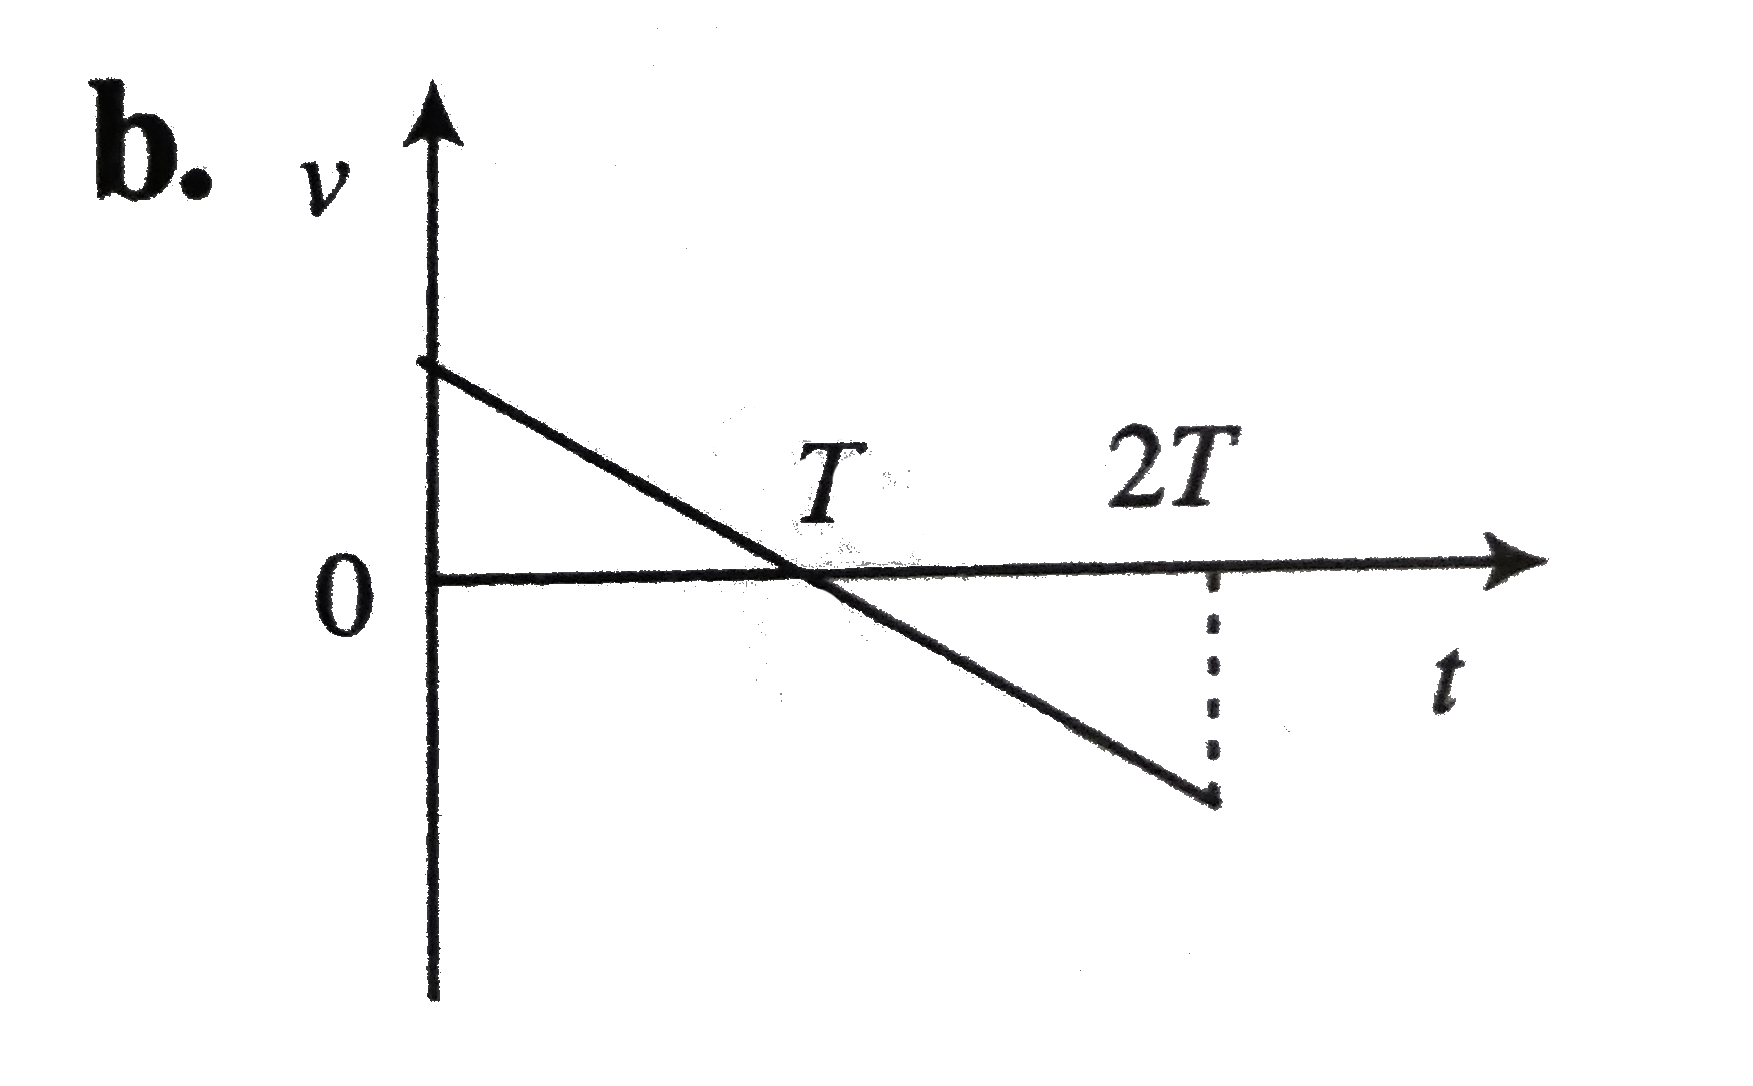 C
C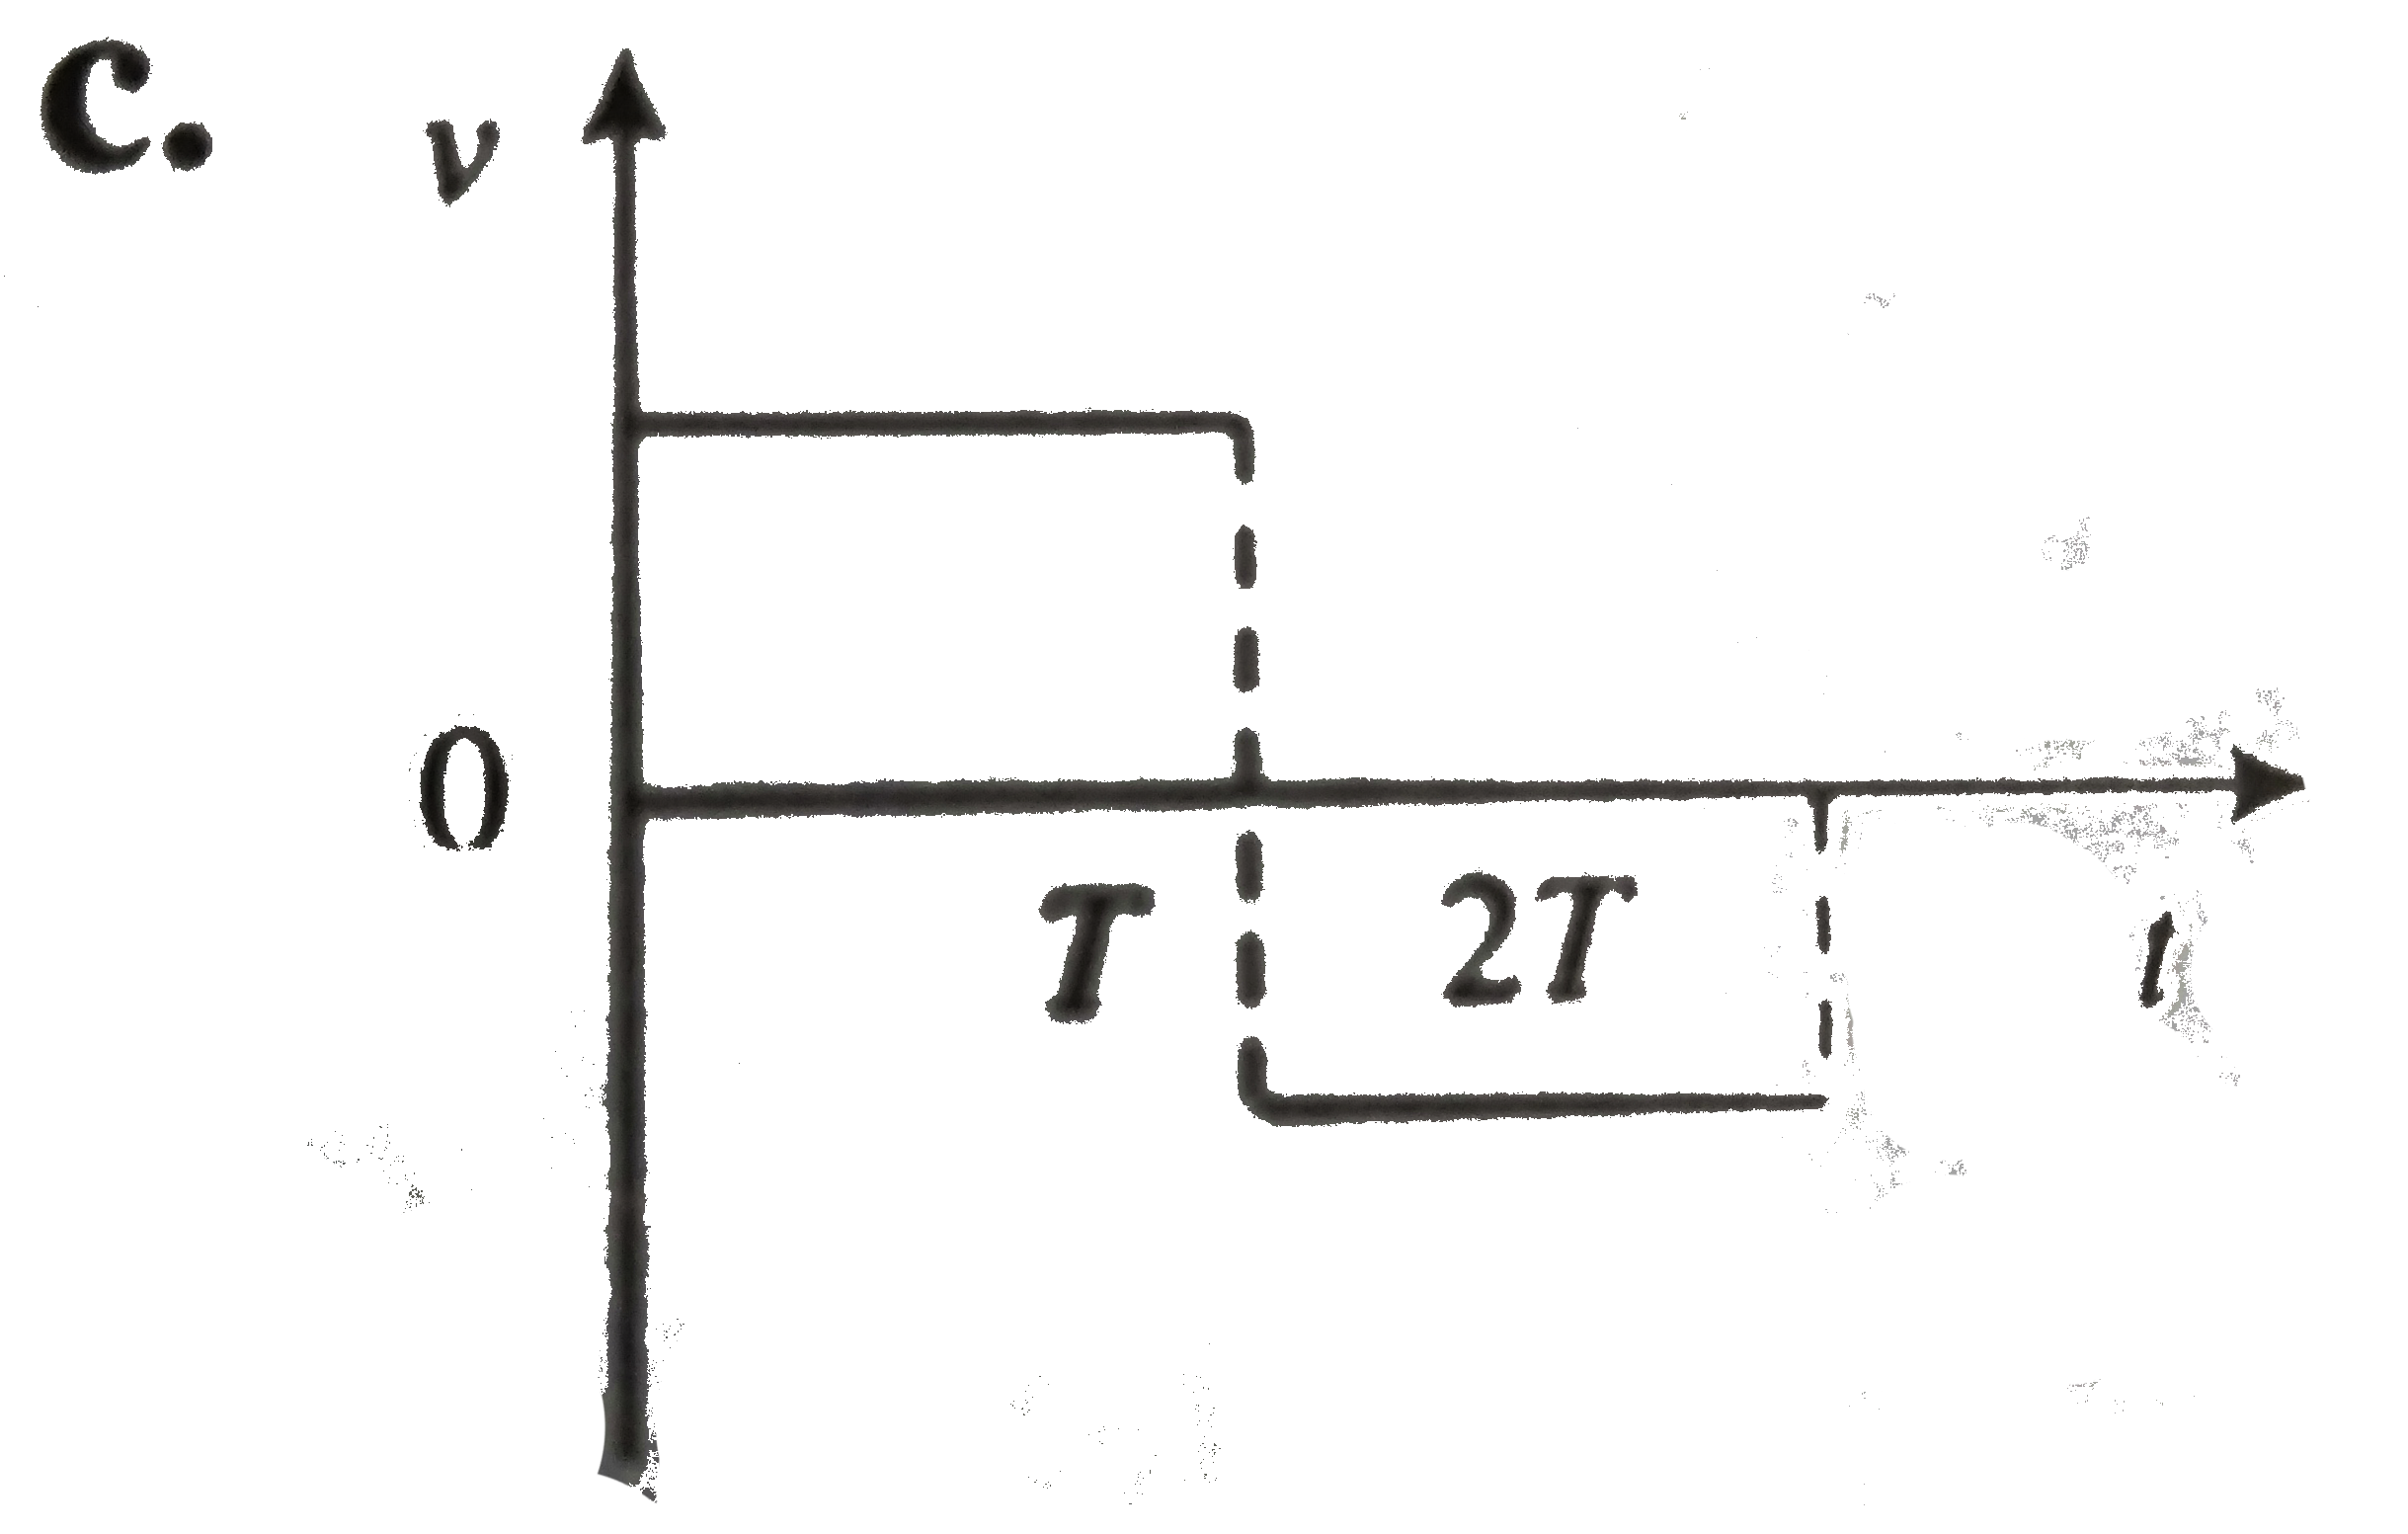 D
D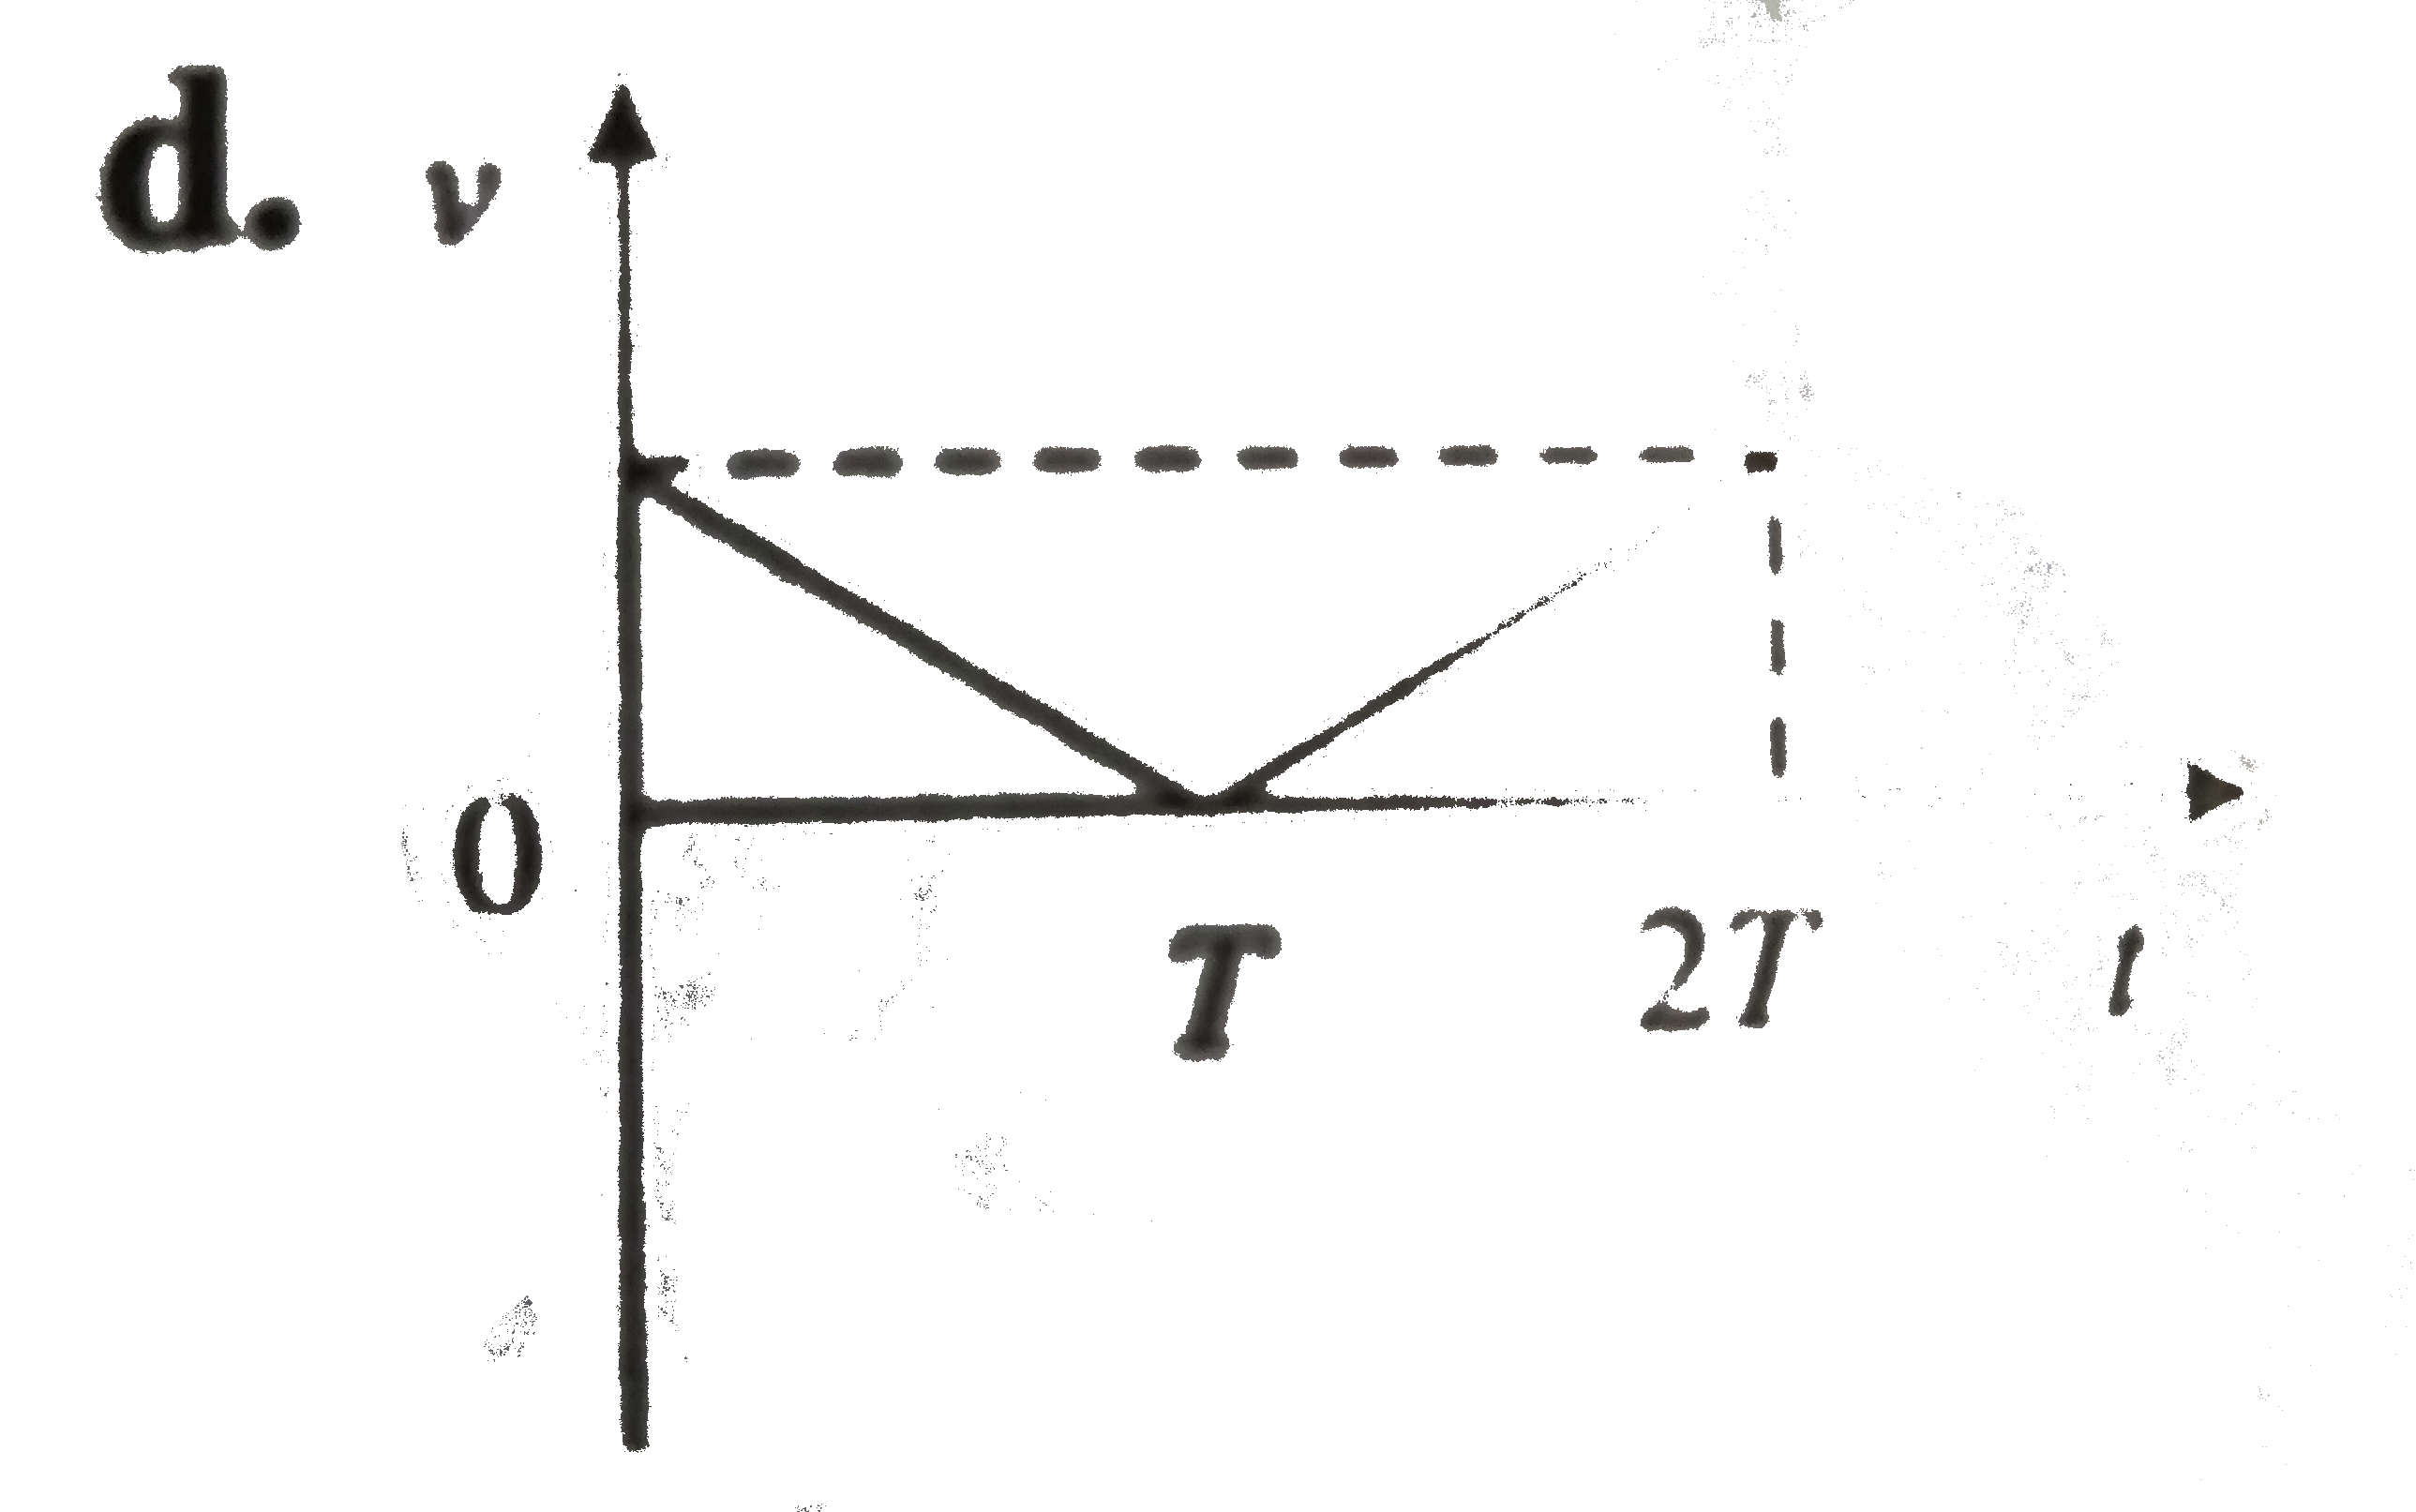
The x−t graph of particle moving along a straight line is shown in figure
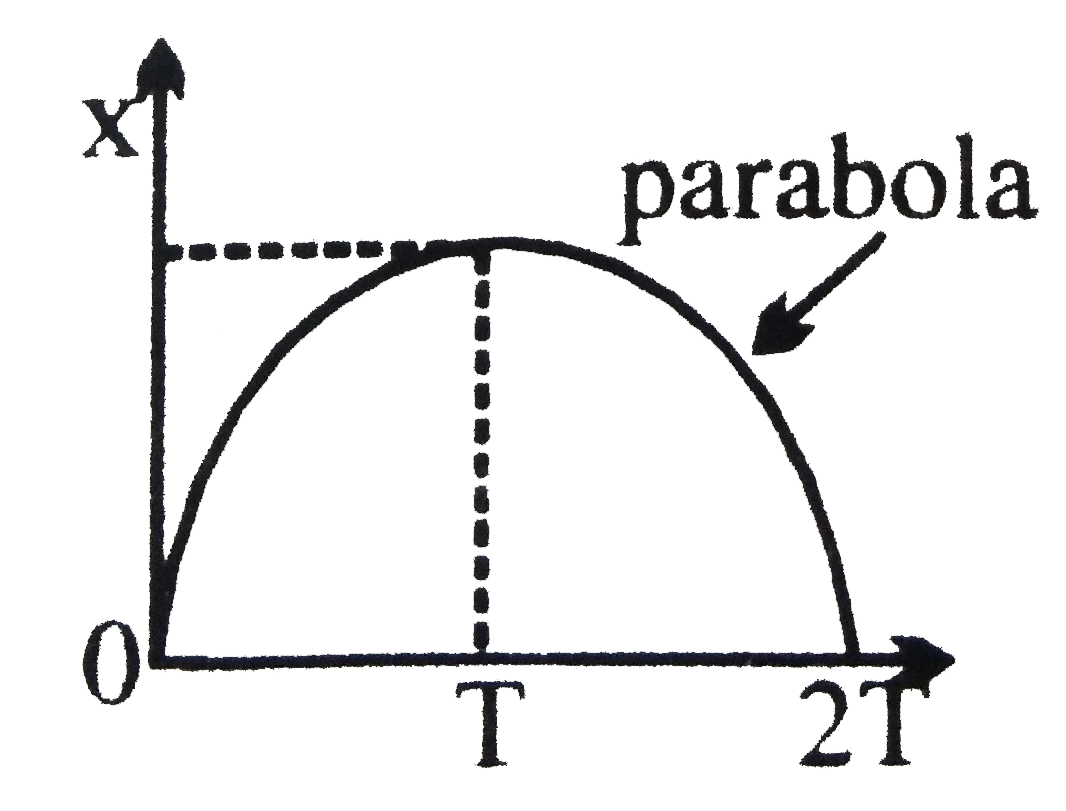
The a−t graph of the particle is correctly shown byA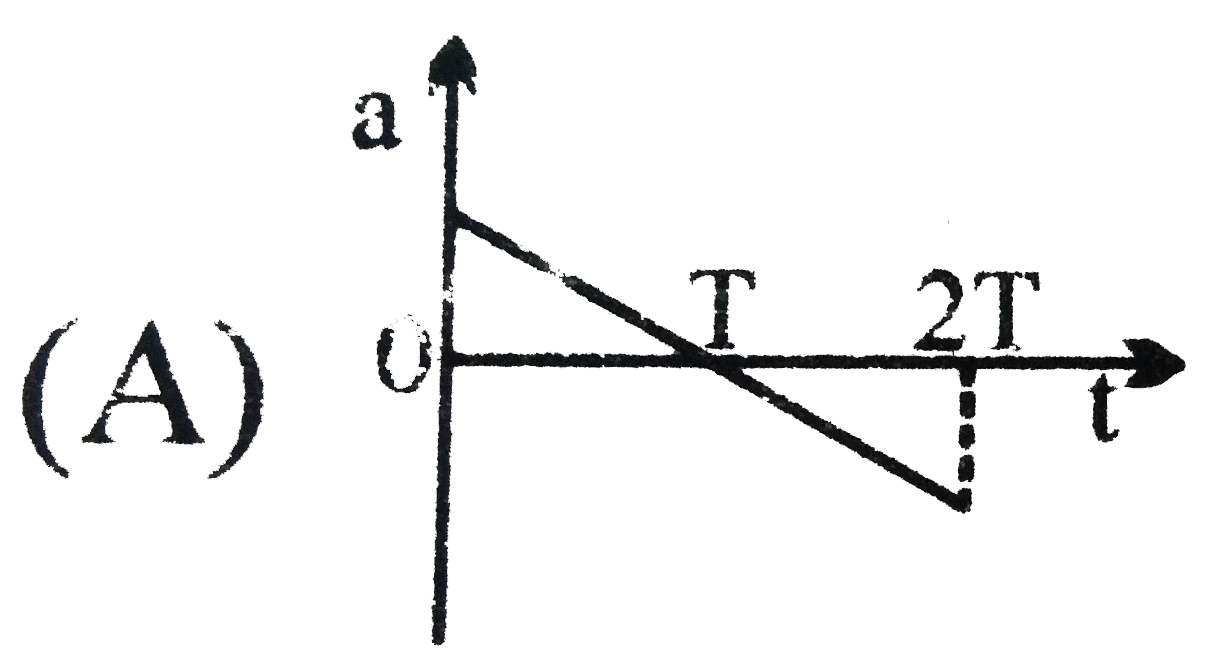 B
B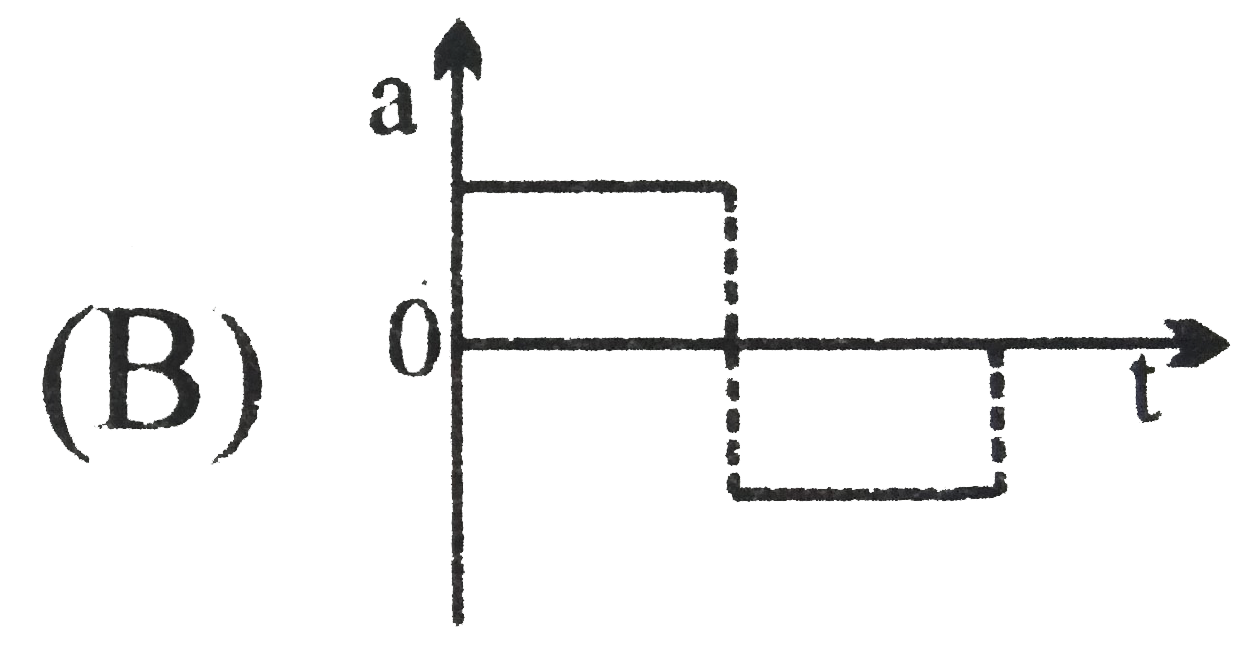 C
C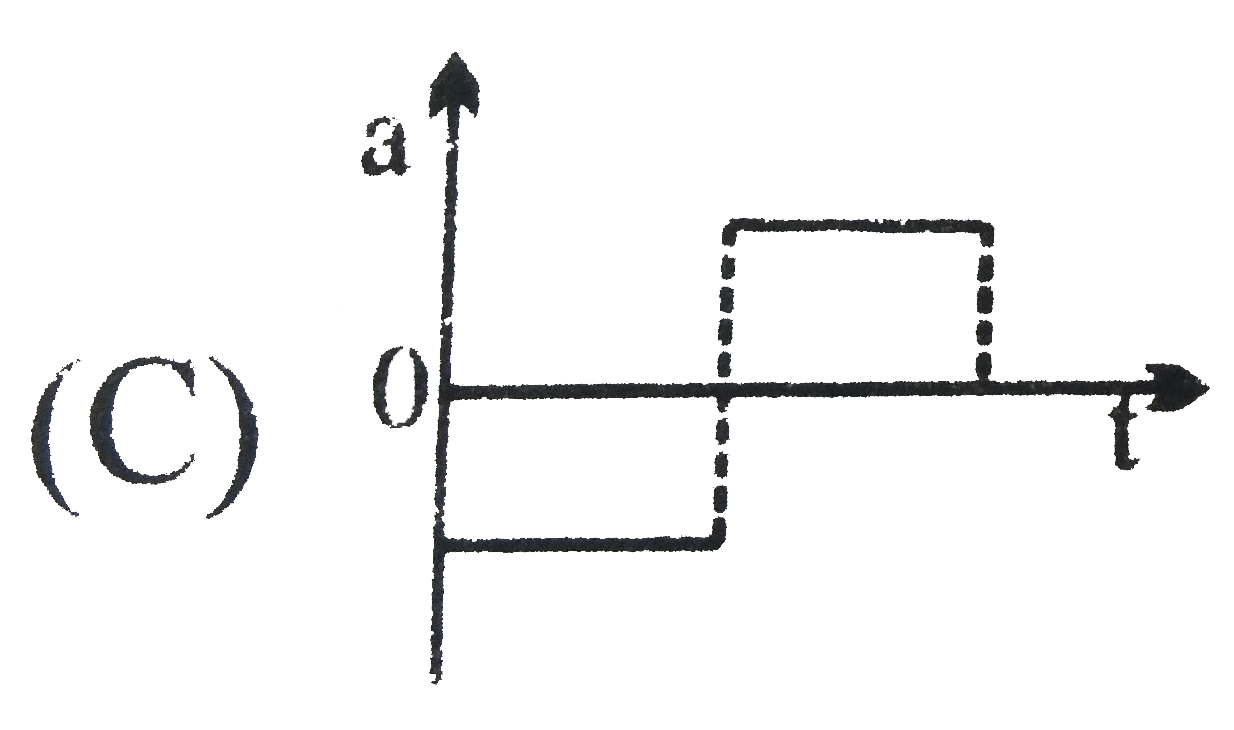 D
D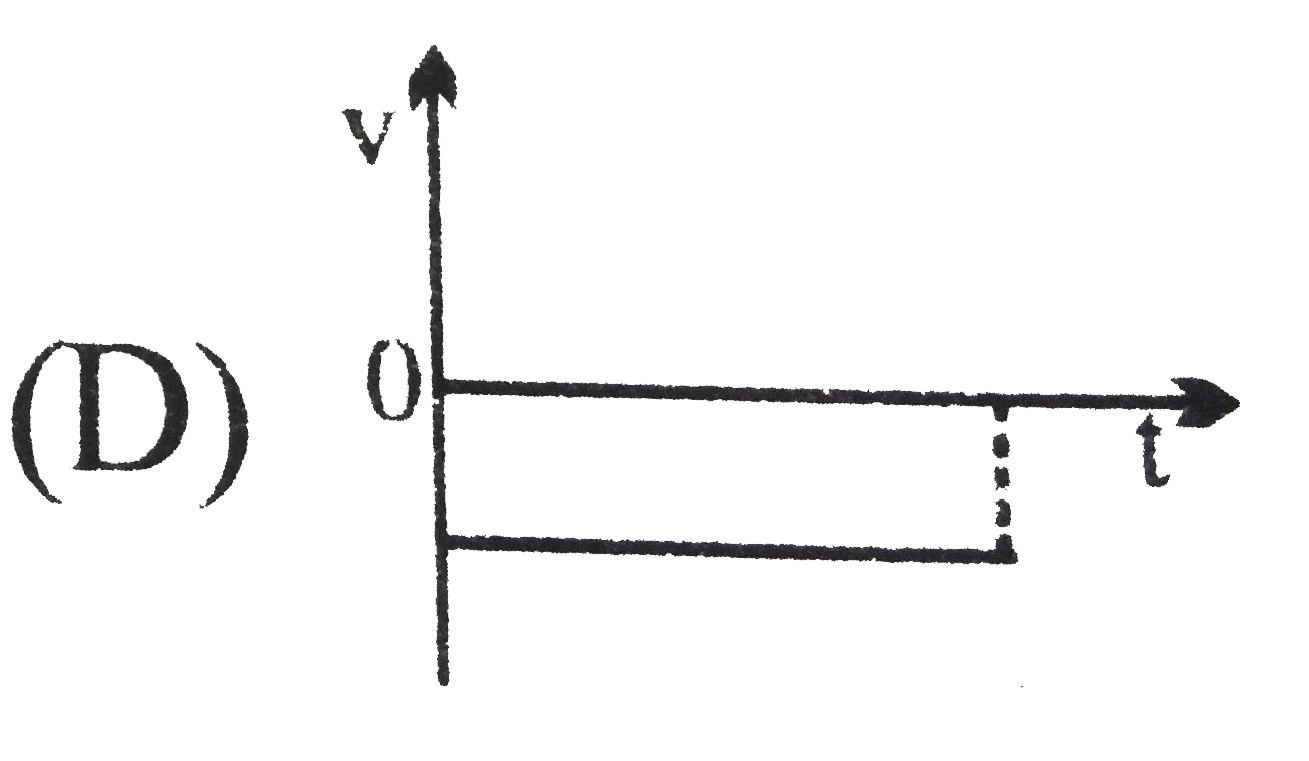
The x-t graph of a particle moving along a straight line is shown in figure
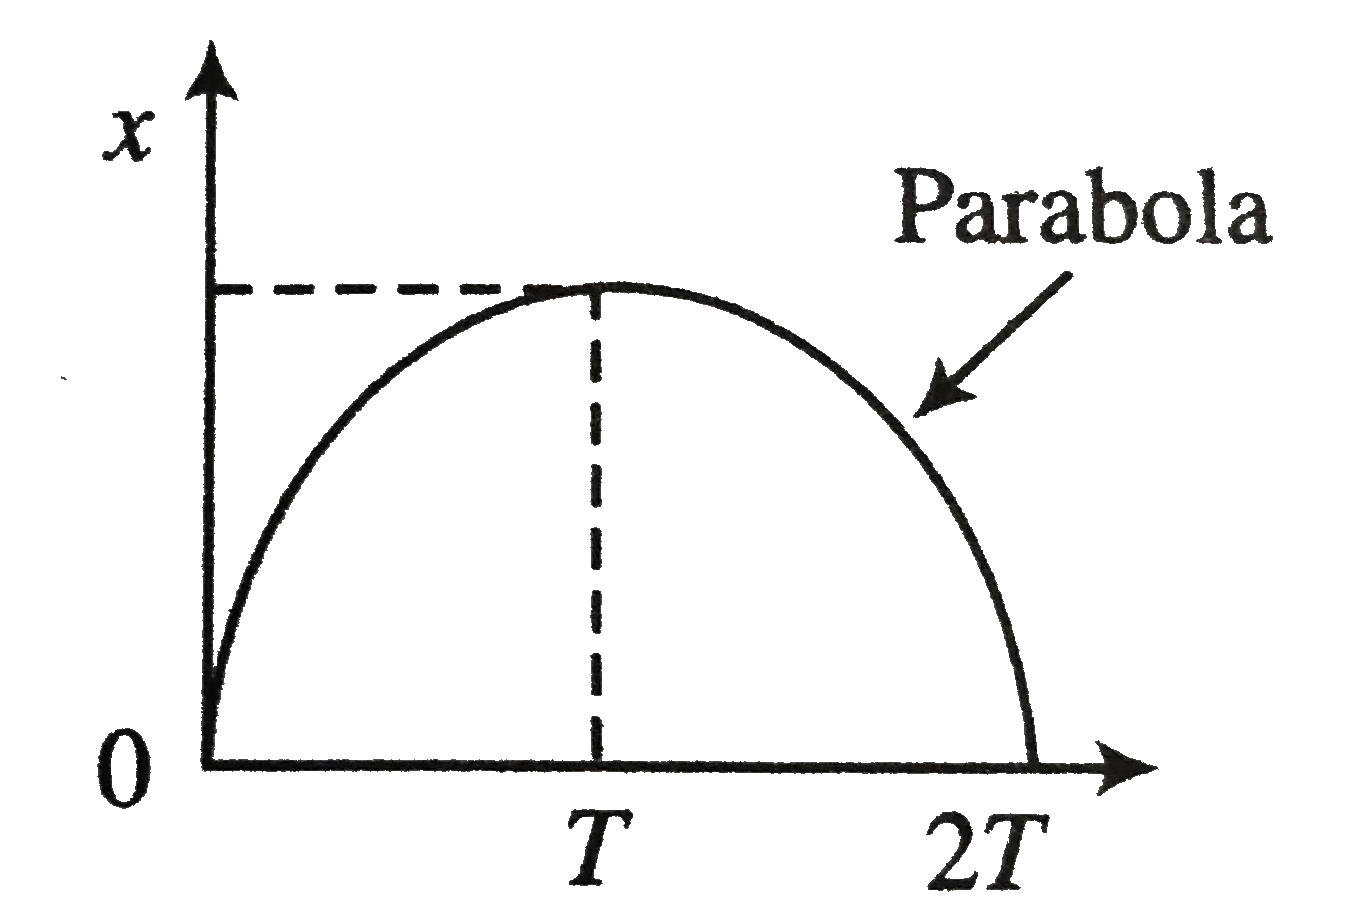
The a-t graph of the particle is correctly shown byA B
B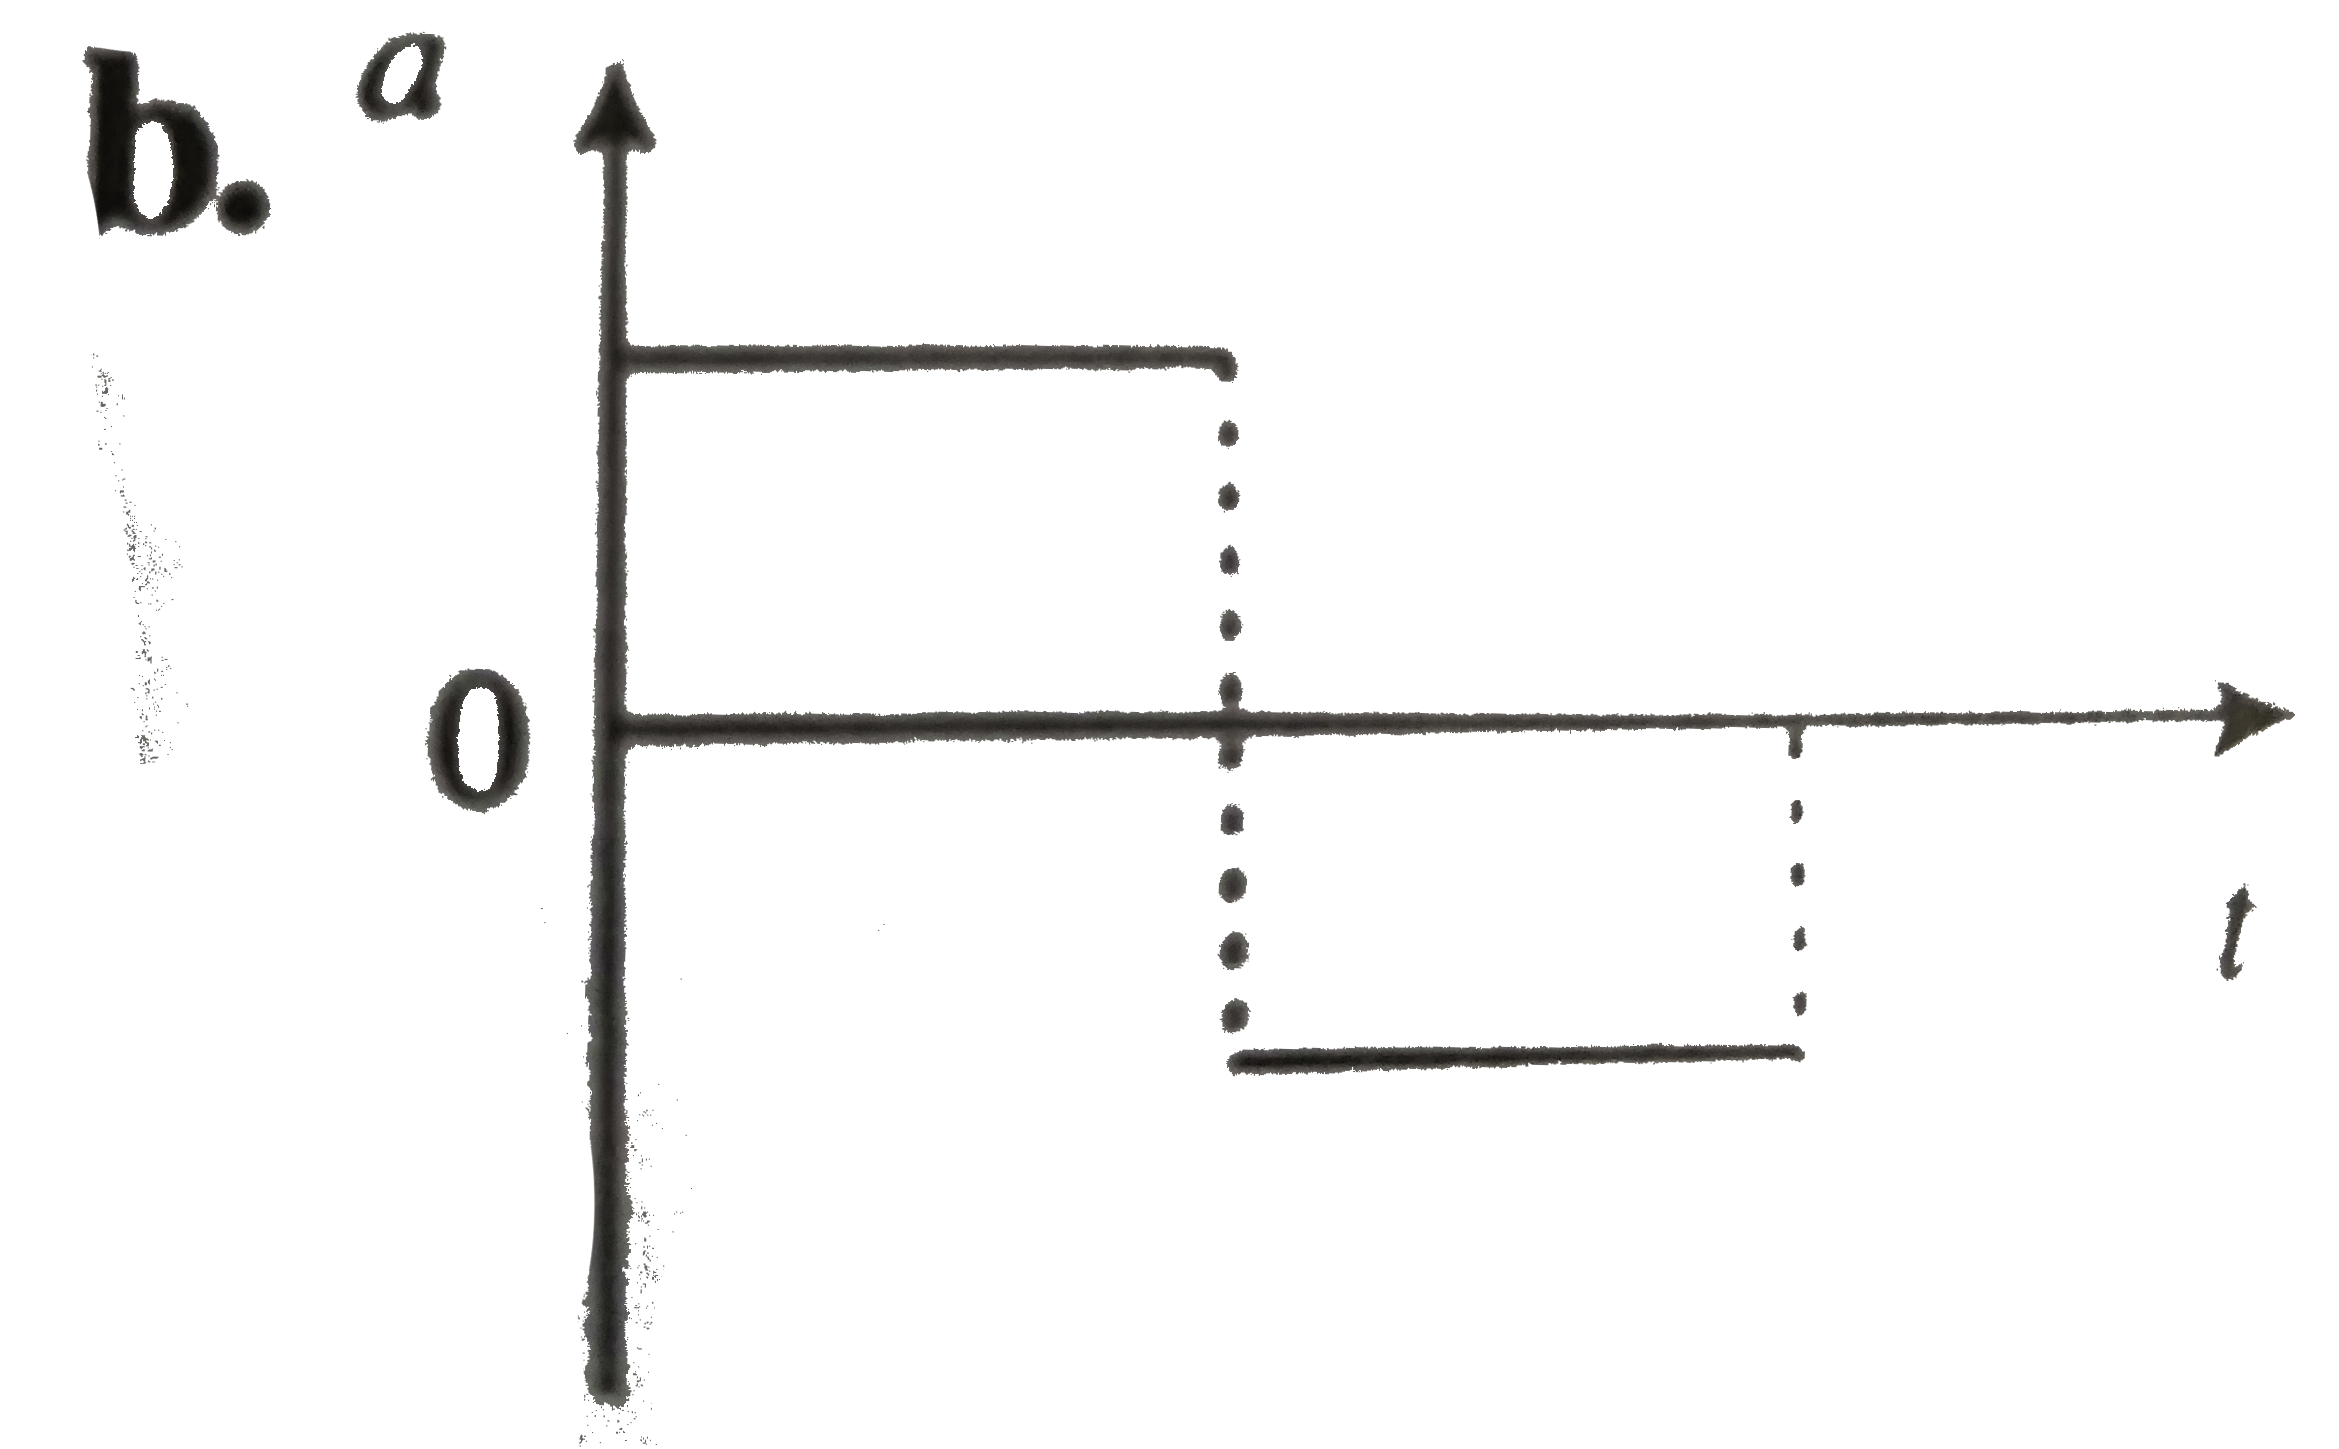 C
C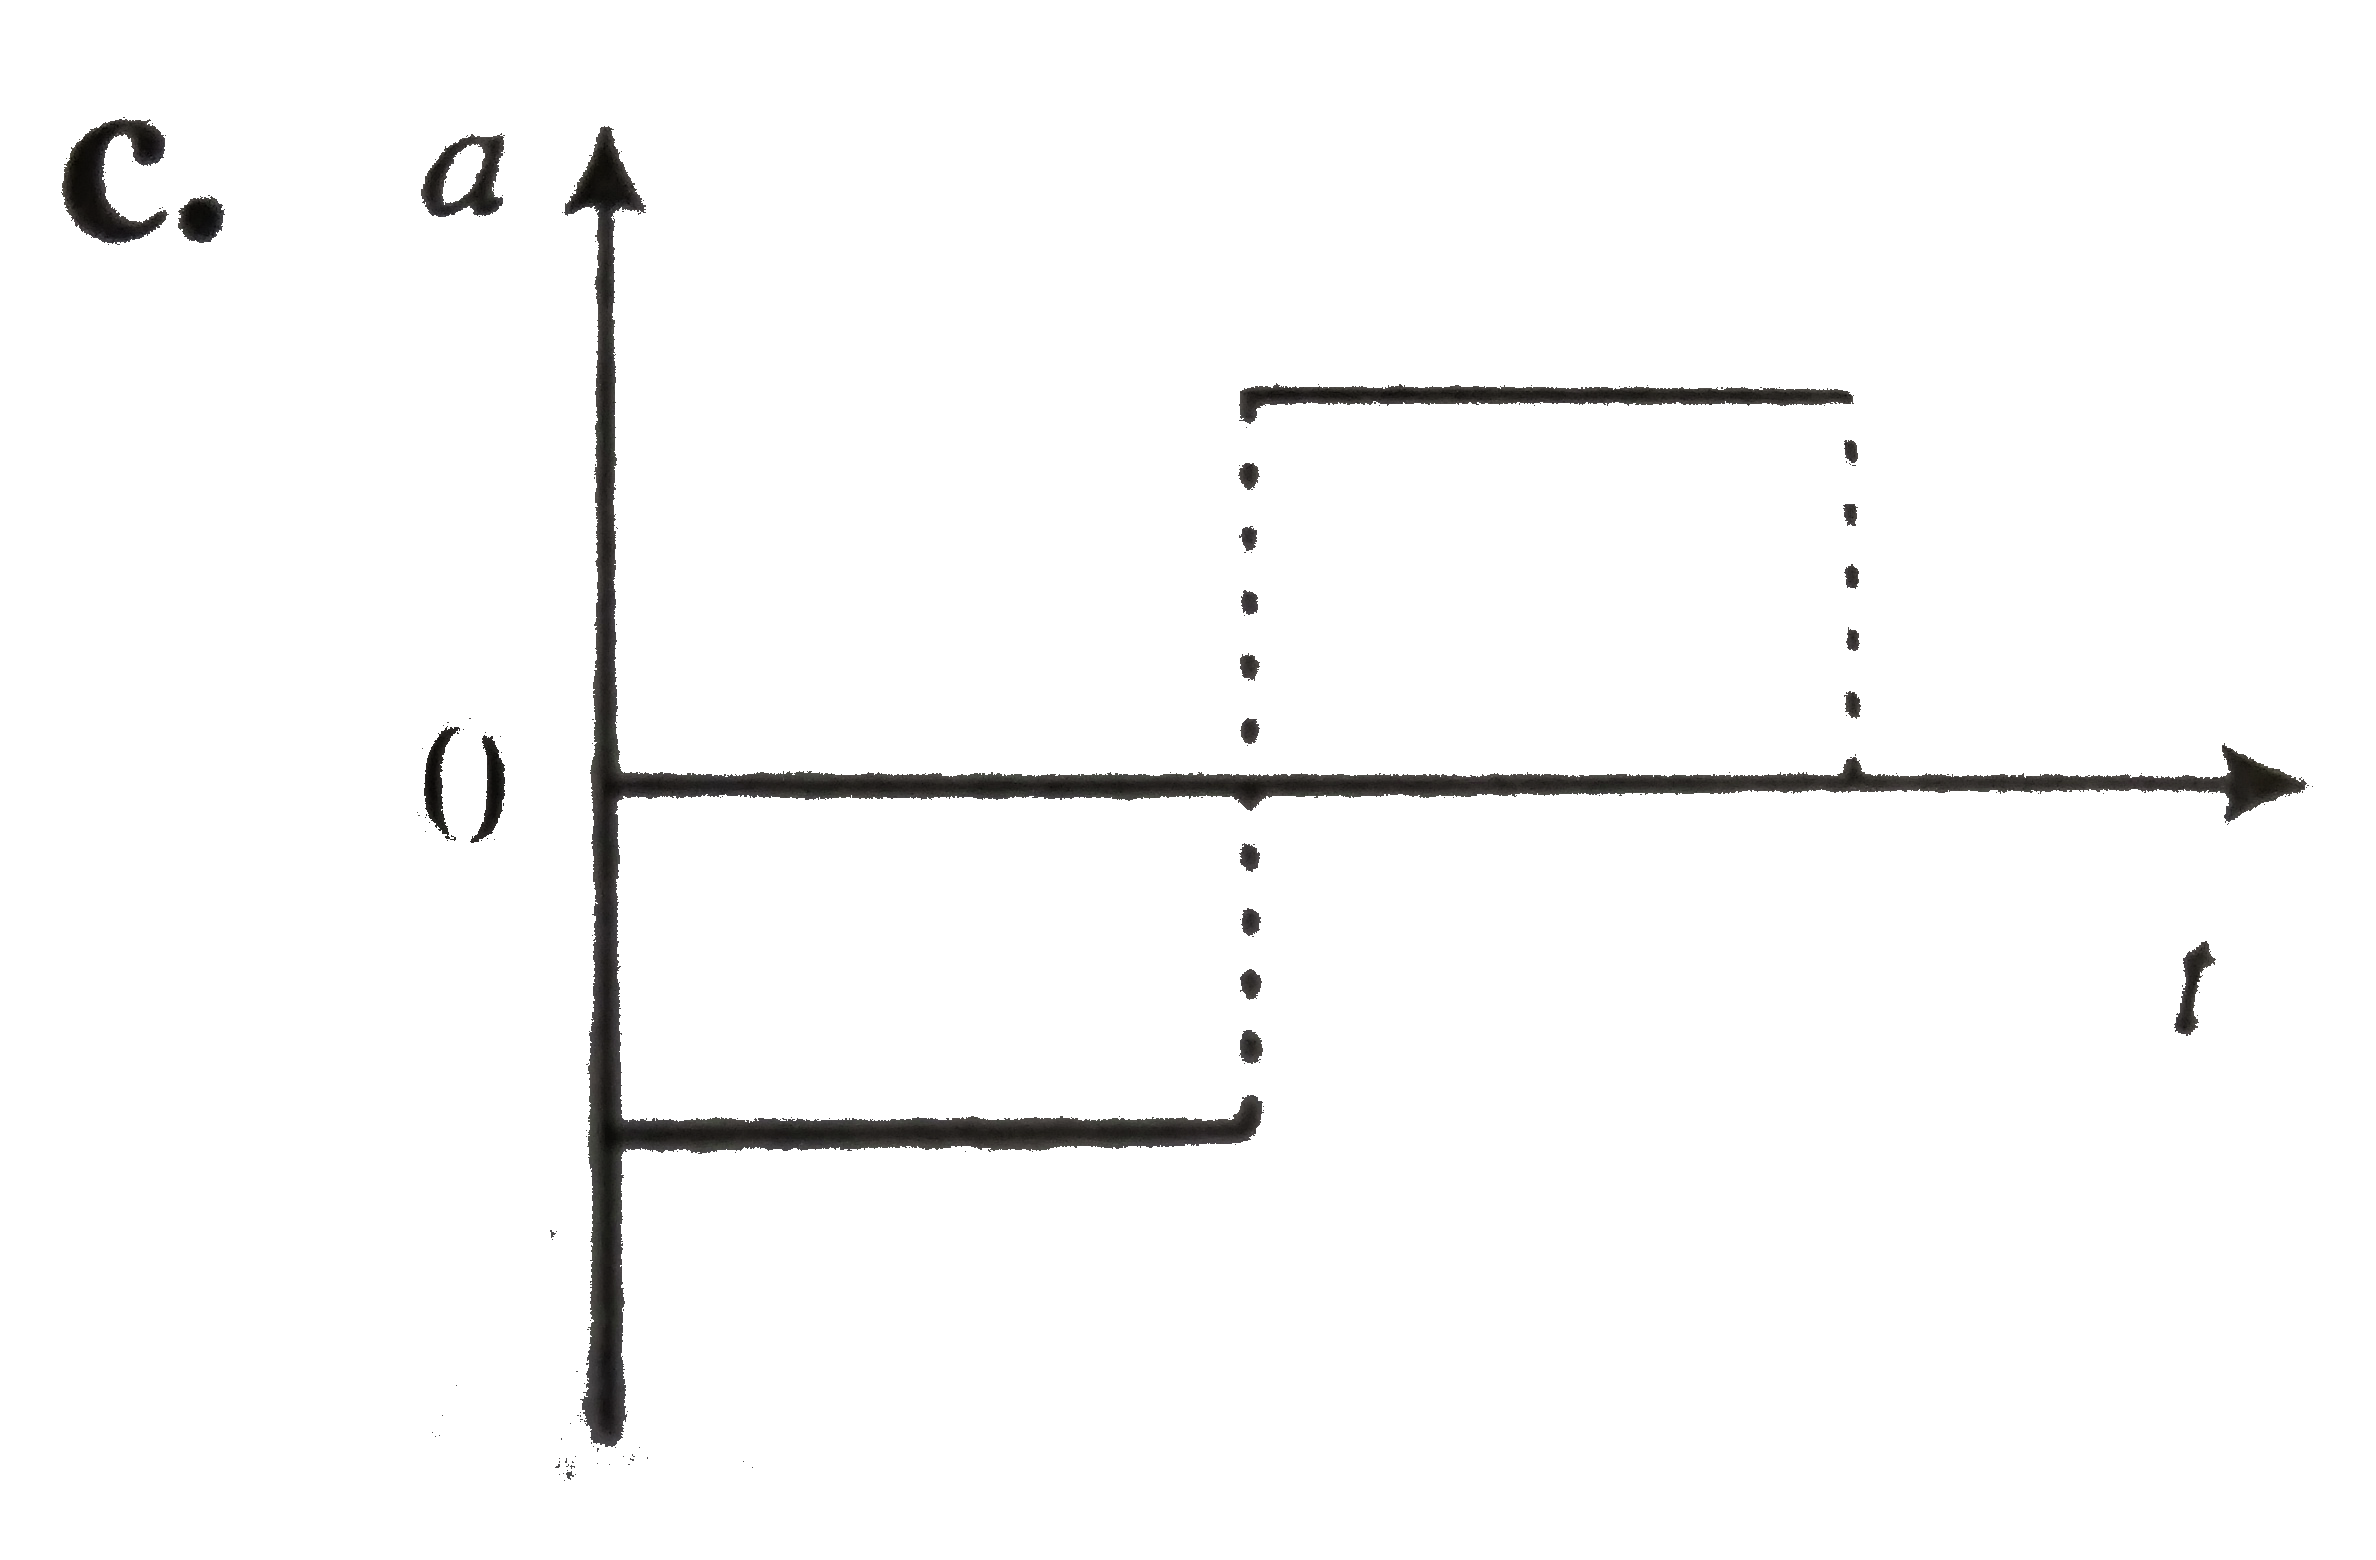 D
D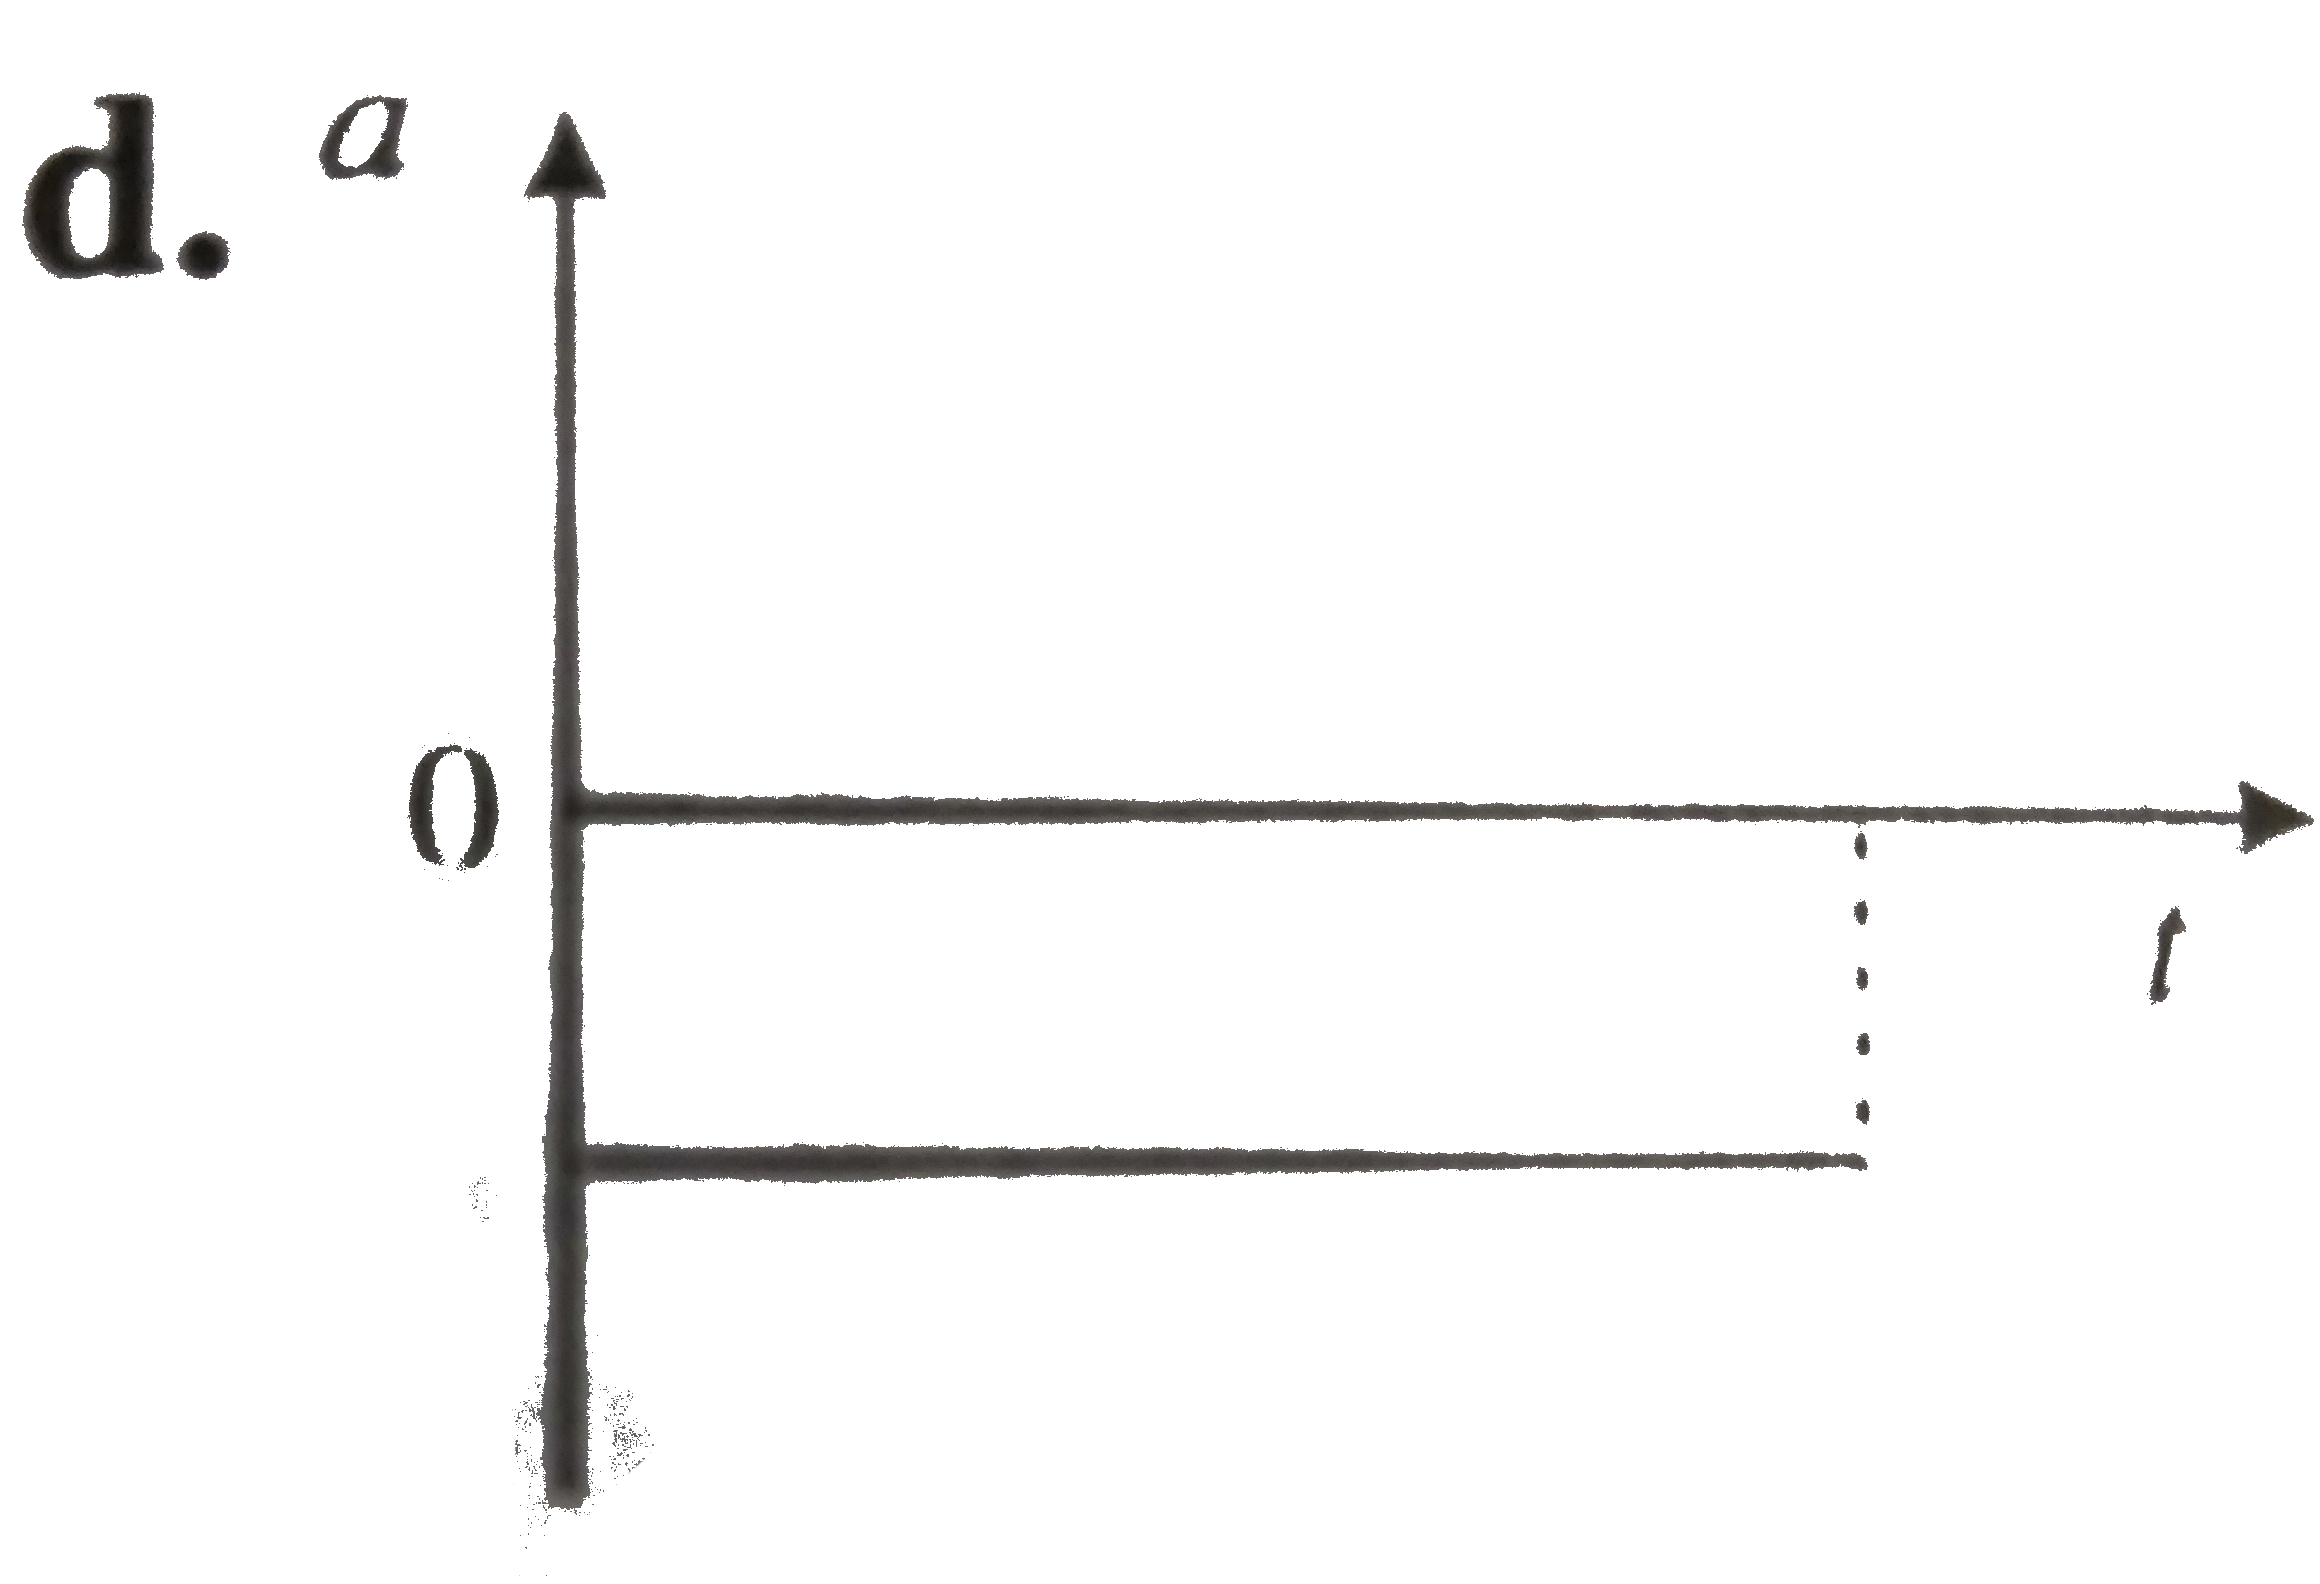
The x−t graph of particle moving along a straight line is shown in figure
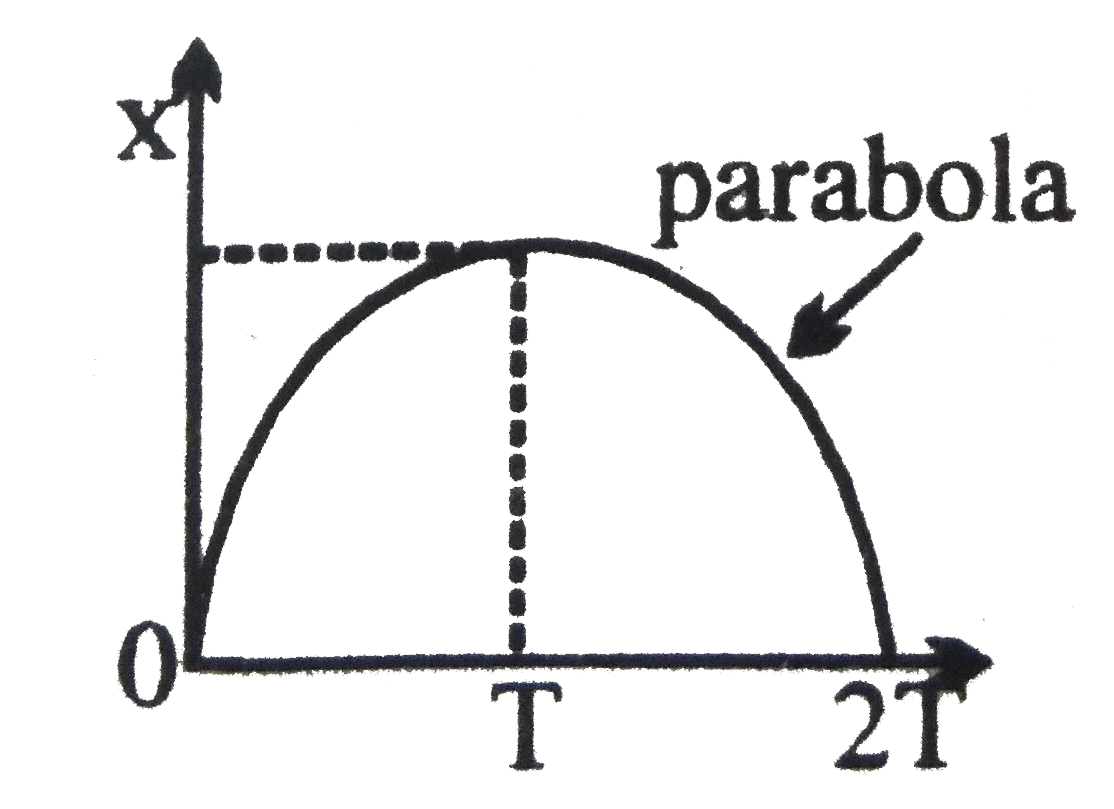
The speed-time graph of the particle si correctly shown by
View SolutionDisplacement time graph of a particle moving in a straight line is a shown in figure.

View SolutionThe velocity-time graph of a particle moving in a straight line is shown in figure. The mass of the particle is 2kg. Work done by all the forces acting on the particle in time interval between t=0 to t=10s is
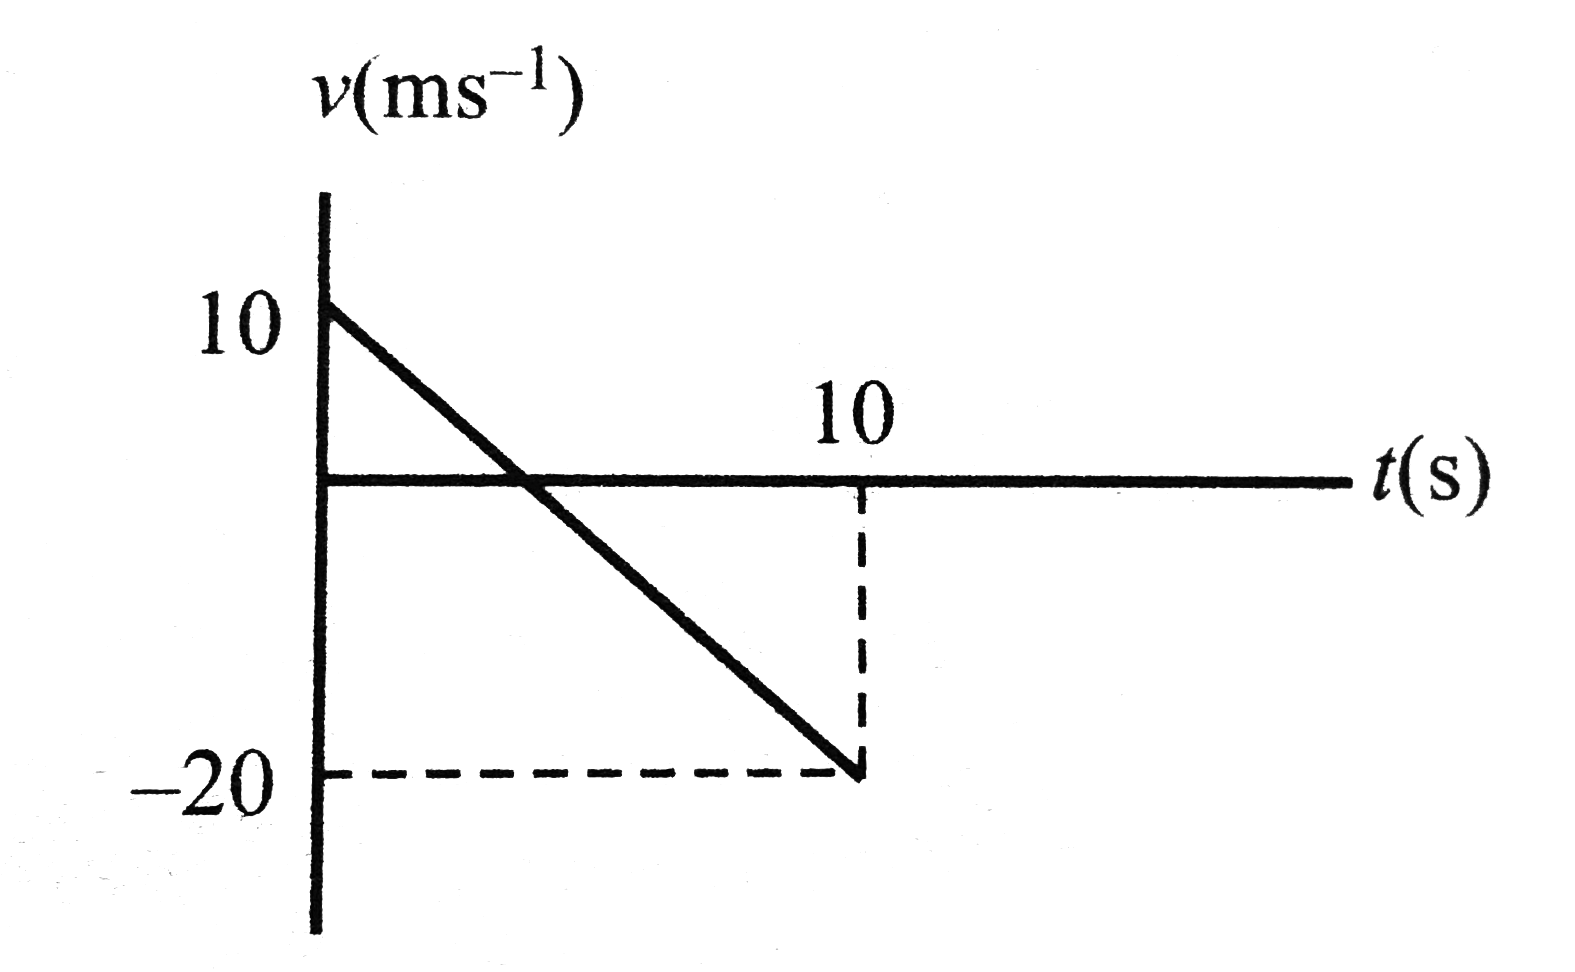
View SolutionThe velocity -time (v−t) graph of a particle moving in a straight line is shown in figure. The acceleration of the particle at t=9 is:
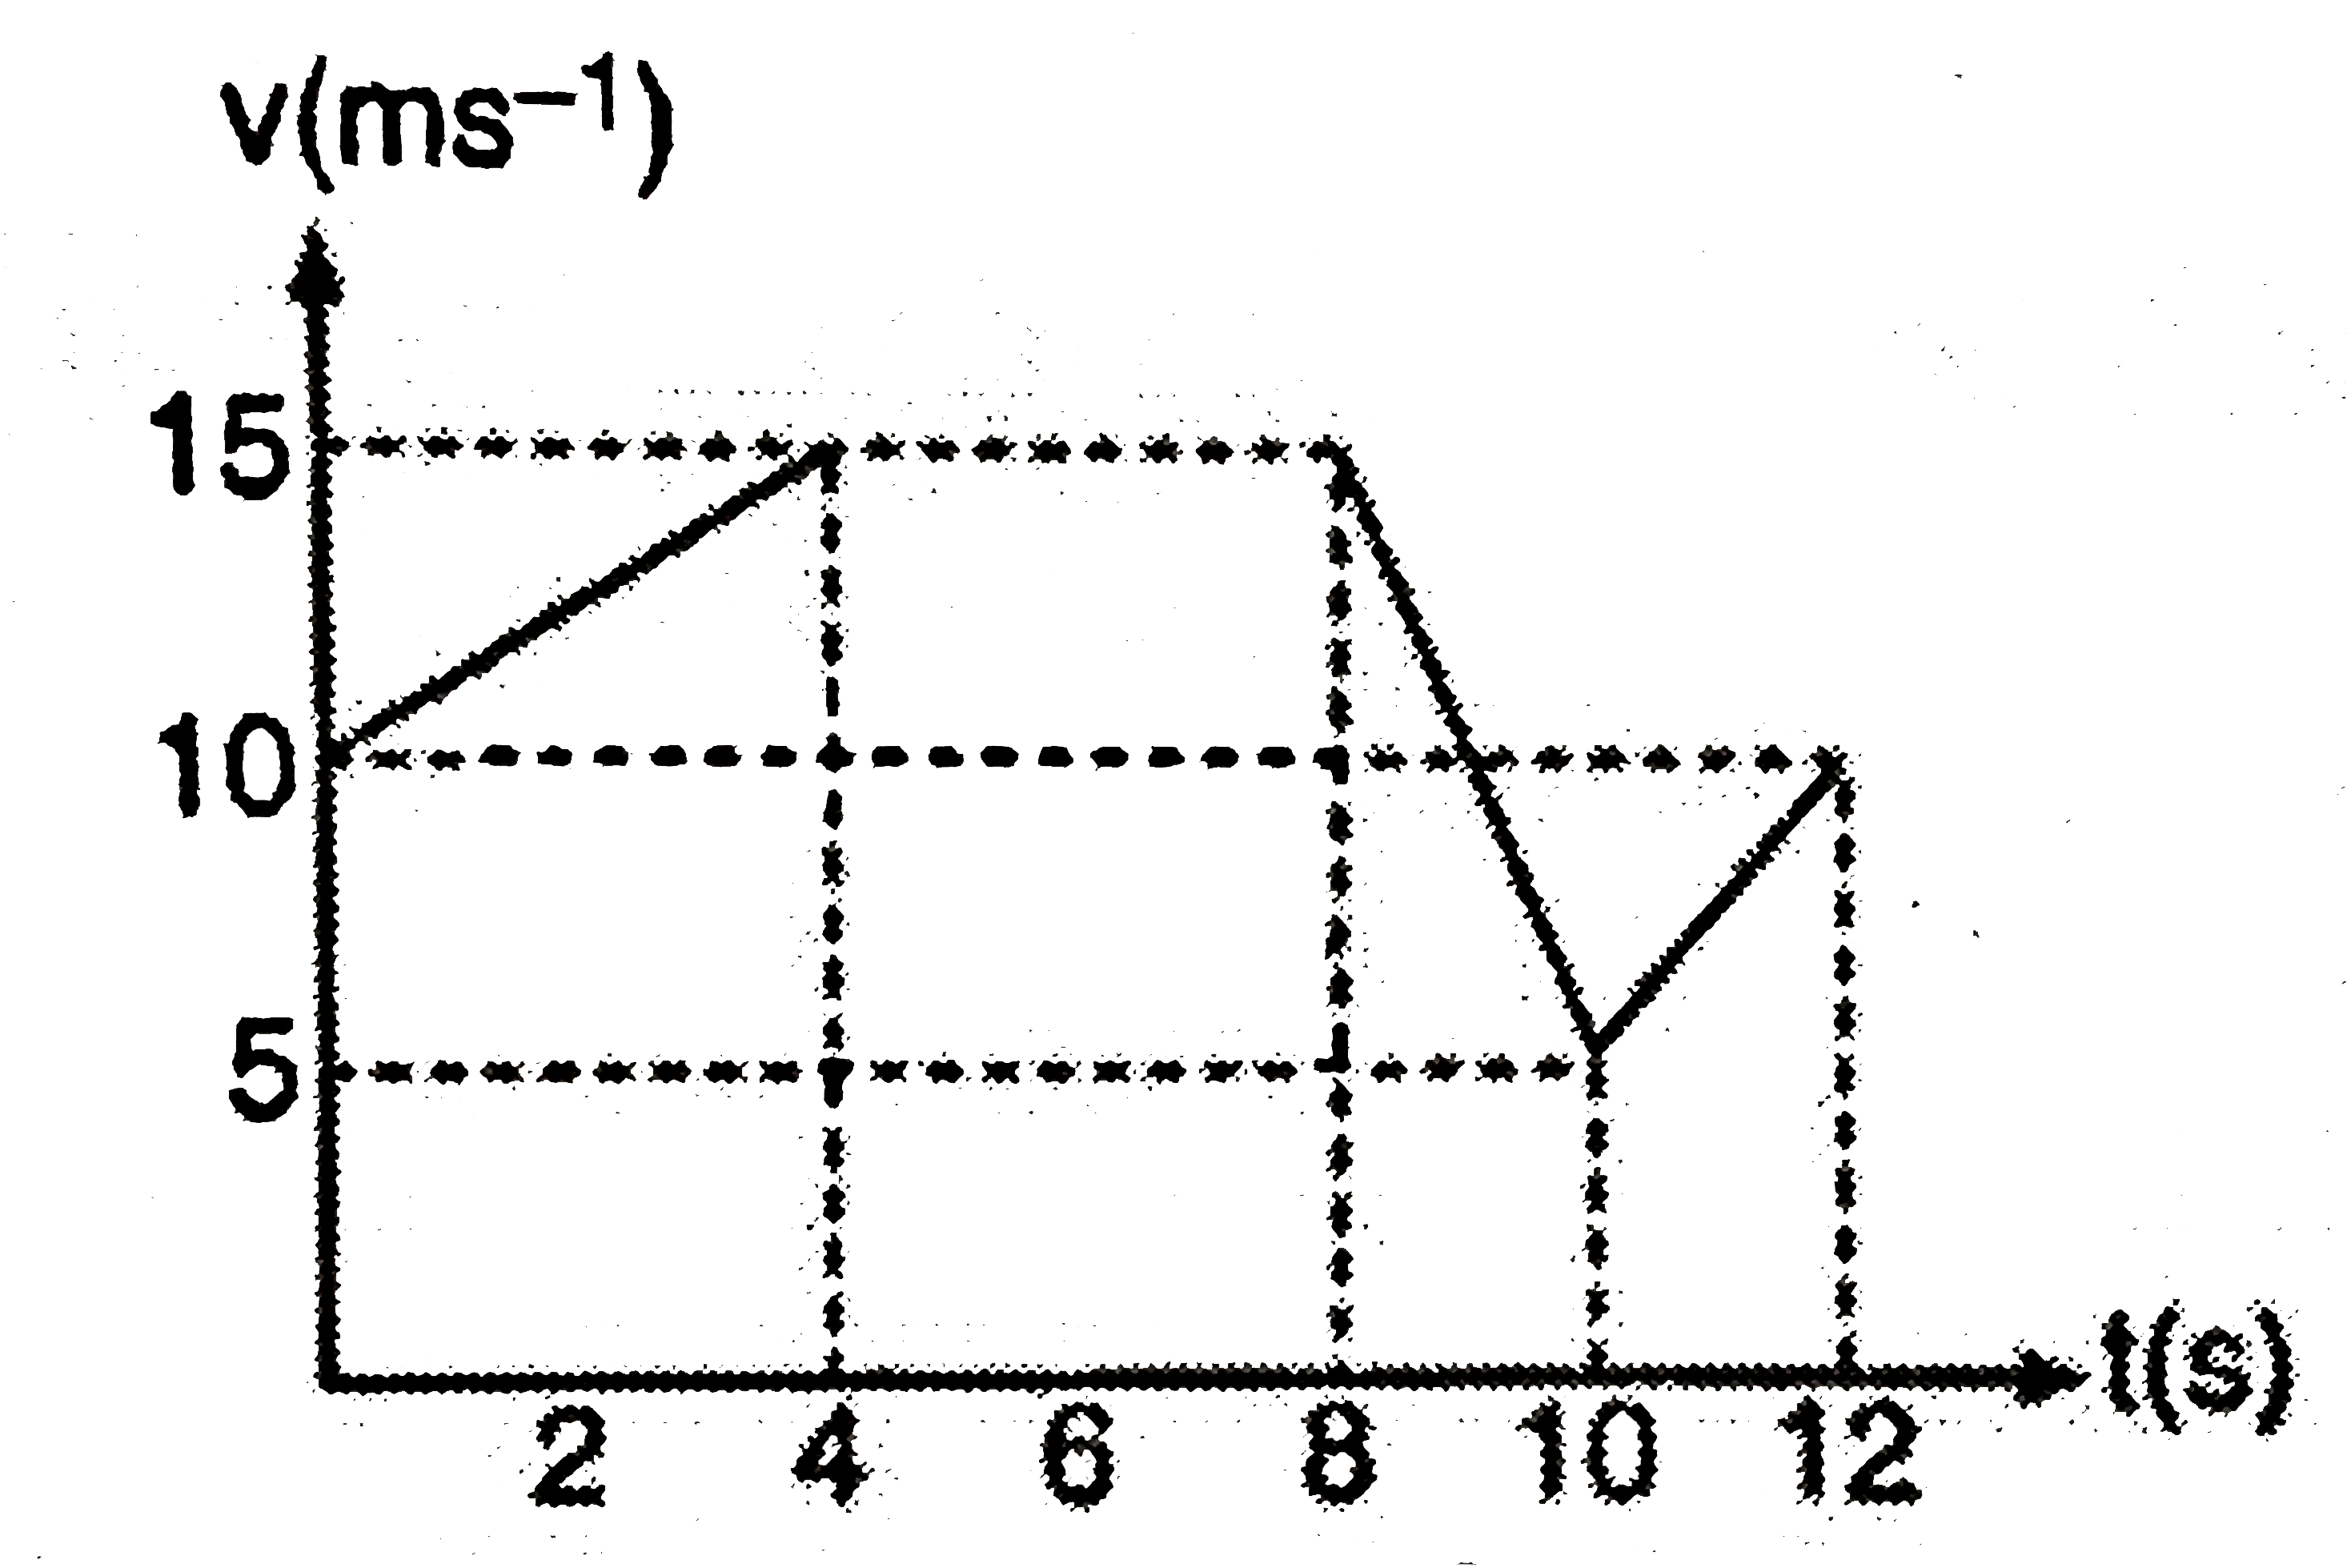
View SolutionThe position (x) - time (t) graph for a particle moving along a straight line is shown in figure. The average speed of particle in time interval t = 0 to t = 8 s is
View Solution

