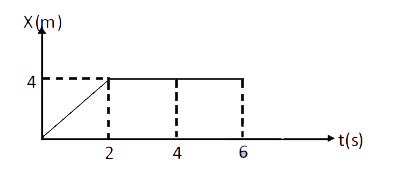
For a particle moving in a straight line, the position-time graph is as shown in the figure. Find the velocity of the particle at time t=1s and t=4s. Also sketch the v-t graph.
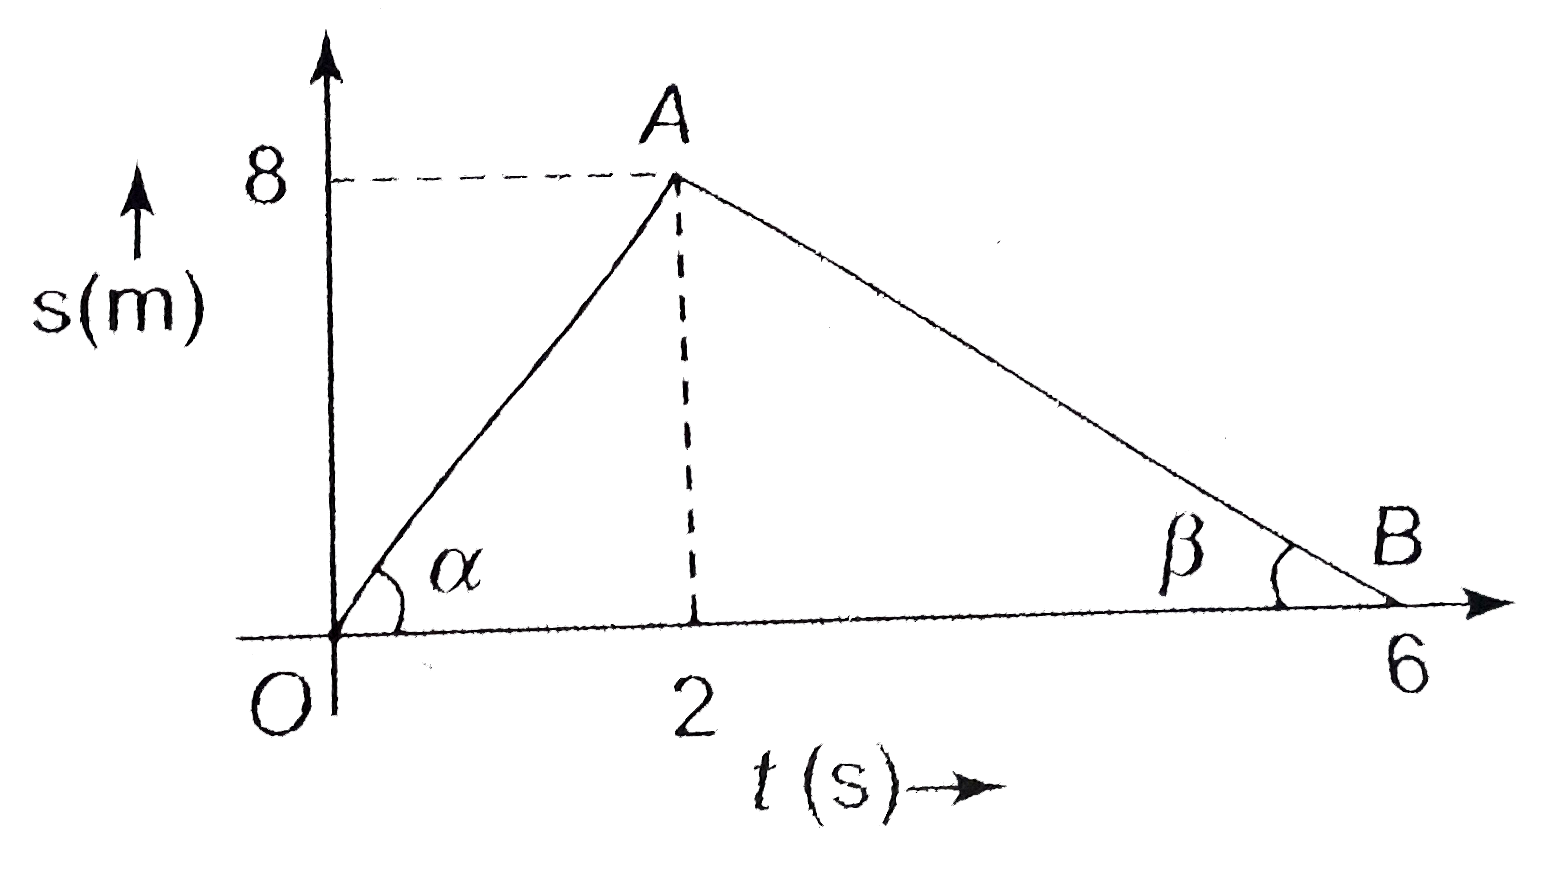
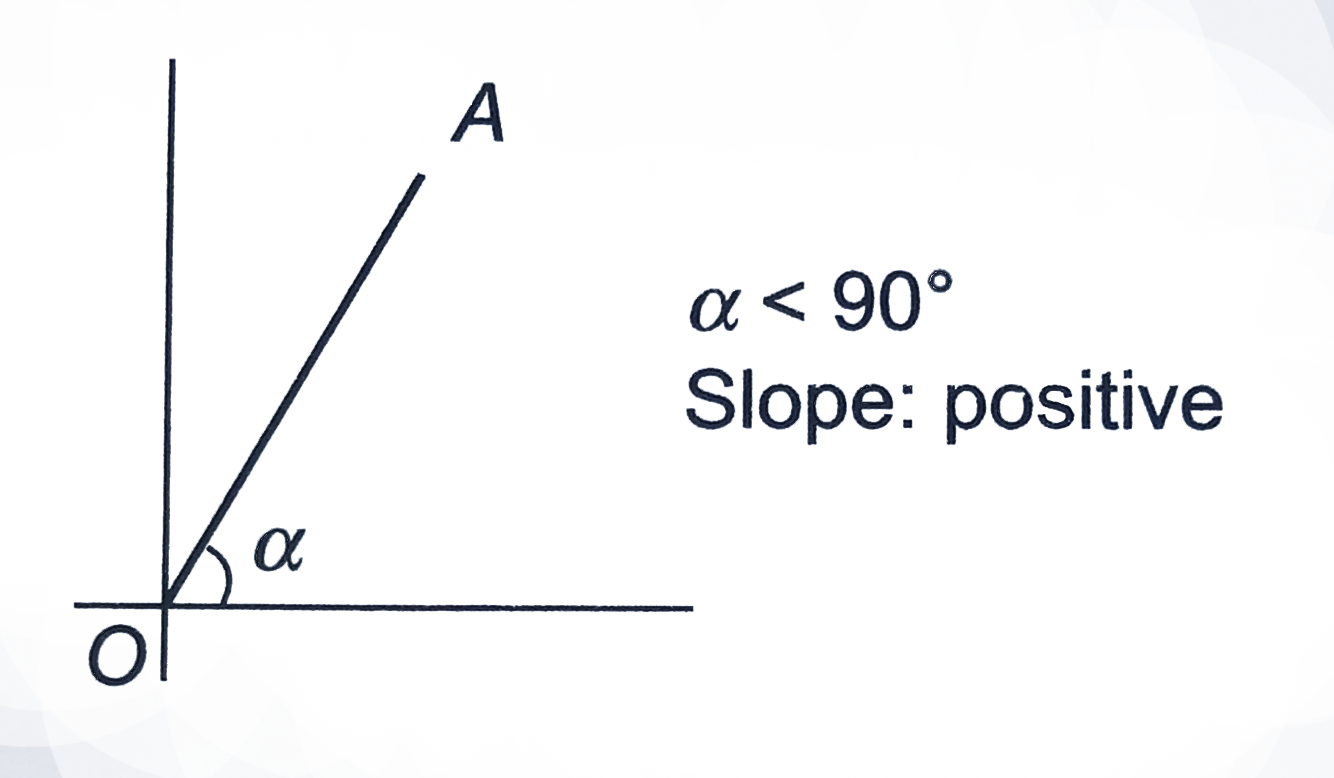
OA:t=0 to t=2s
Slope=tanα=82=4
Velocity=4m/s
AB:t=2 to 6s
Slope=−tanβ=−84=−2
Velocity =−2m/s
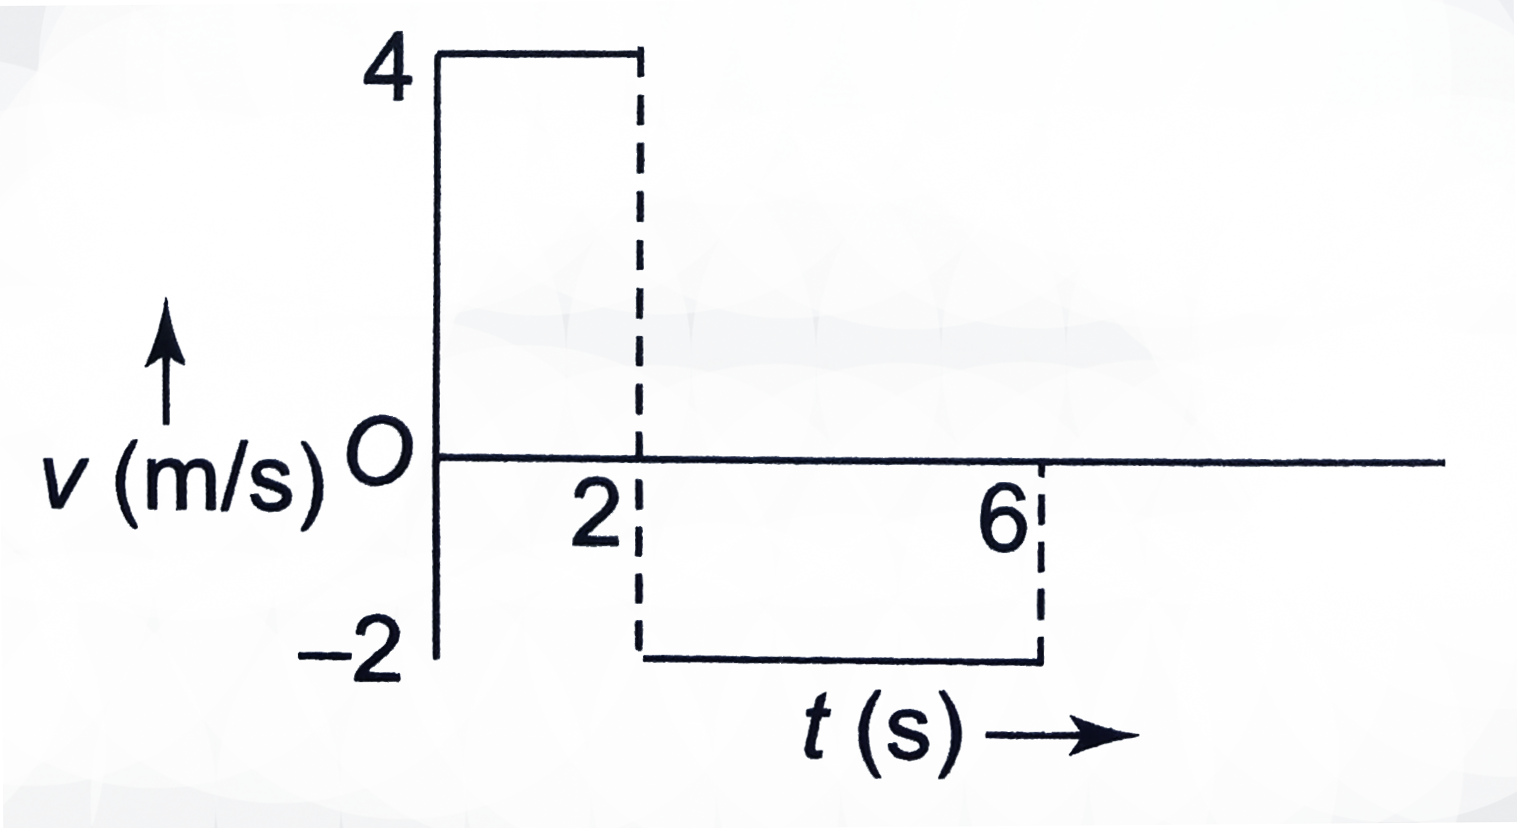
For v-t graph:
t=0 to t=2s,v=4m/s
t=2 to 6s,v=−2m/s
Topper's Solved these Questions
Similar Questions
The displacement-time graph for a particle moving in a straight line is as shown in the figure. Determine the velocity of the particle at t=1s,3s and 6s. Sketch the velocity-time graph.
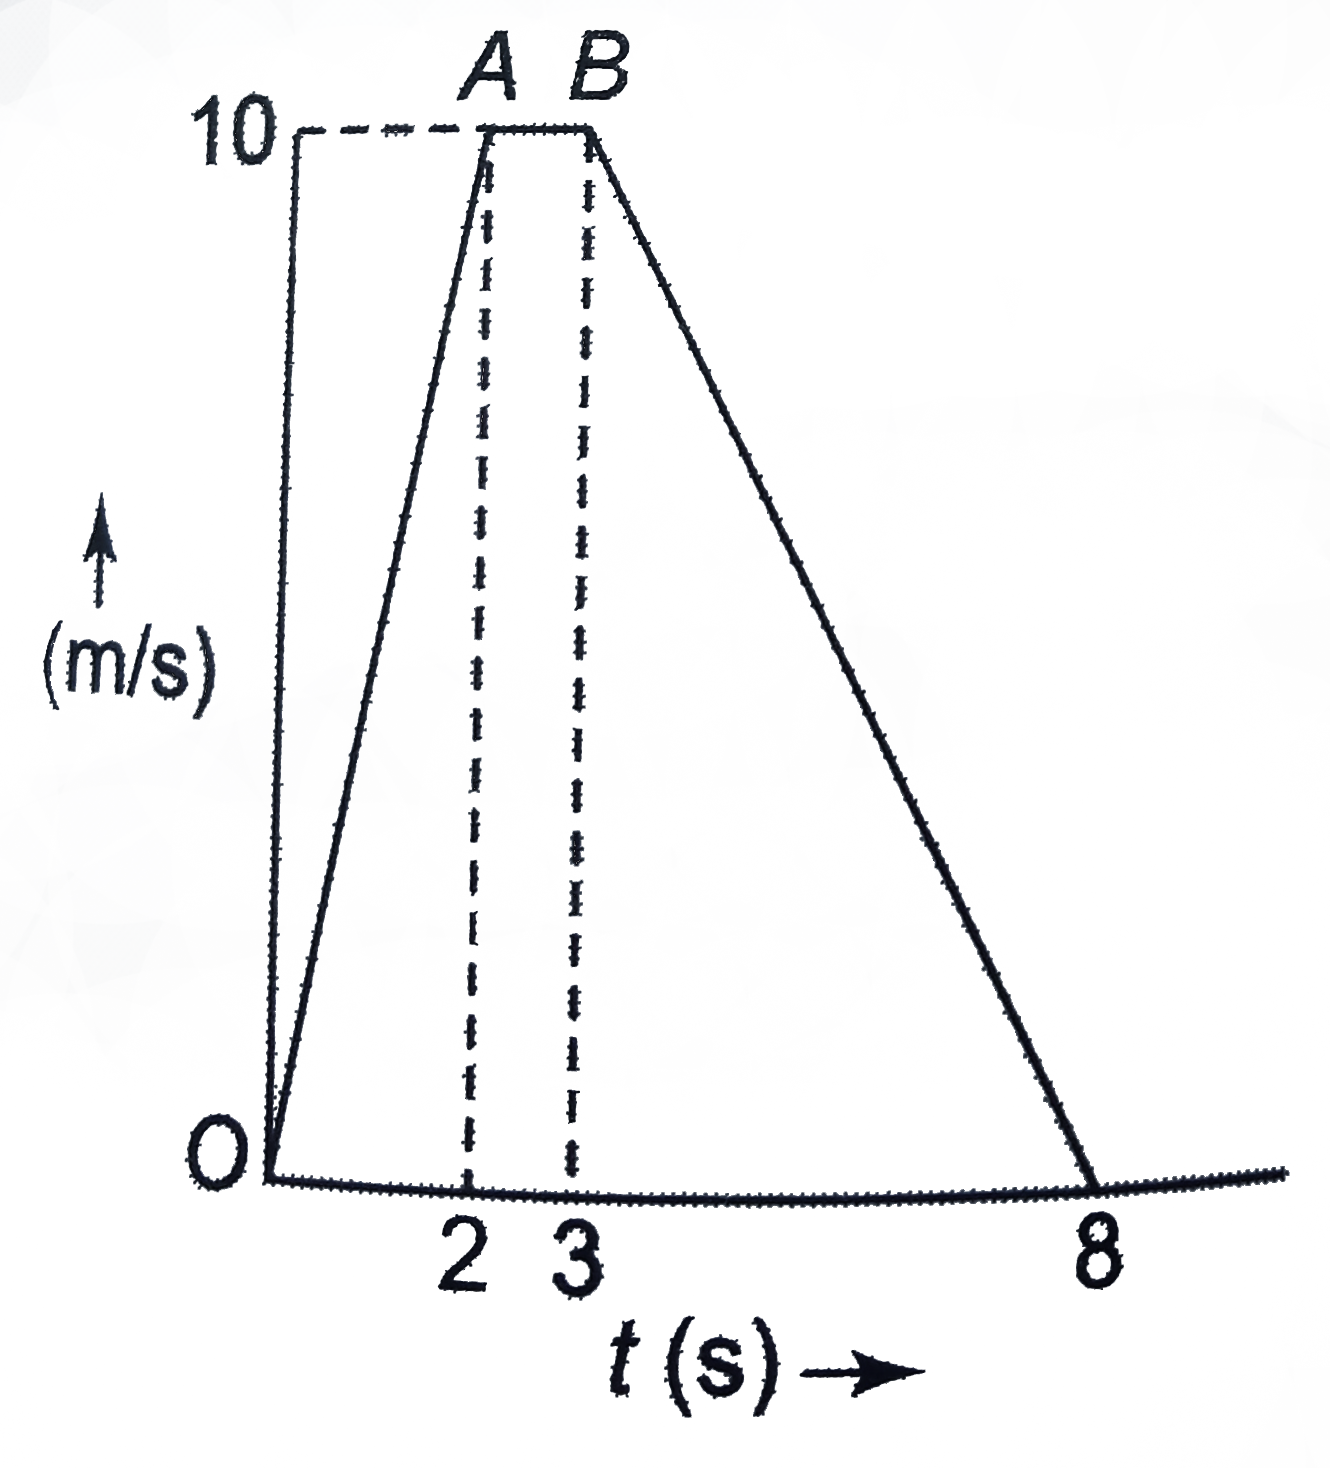
View SolutionFor a particle moving in a straight line, the velocity-time graph is as shown in the figure. Find the acceleration at time t=1s2.5s and 5s. Sketch the acceleration time graph.
View Solution
Knowledge Check
The velocity -time (v−t) graph of a particle moving in a straight line is shown in figure. The acceleration of the particle at t=9 is:
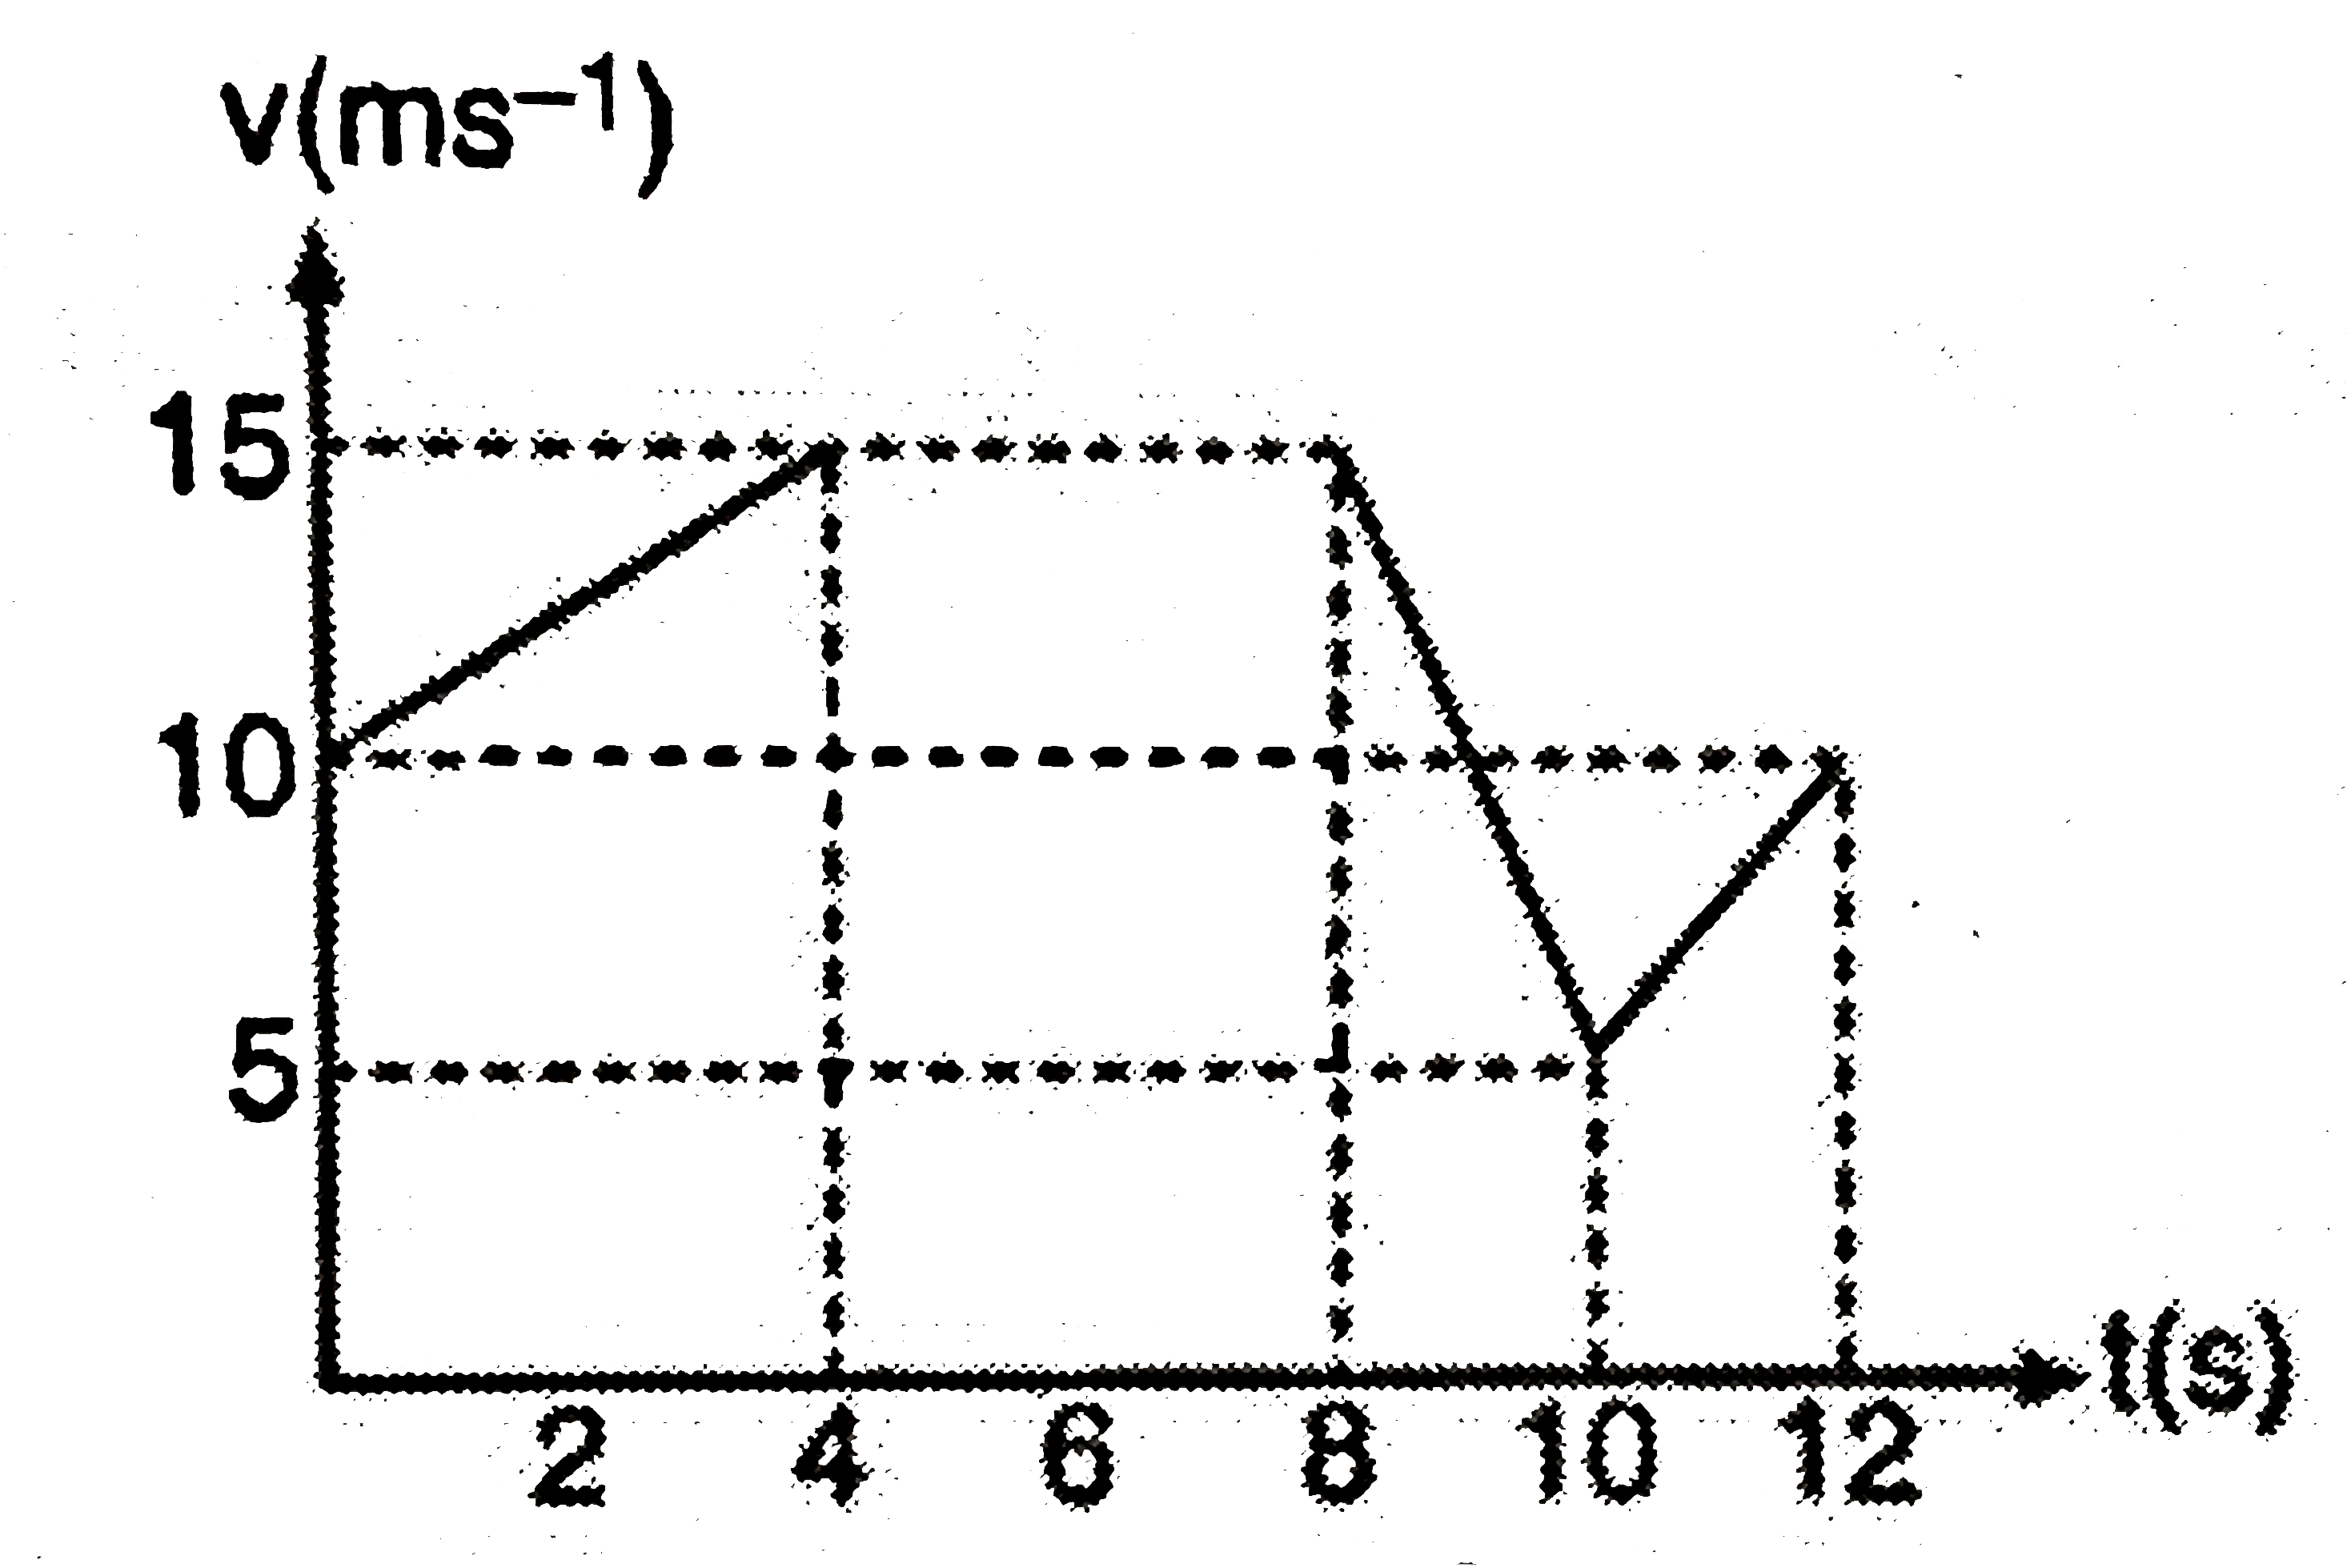 AzeroB5ms−2C−5ms2D−2ms−2
The acceleration-time graph of a particle moving in a straight line is as shown in figure. The velocity of the particle at time t=0 is 2m/s. The velocity after 2 seconds will be
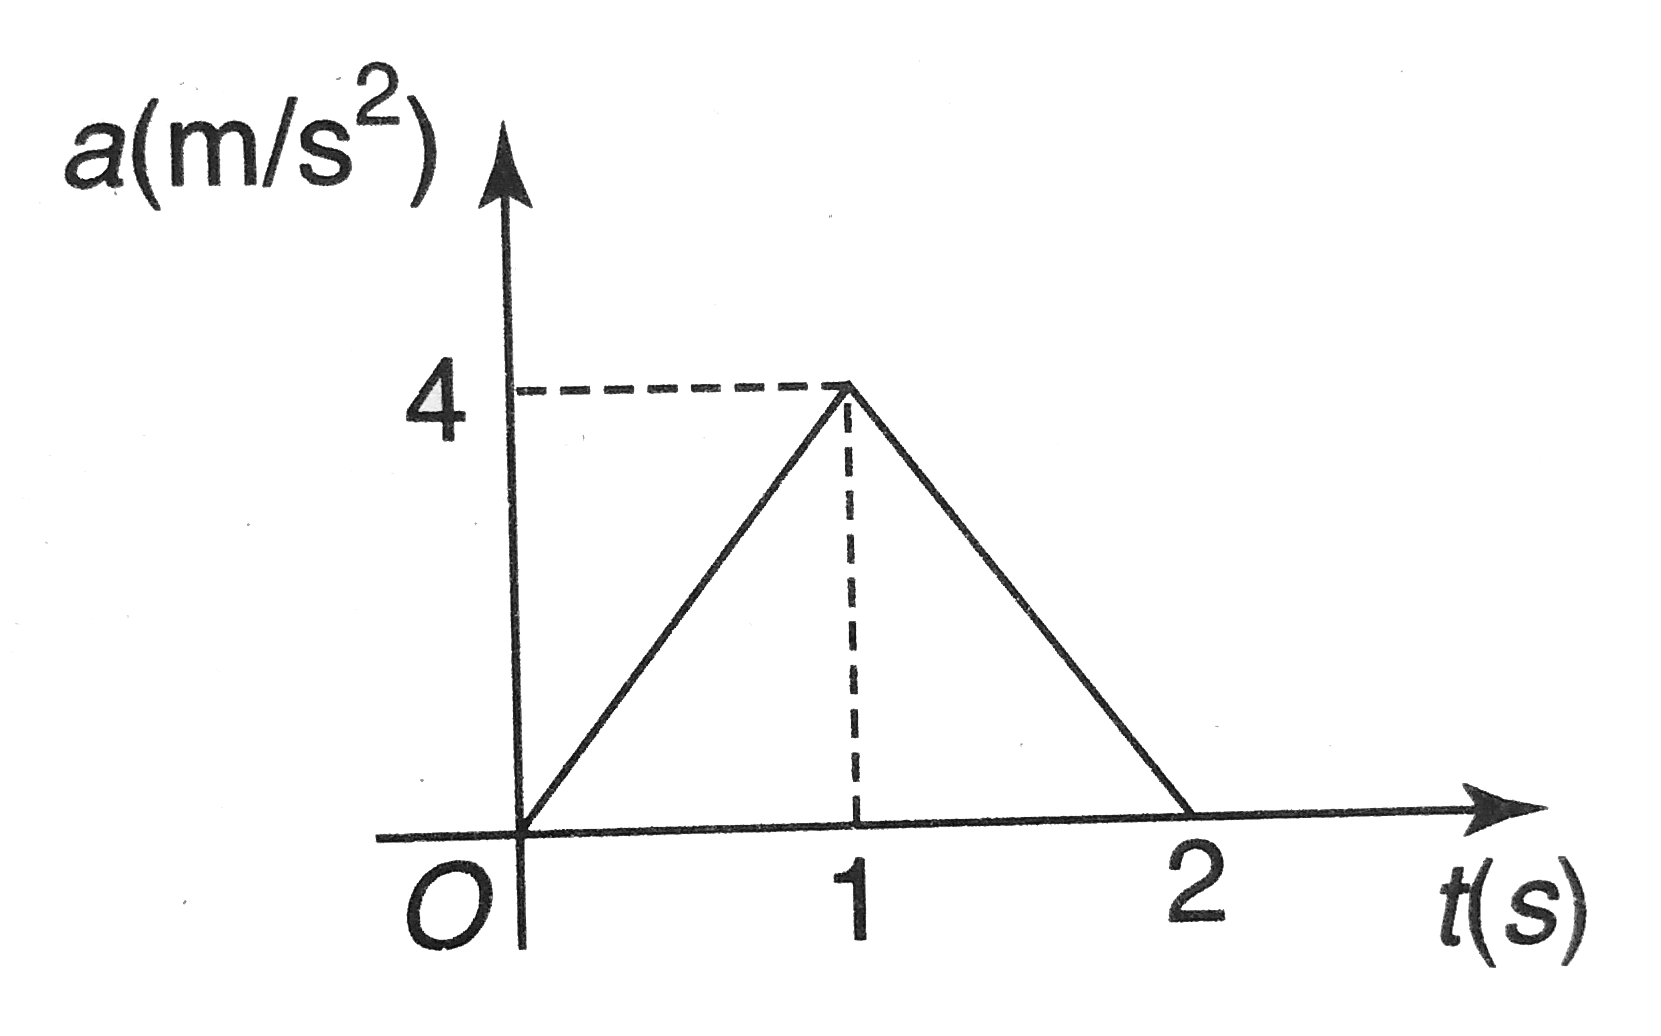 A6m/sB4m/sC2m/sD8m/s
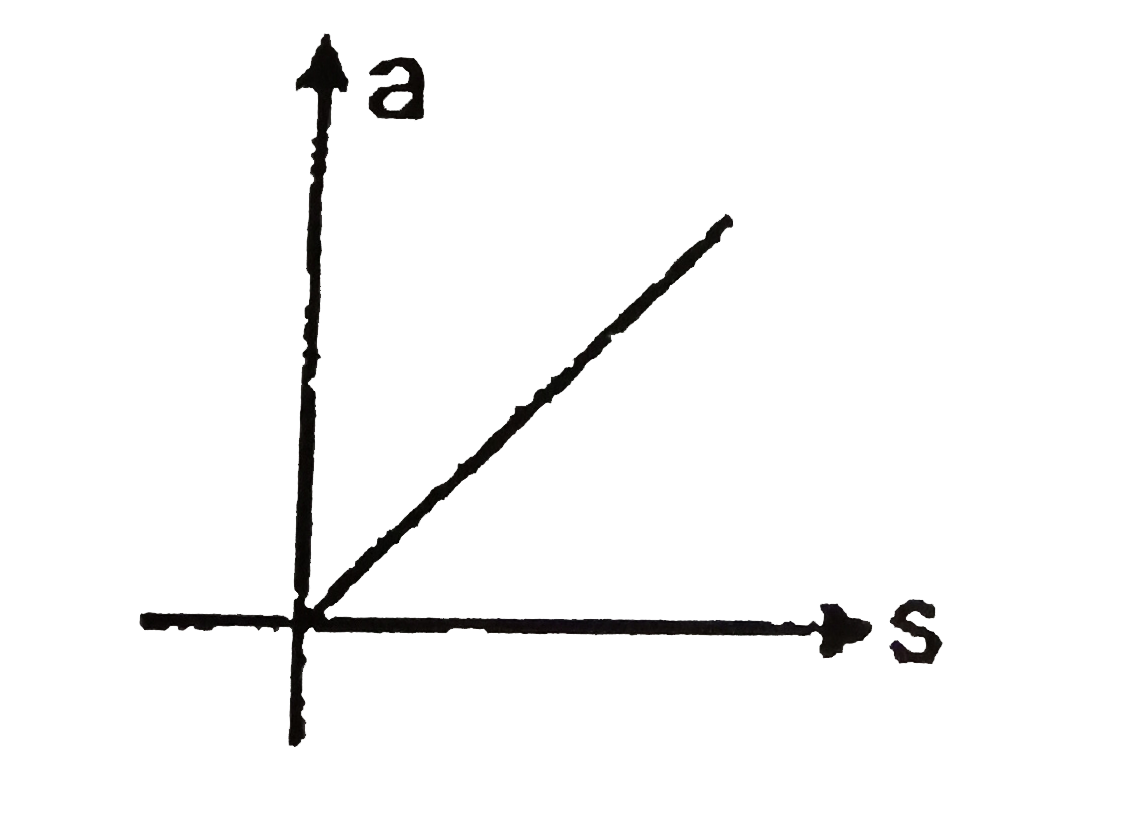
Acceleration (a) -displacement (s) graph of a particle moving in a straight line is as shown in the figure. The initial velocity of the particle is zero. The v−s graph of the particle would be
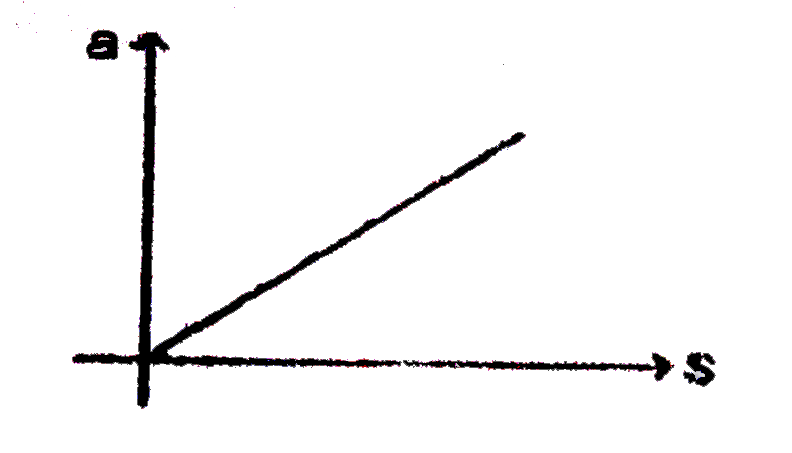 A
A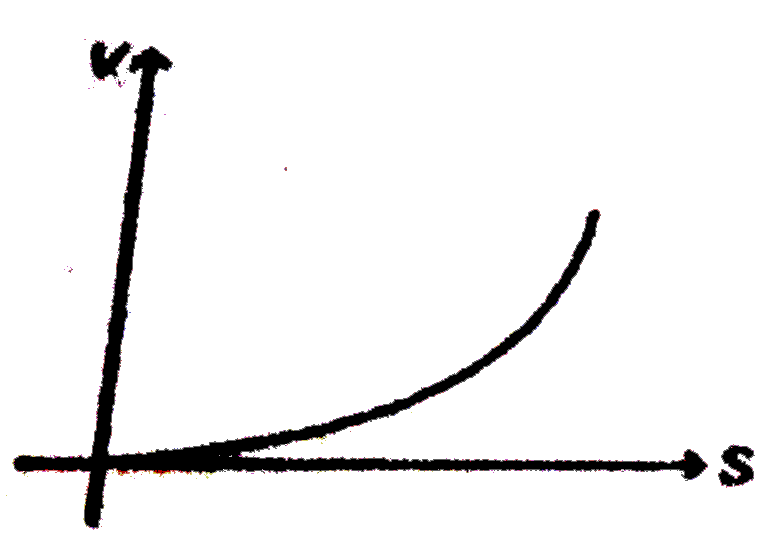 B
B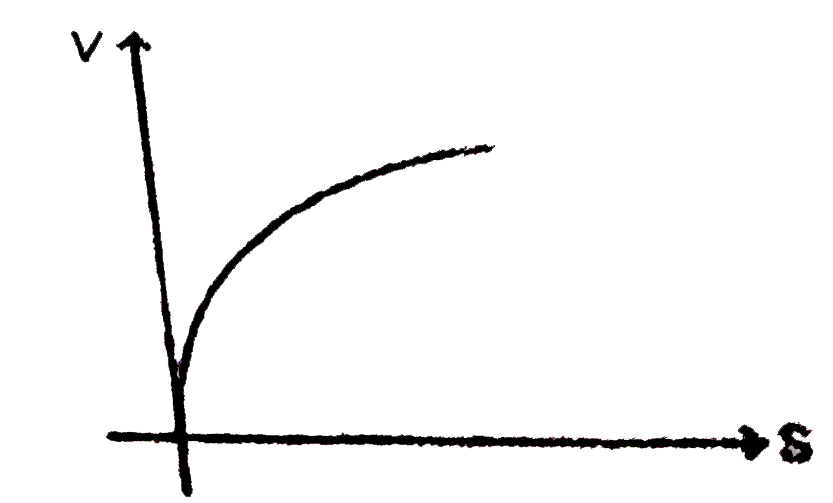 C
C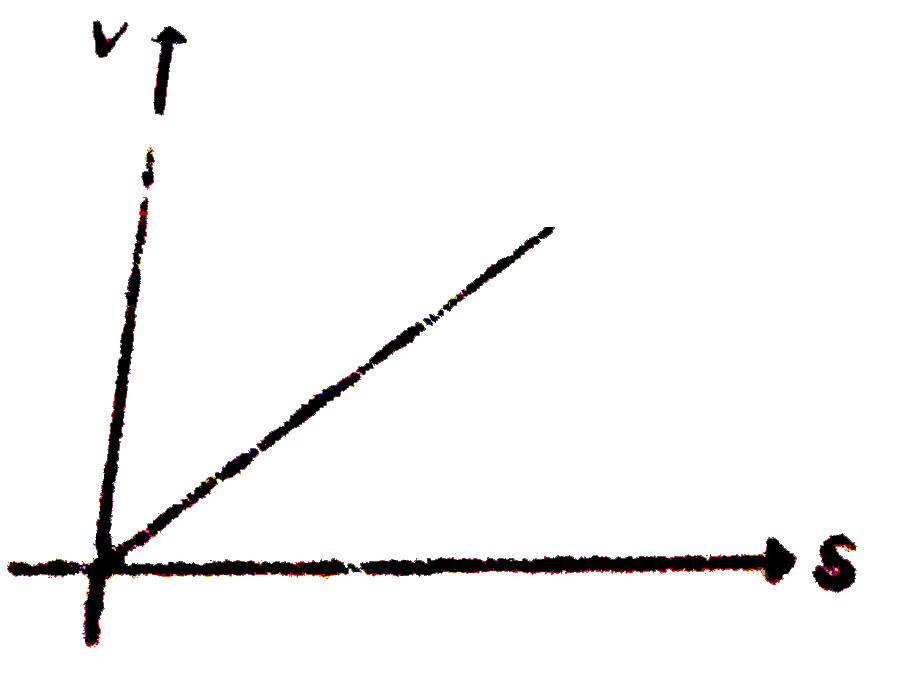 D
D
A particle is moving in a straight line and its acceleration-time graph is shown below. At t=0, the particle is at rest. Find the velocity of the particle at t=3s,6s and 8s. Also sketch the v-s graph.
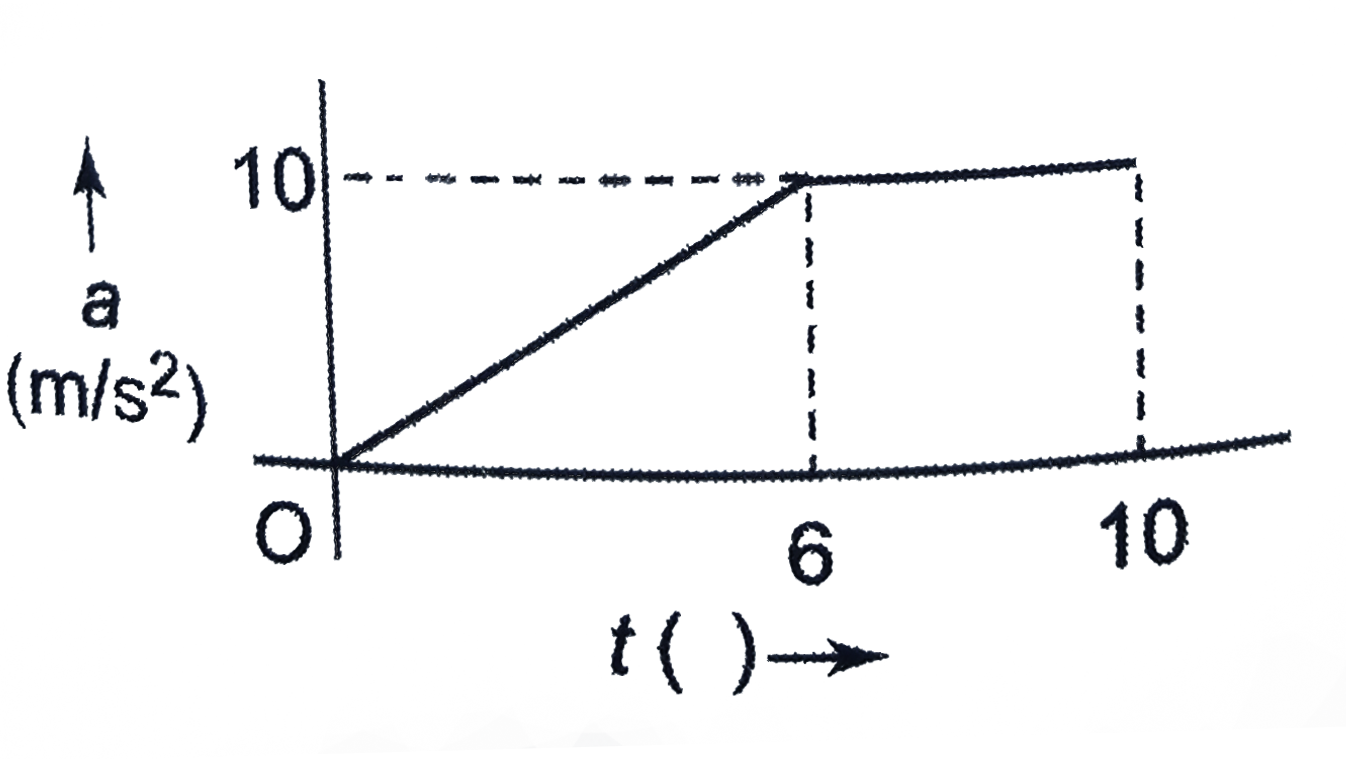
View SolutionA particle starts motion from rest and moves along a straight line. Its acceleration-time graph is shown. Find out speed of particle at t=2s and at t=3s.
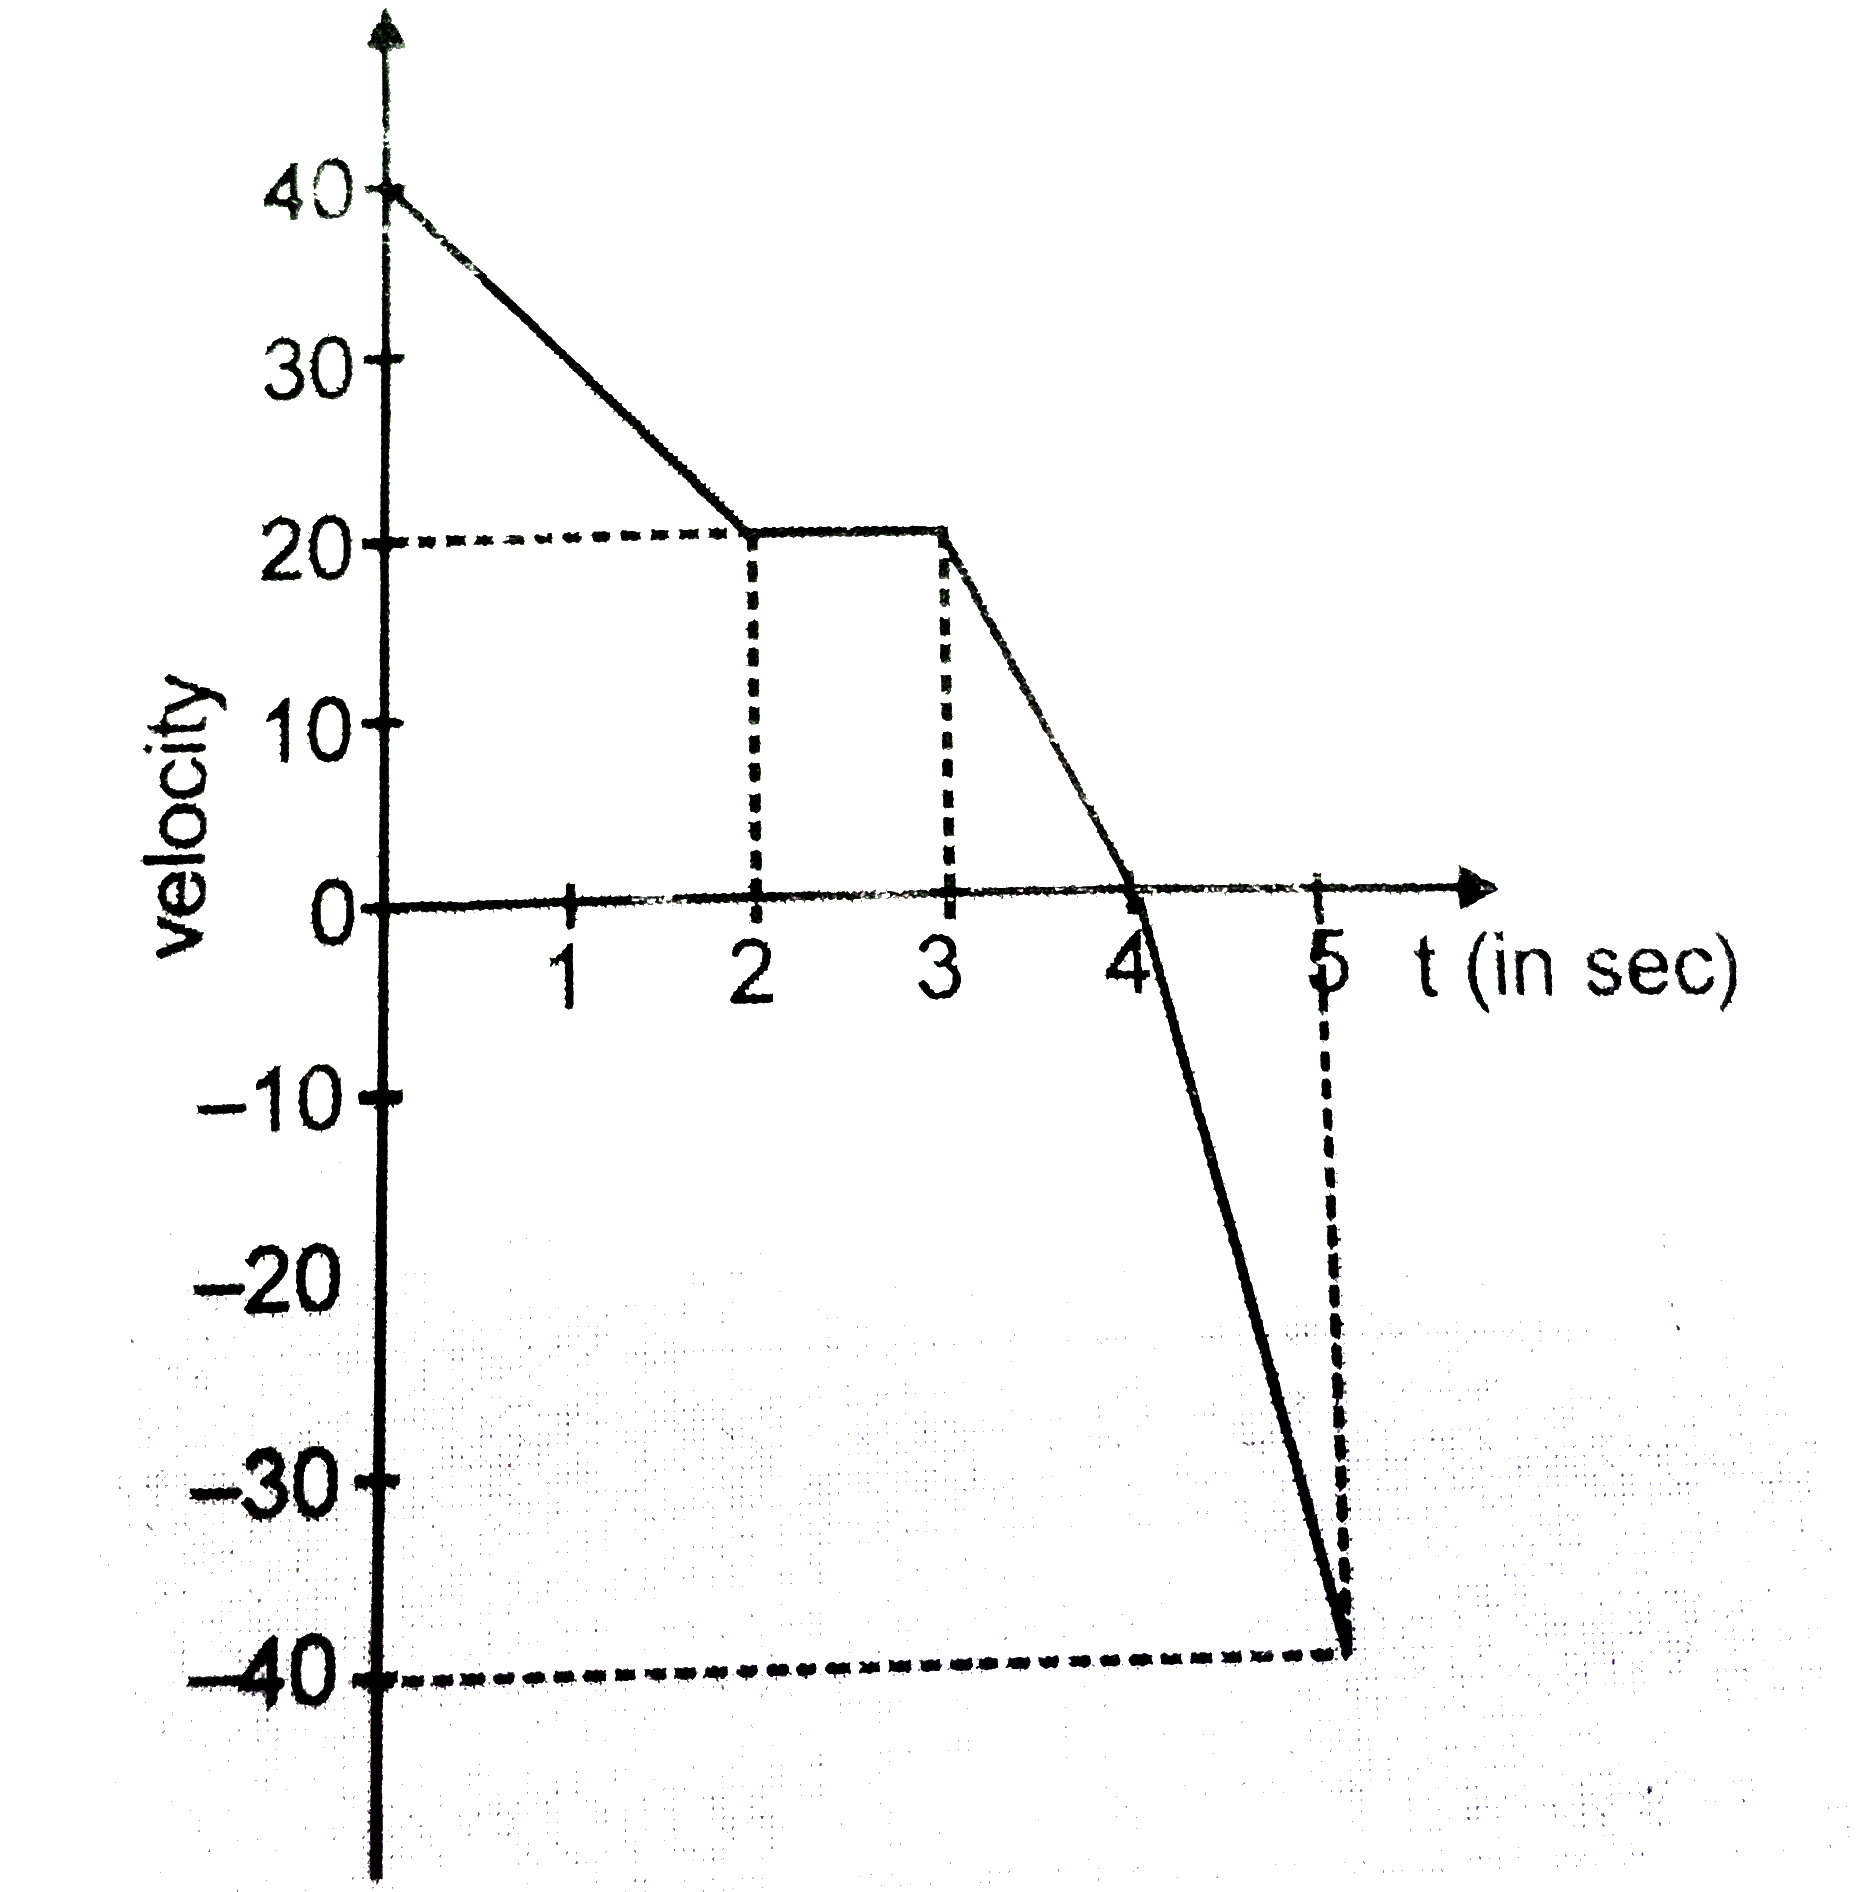
View SolutionThe position-time graph of a particle of mass 0.1 kg is shown. The impulse at t = 2s is :
View SolutionAcceleration v/s displacement graph of a particle moving in a straight line is as shown in the figure. The initial velocity of the particle is zero. The velocity v/s displacement graph of the particle would be :
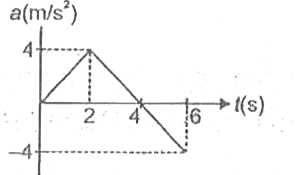
View SolutionFor the acceleration - time (a - t) graph shown in figure, the change in velocity of particle from t = 0 to t = 6 s is
View Solution

