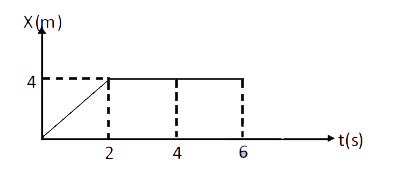
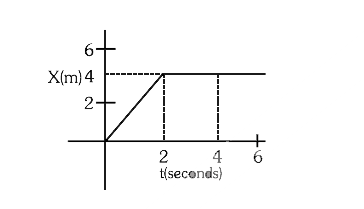
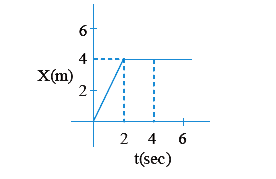
The position-time graph of a particle of mass 0.1 kg is shown. The impulse at t = 2s is :
0.2kgms−1
0.02kgms−1
0.1kgms−1
0.4kgms−1
The correct Answer is:A
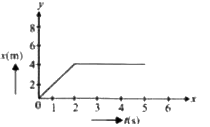
From the graph it is clear that upto t=2.0 s, the body moves with a constant velocity = slope of positiin - time graph =42=2 m/s after t=2.0s position - time graph is parallel to time axis , which means that the body comes to rest
∴ change in velocity =Δv=2m/s
impulse = change in momentum
=Δp=mΔv=0.1kg×2ms−1=0.2ms−1
Topper's Solved these Questions
- LAWS OF MOTIONBook:MTG GUIDEChapter:LAWS OF MOTIONExercise:NEET CAFÉ (TOPICWISE PRACTIVE QUESTIONS) (LAW OF CONSERVATION OF LINEAR MOMENTUM AND ITS APPLICATIONS)
Explore 6 Videos
- LAWS OF MOTIONBook:MTG GUIDEChapter:LAWS OF MOTIONExercise:NEET CAFÉ (TOPICWISE PRACTIVE QUESTIONS) (EQUILIBRIUM OF CONCURRENT FORCES)
Explore 7 Videos
- LAWS OF MOTIONBook:MTG GUIDEChapter:LAWS OF MOTIONExercise:AIPMT /NEET (MCQ)
Explore 24 Videos
- KINEMATICS Book:MTG GUIDEChapter:KINEMATICS Exercise:AIPMT/ NEET MCQs
Explore 31 Videos
- MOTION OF SYSTEM OF PARTICLES AND RIGID BODY Book:MTG GUIDEChapter:MOTION OF SYSTEM OF PARTICLES AND RIGID BODY Exercise:AIPMT / NEET (MCQs)
Explore 37 Videos
Similar Questions
Knowledge Check
In the figure given below, the position-time graph of a particle of mass 0.1kg is shown. The impuslse at t=2 sec is
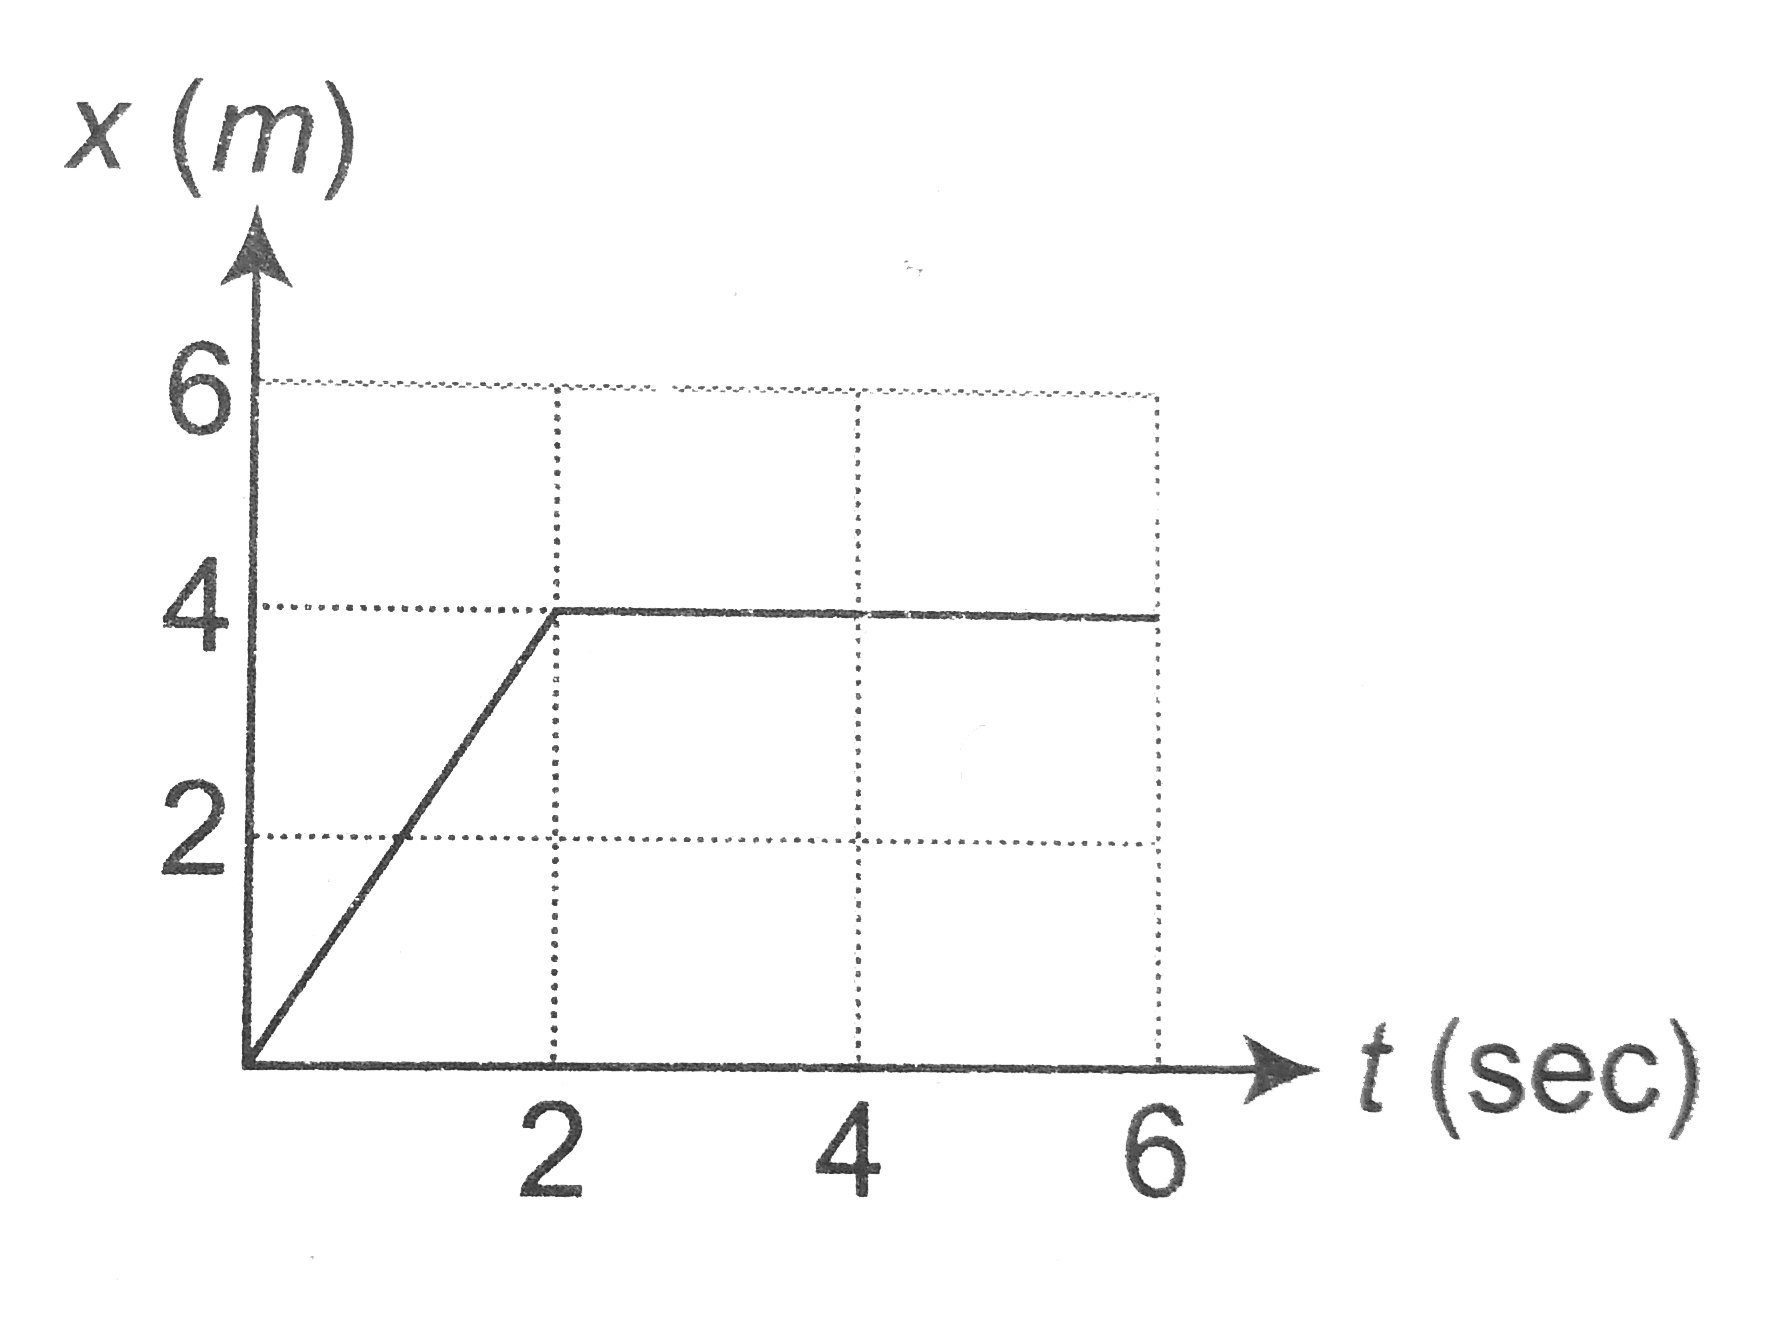 A0.2kgm/secB−0.2kgm/secC−0.1kgm/secD−0.4kgm/sec
In the figure given below, the position time graph of a particle of mass 0.1kg is shown. The impulse at t=2 sec is
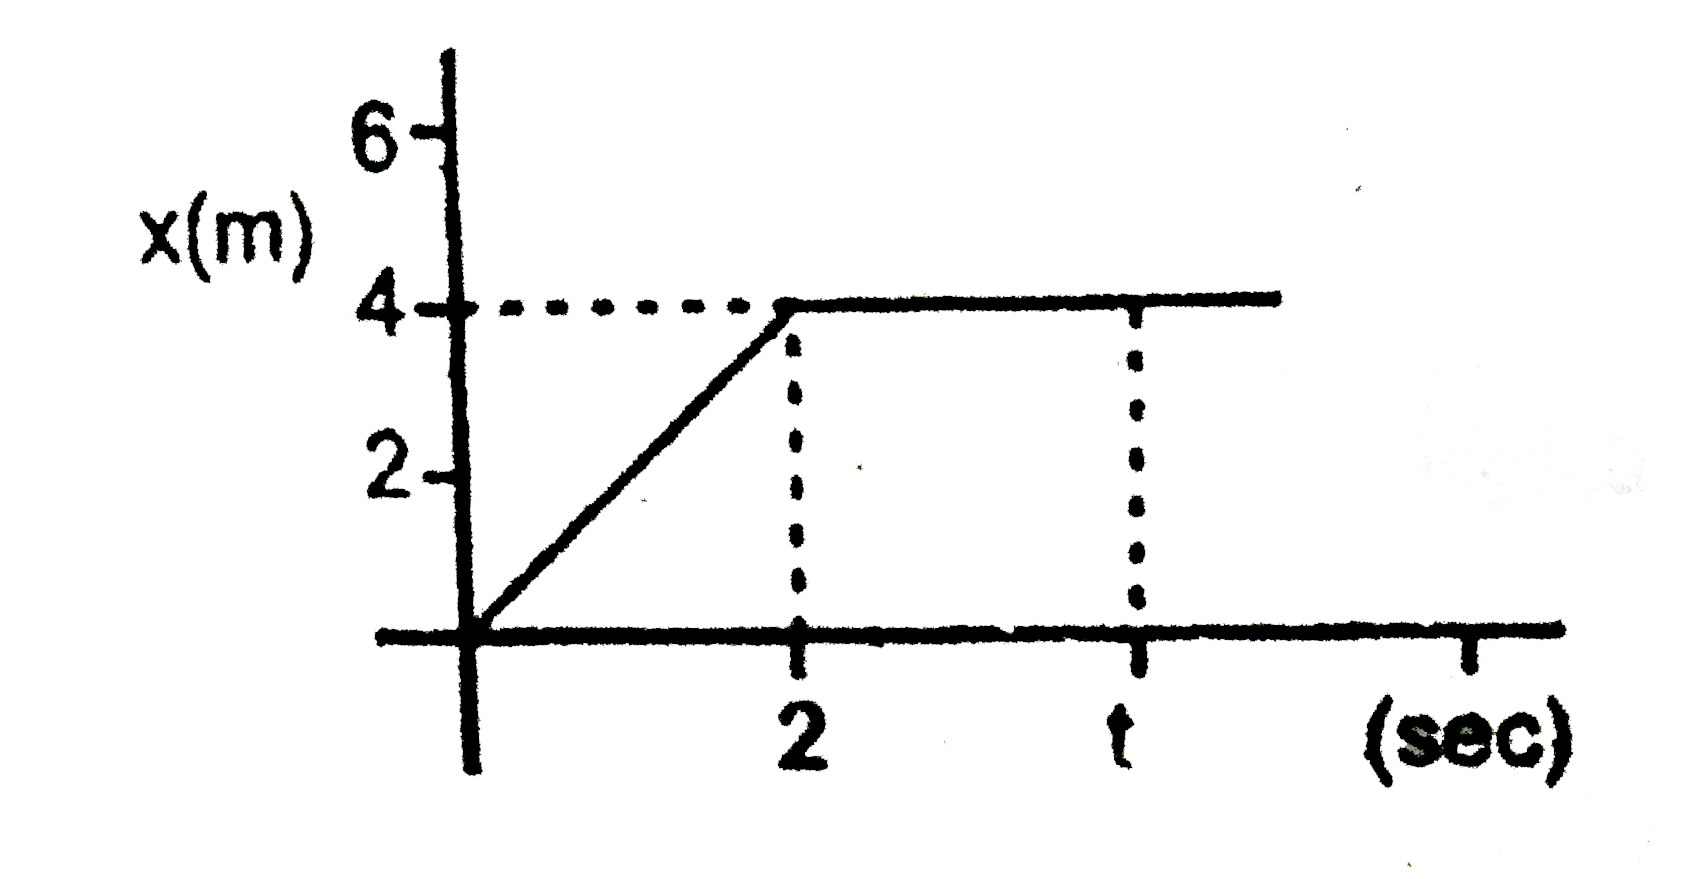 A0.2gkm/secB−0.2kgmsec−1C0.1kgmsec−1D−0.1kgm/sec
In the figure given below, the position–time graph of a particle of mass 0·1 kg is shown. The impulse at t=2sec is
 A0⋅2 kgmsec −1B−0⋅2 kgmsec −1C0⋅1 kgmsec −1D−0⋅4 kgmsec −1
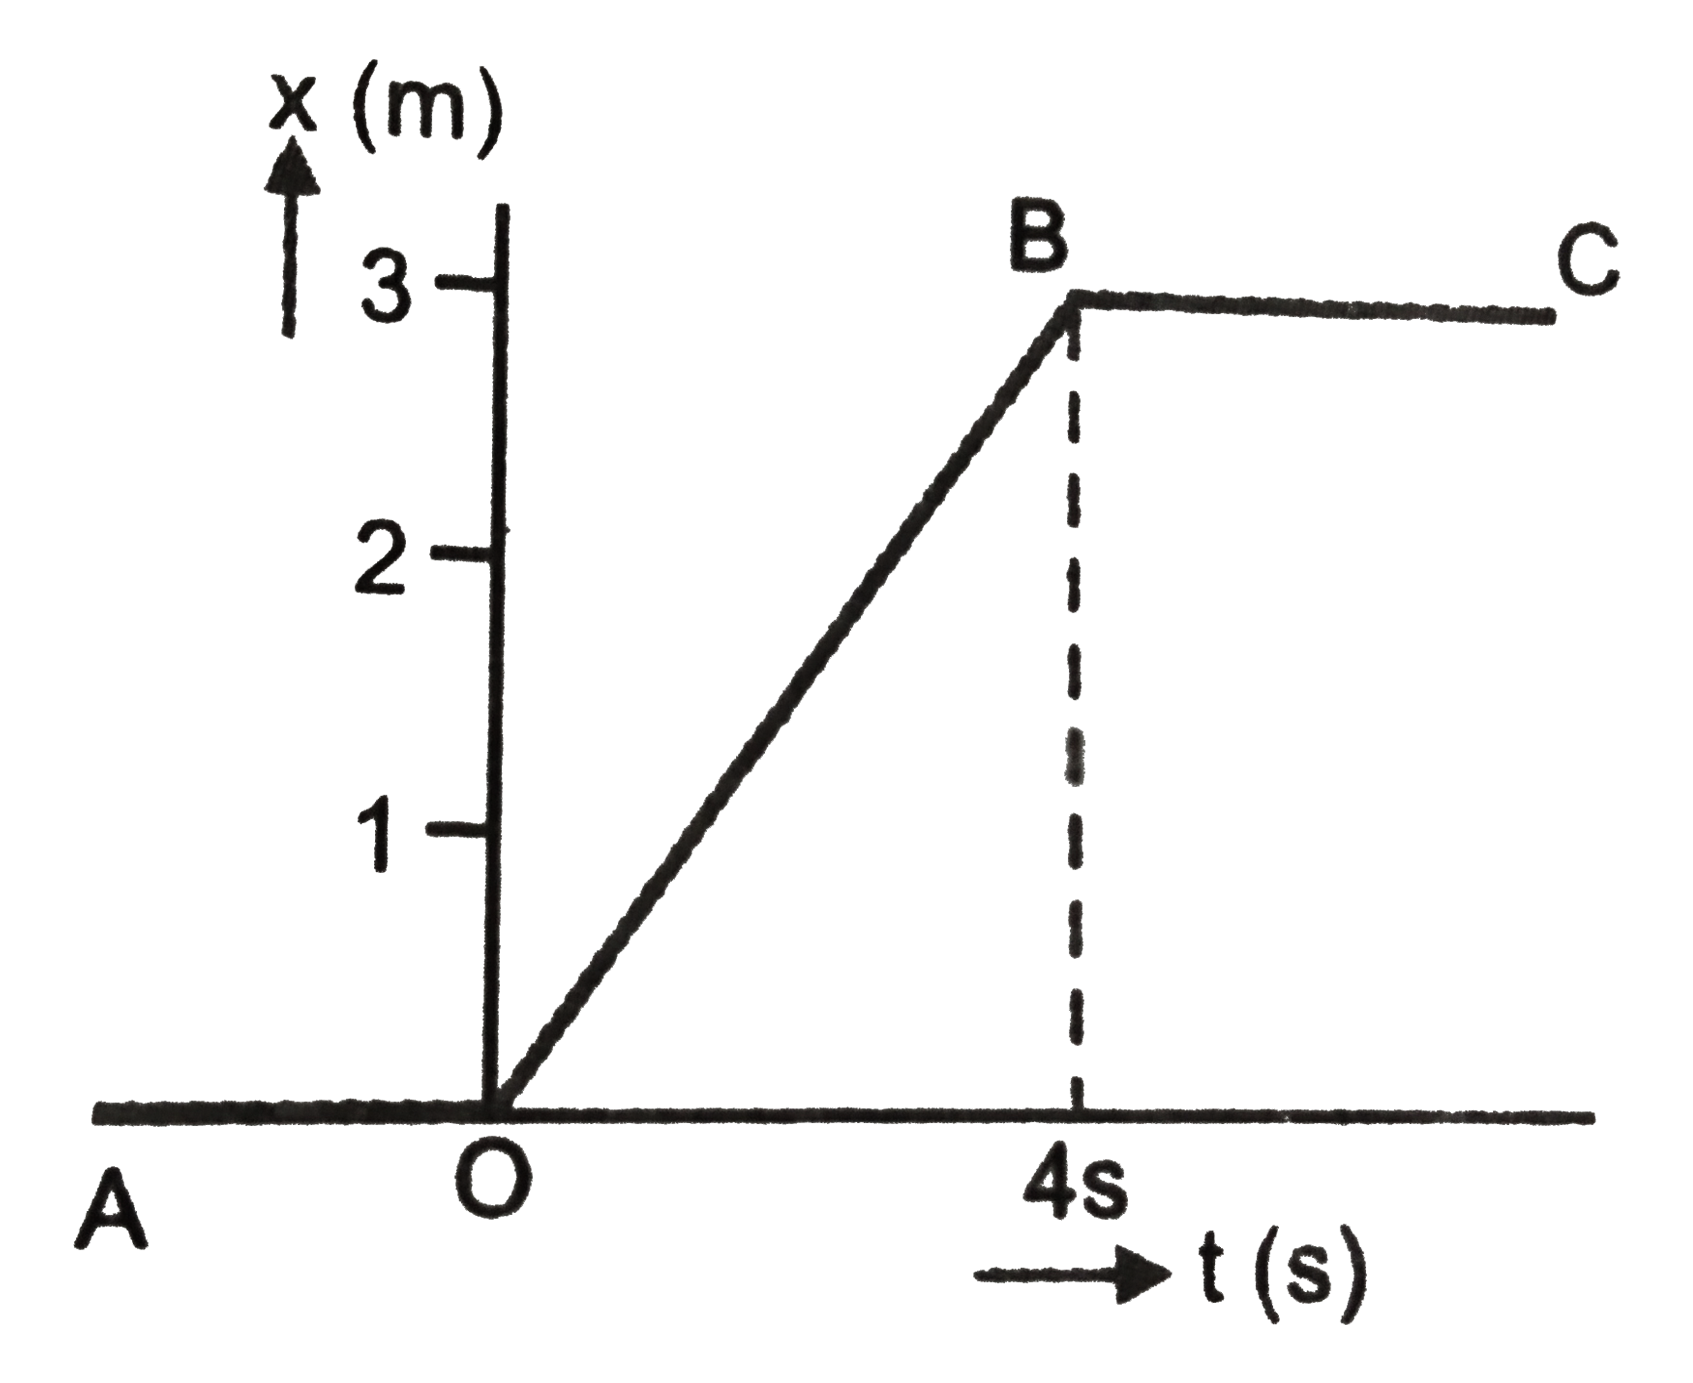
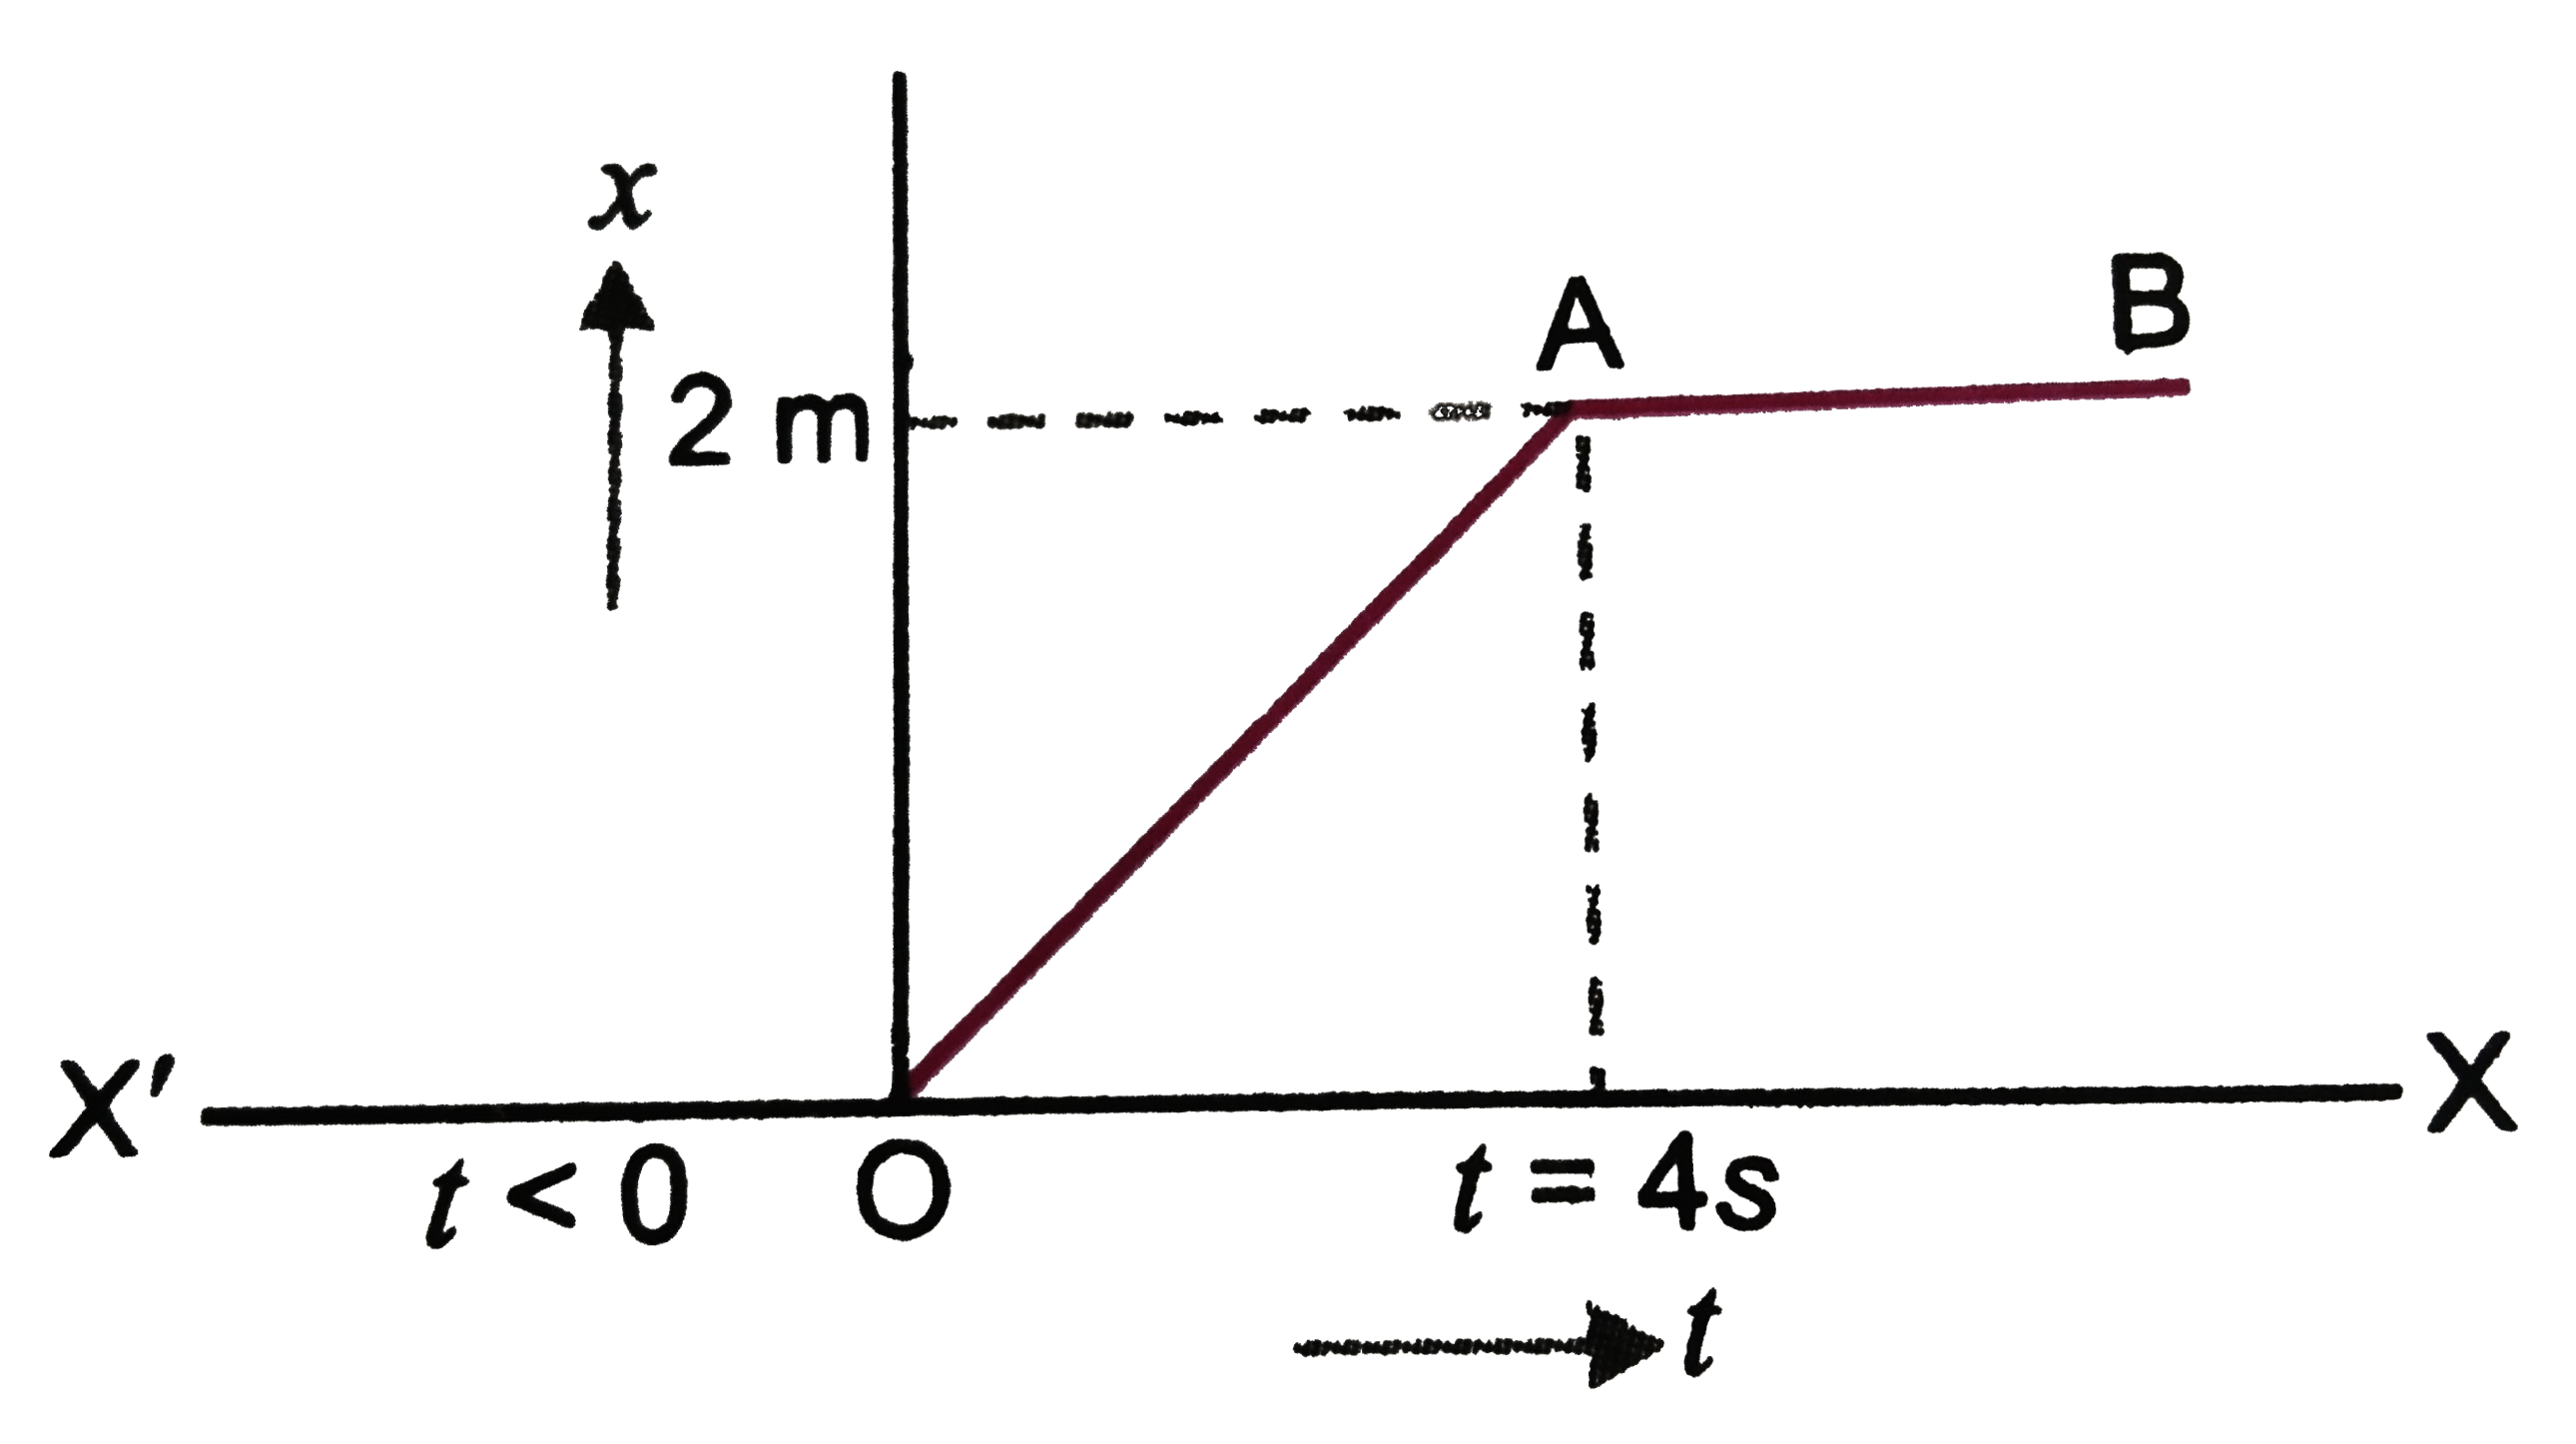
Fig. shows the position-time graph of a particle of mass 4 kg. What is the (i) force acting on the particle for t<0,t<4s,0<t<4s? (ii) impulse at t = 0 and t = 4 s? Assume that the motion is one dimensional.
View SolutionShown the position time graph of a particle of mass 4 kg What is the force on the particle for t<0,0<t<4s motion only
 .
.
View SolutionThe position-time graph of a particle of mass 0.1 kg is shown. The impulse at t = 2s is :

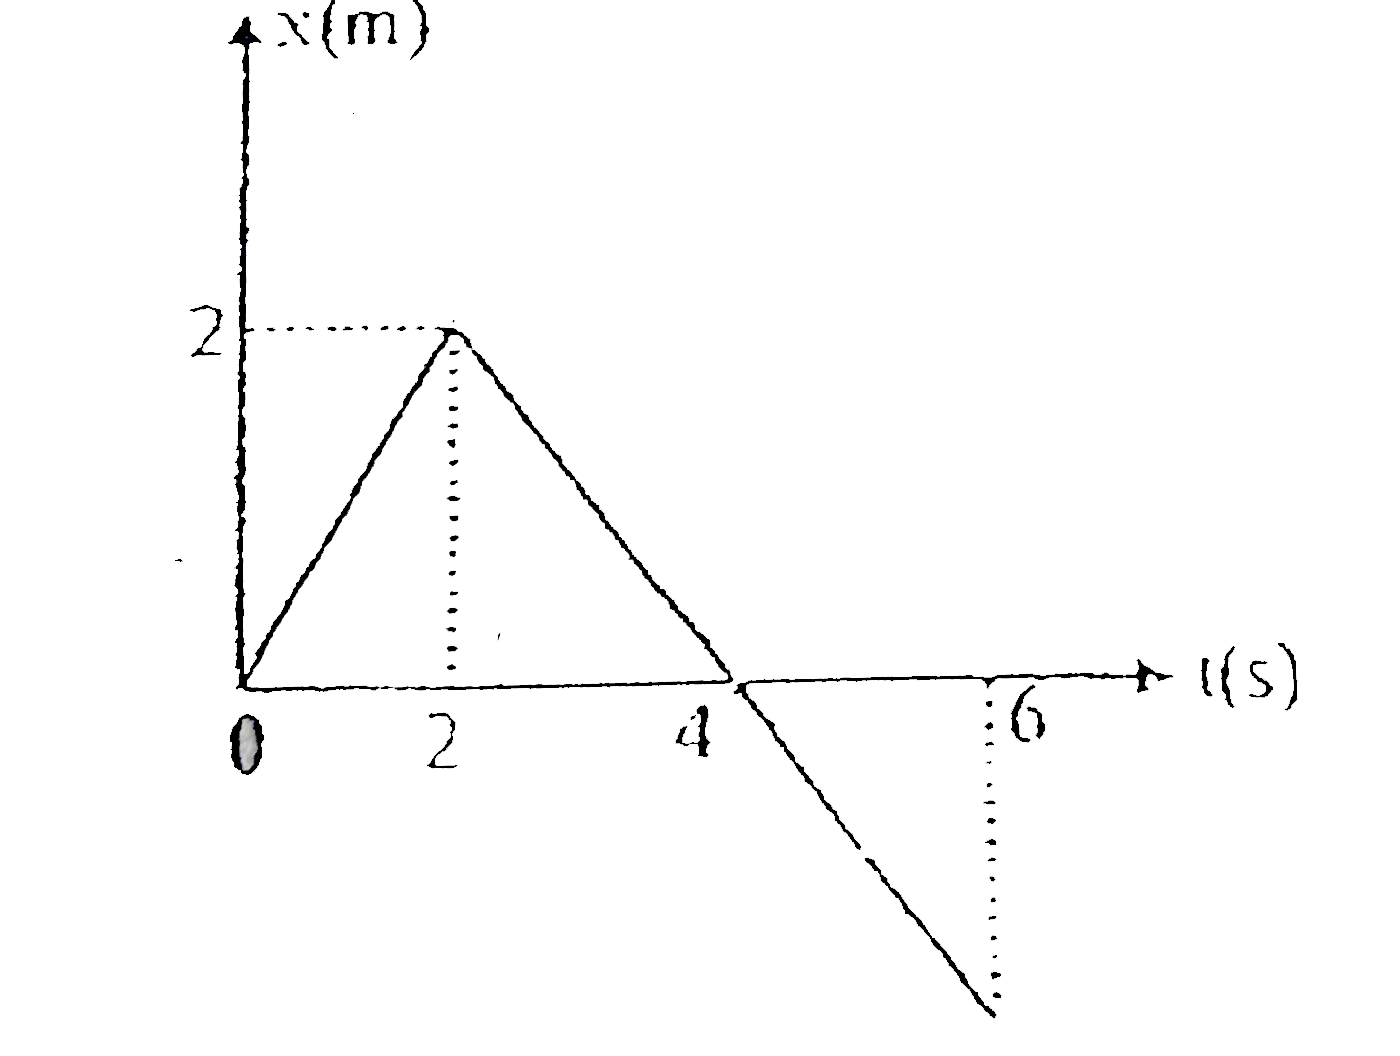
View SolutionPosition time graph of a particle of mass 2 kg is shown in figrure. Total work done on the particle from t=0 to t=4s is
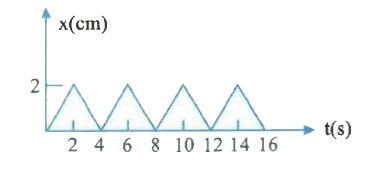
View SolutionThe position-time graph of a body of mass 0.04kg is shown in the figure. The time between two consecutive impulses received by the body and the magnitude of each impulse is
View Solution


 .
.