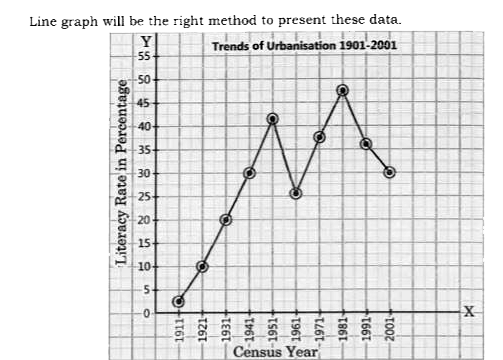
Represent the following data with the help of suitable diagram.
India: Trends of Urbanisation 1901-2001

Range of the data =46.14−0.35=45.79

Topper's Solved these Questions
- GRAPHICAL REPRESENTATION OF DATABOOK - FULL MARKSCHAPTER - GRAPHICAL REPRESENTATION OF DATAEXERCISE - ADDITIONAL QUESTIONS SOLVED (VERY SHORT ANSWER QUESTIONS)
11 Videos
- GRAPHICAL REPRESENTATION OF DATABOOK - FULL MARKSCHAPTER - GRAPHICAL REPRESENTATION OF DATAEXERCISE - ADDITIONAL QUESTIONS SOLVED (SHORT ANSWER QUESTIONS)
3 Videos
- GRAPHICAL REPRESENTATION OF DATABOOK - FULL MARKSCHAPTER - GRAPHICAL REPRESENTATION OF DATAEXERCISE - TEST ASSIGNMENT
3 Videos
- DATA-ITS SOURCE AND COMPLIATIONBOOK - FULL MARKSCHAPTER - DATA-ITS SOURCE AND COMPLIATIONEXERCISE - ADDITIONAL QUESTION SOLVED (IV. VIVA-VOCE QUESTIONS)
8 Videos
- HUMAN DEVELOPMENTBOOK - FULL MARKSCHAPTER - HUMAN DEVELOPMENTEXERCISE - Worksheet (Based on Chapter -4)
12 Videos
Similar Questions
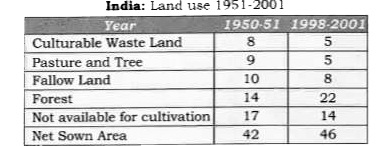
Represent the followng data with help of pie- diagram.
India: Land use 1951-2001

View SolutionRepresent the following data with the help of suitable diagram.
India: Literacy and Enrolment Ratio of Primary and Upper Primary Schools.
View SolutionRepresent the following data by histogram:

View SolutionRepresent the following data using a histogram.

View SolutionRepresent the following data, using a percentage bar diagram :

View SolutionRepresent the following data by frequency curve :

View SolutionExplain column chromatography with the help of a suitable diagram.
View SolutionIllustrate the following with the help of suitable diagrams: Leaf of Bryophyllum with buds.
View SolutionIllustrate the following with the help of suitable diagrams: Leaf of Bryophyllum with buds.
View SolutionRepresent the following data with the help of a pie-diagram: Items, Wheat, Rice, Tea Production (in metric tons), 3280, 1840, 900
View Solution
