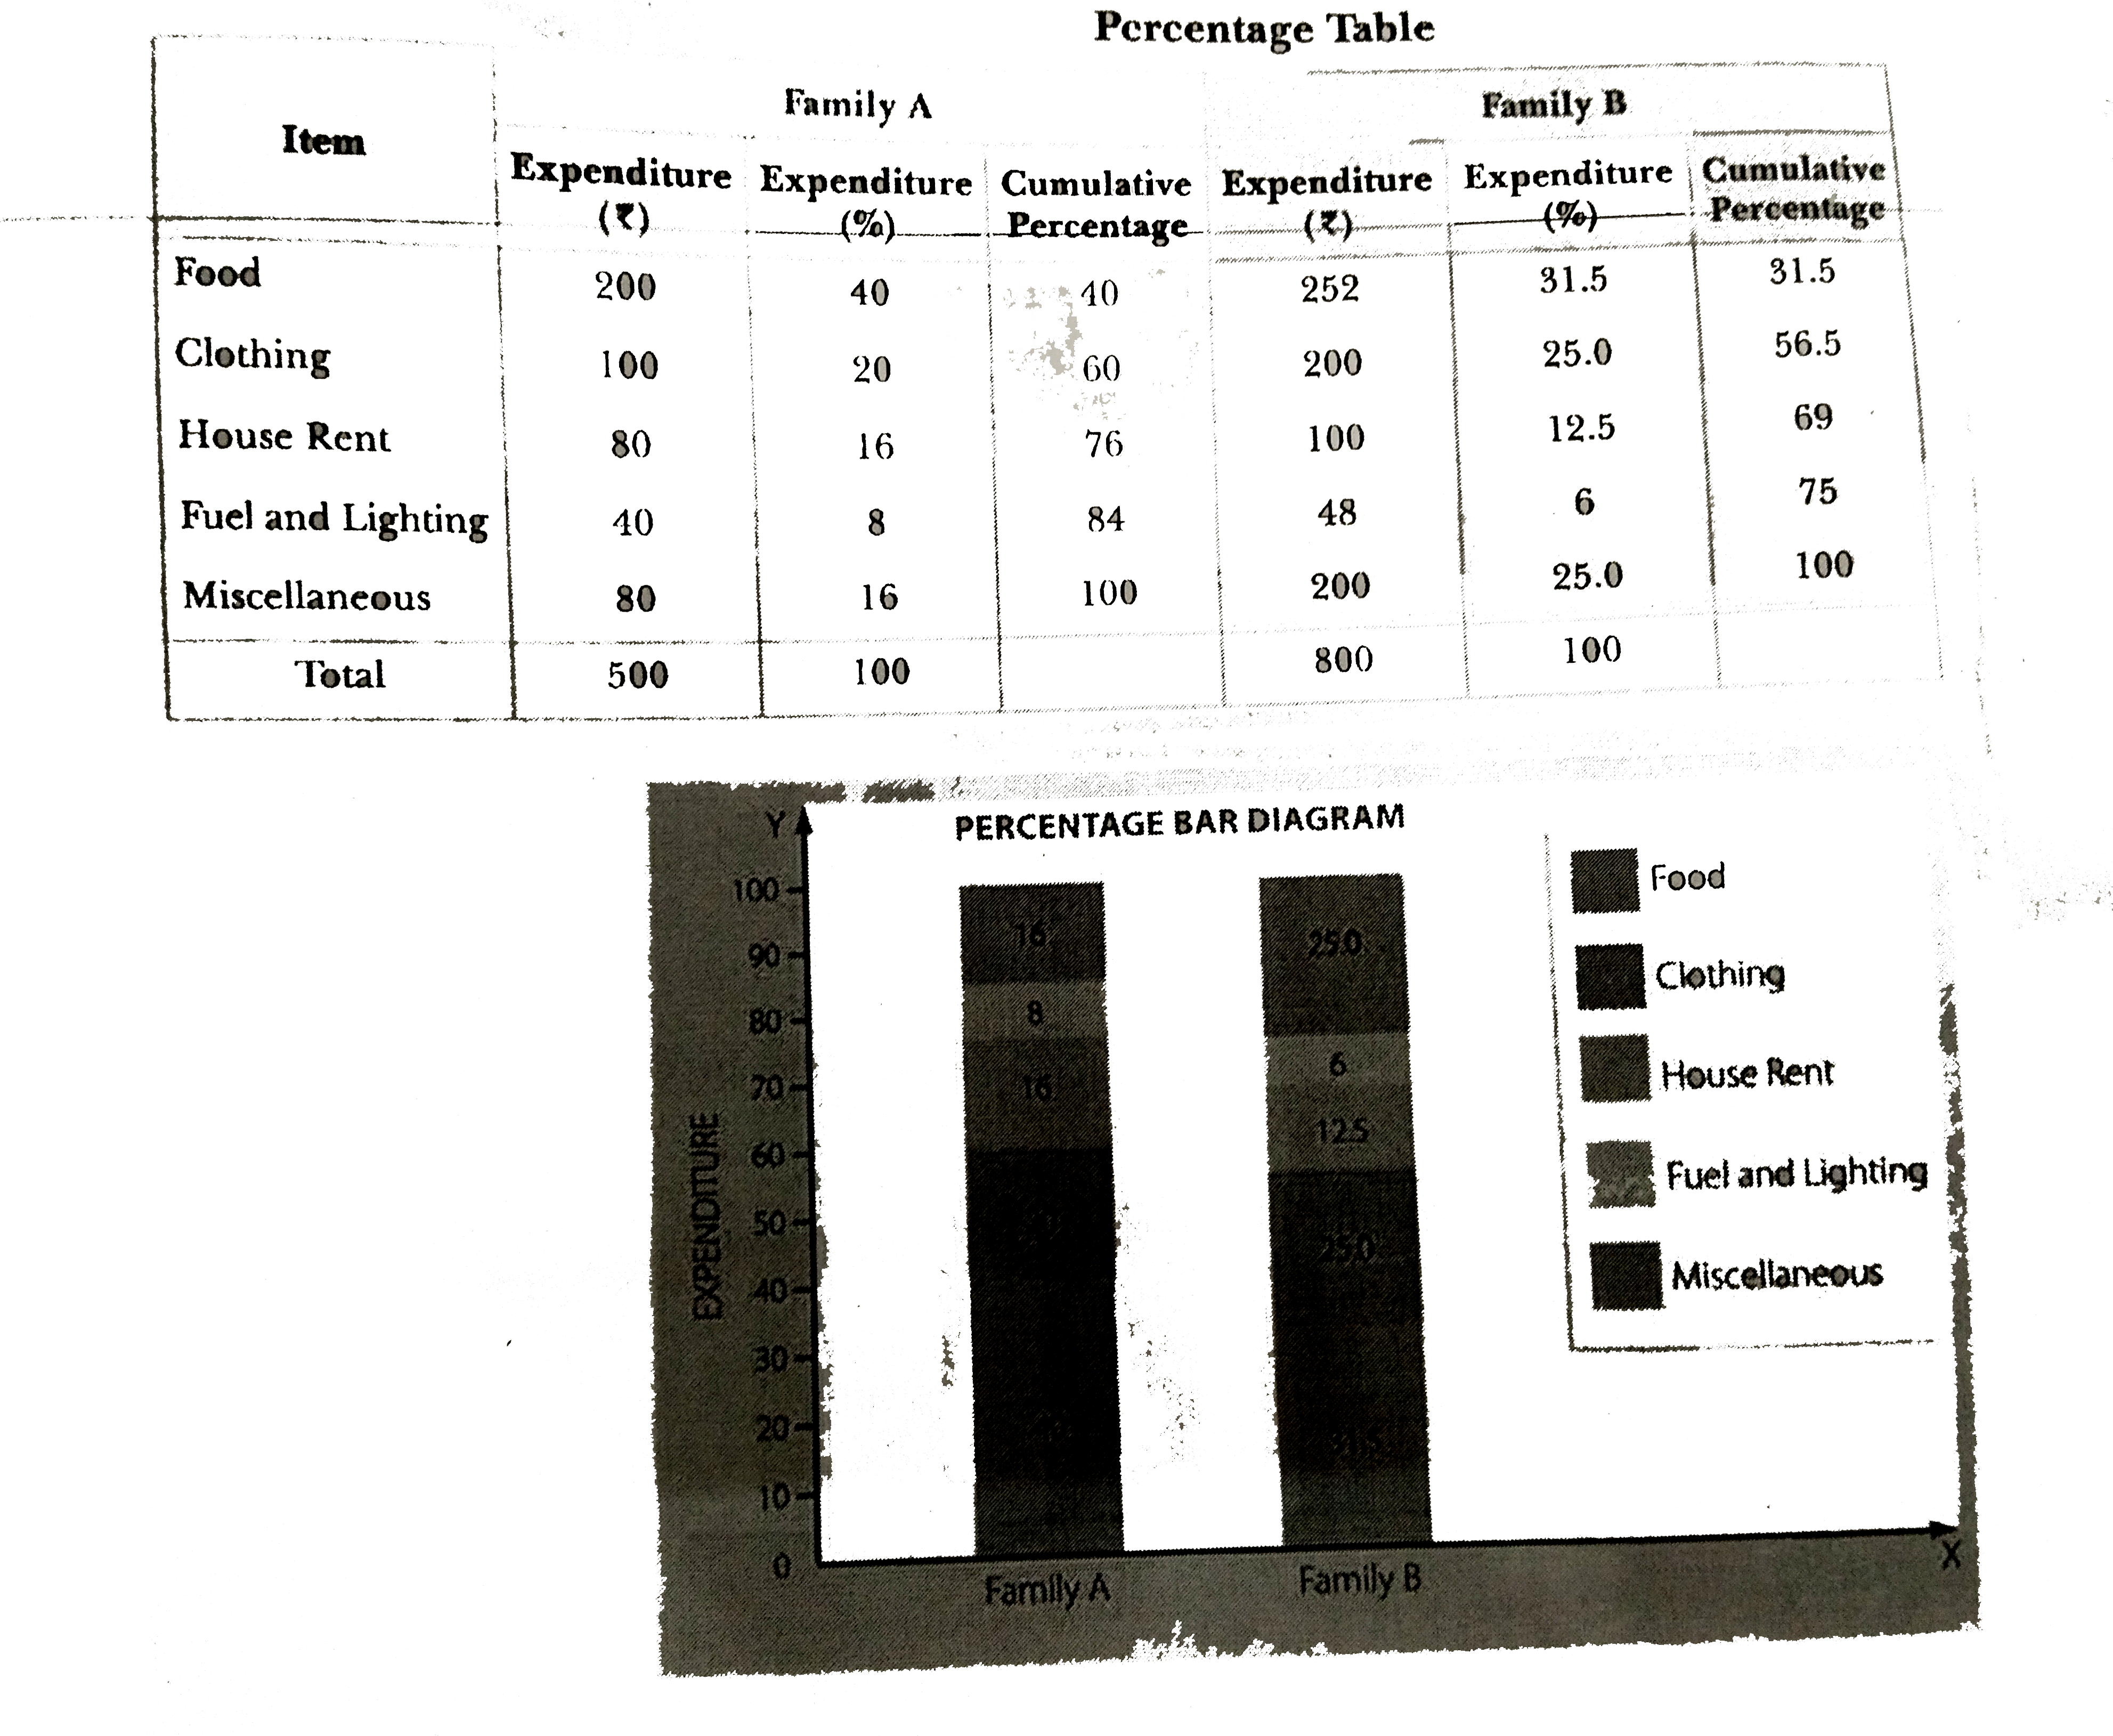
Represent the following data, using a percentage bar diagram :

Video Solution
Text Solution
|
Similar Questions
Reprent the following data by a percentage bar diagram :

View SolutionRepresent the following data using a histogram.

View SolutionDeifine percentage bar diagram.
View SolutionRepresent the following data by histogram:

View SolutionReprent the following data by a deviation bar diagram :

View SolutionPresent the following data in the form of horizontal bar diagram :

View SolutionRepresent the following data by frequency curve :

View SolutionPresent the following data by a devidation bar diagram showning the difference between sale proceeds and cost of a firm

View SolutionRepresent the following data with the help of suitable diagram.
India: Trends of Urbanisation 1901-2001
View SolutionRepresent the following data with the help of suitable diagram.
India: Literacy and Enrolment Ratio of Primary and Upper Primary Schools.
View Solution

