In how many catergories are maps and graphs used to present data?
Video Solution
Text Solution
The diagrams and the maps to represent data can be grouped into the following types:
a. One dimensional diagrams such as line graph, polygraph, bar diagram, histogram, age, sex, pyramid etc.
b. Two dimensional diagram such as pie diagram and rectangular diagram.
c. Three dimensional diagrams such as cube and spherical diagrams.
|
Updated on:21/07/2023
Topper's Solved these Questions
- BOOK - FULL MARKSCHAPTER - GRAPHICAL REPRESENTATION OF DATAEXERCISE - ADDITIONAL QUESTIONS SOLVED (LONG ANSWER QUESTIONS)3videos
GRAPHICAL REPRESENTATION OF DATA
- BOOK - FULL MARKSCHAPTER - GRAPHICAL REPRESENTATION OF DATAEXERCISE - ADDITIONAL QUESTIONS SOLVED (VIVA VOCE QUESTIONS)15videos
GRAPHICAL REPRESENTATION OF DATA
- BOOK - FULL MARKSCHAPTER - GRAPHICAL REPRESENTATION OF DATAEXERCISE - ADDITIONAL QUESTIONS SOLVED (VERY SHORT ANSWER QUESTIONS)11videos
GRAPHICAL REPRESENTATION OF DATA
- BOOK - FULL MARKSCHAPTER - DATA-ITS SOURCE AND COMPLIATIONEXERCISE - ADDITIONAL QUESTION SOLVED (IV. VIVA-VOCE QUESTIONS)8videos
DATA-ITS SOURCE AND COMPLIATION
- BOOK - FULL MARKSCHAPTER - HUMAN DEVELOPMENTEXERCISE - Worksheet (Based on Chapter -4)12videos
HUMAN DEVELOPMENT
Similar Questions
Knowledge Check
- Question 1 - Select One
How many meninges are present in rat
ATwoBThreeCFourDMany - Question 2 - Select One
How many sphincters are present in the urethra
A4B3C2D1 - Question 3 - Select One
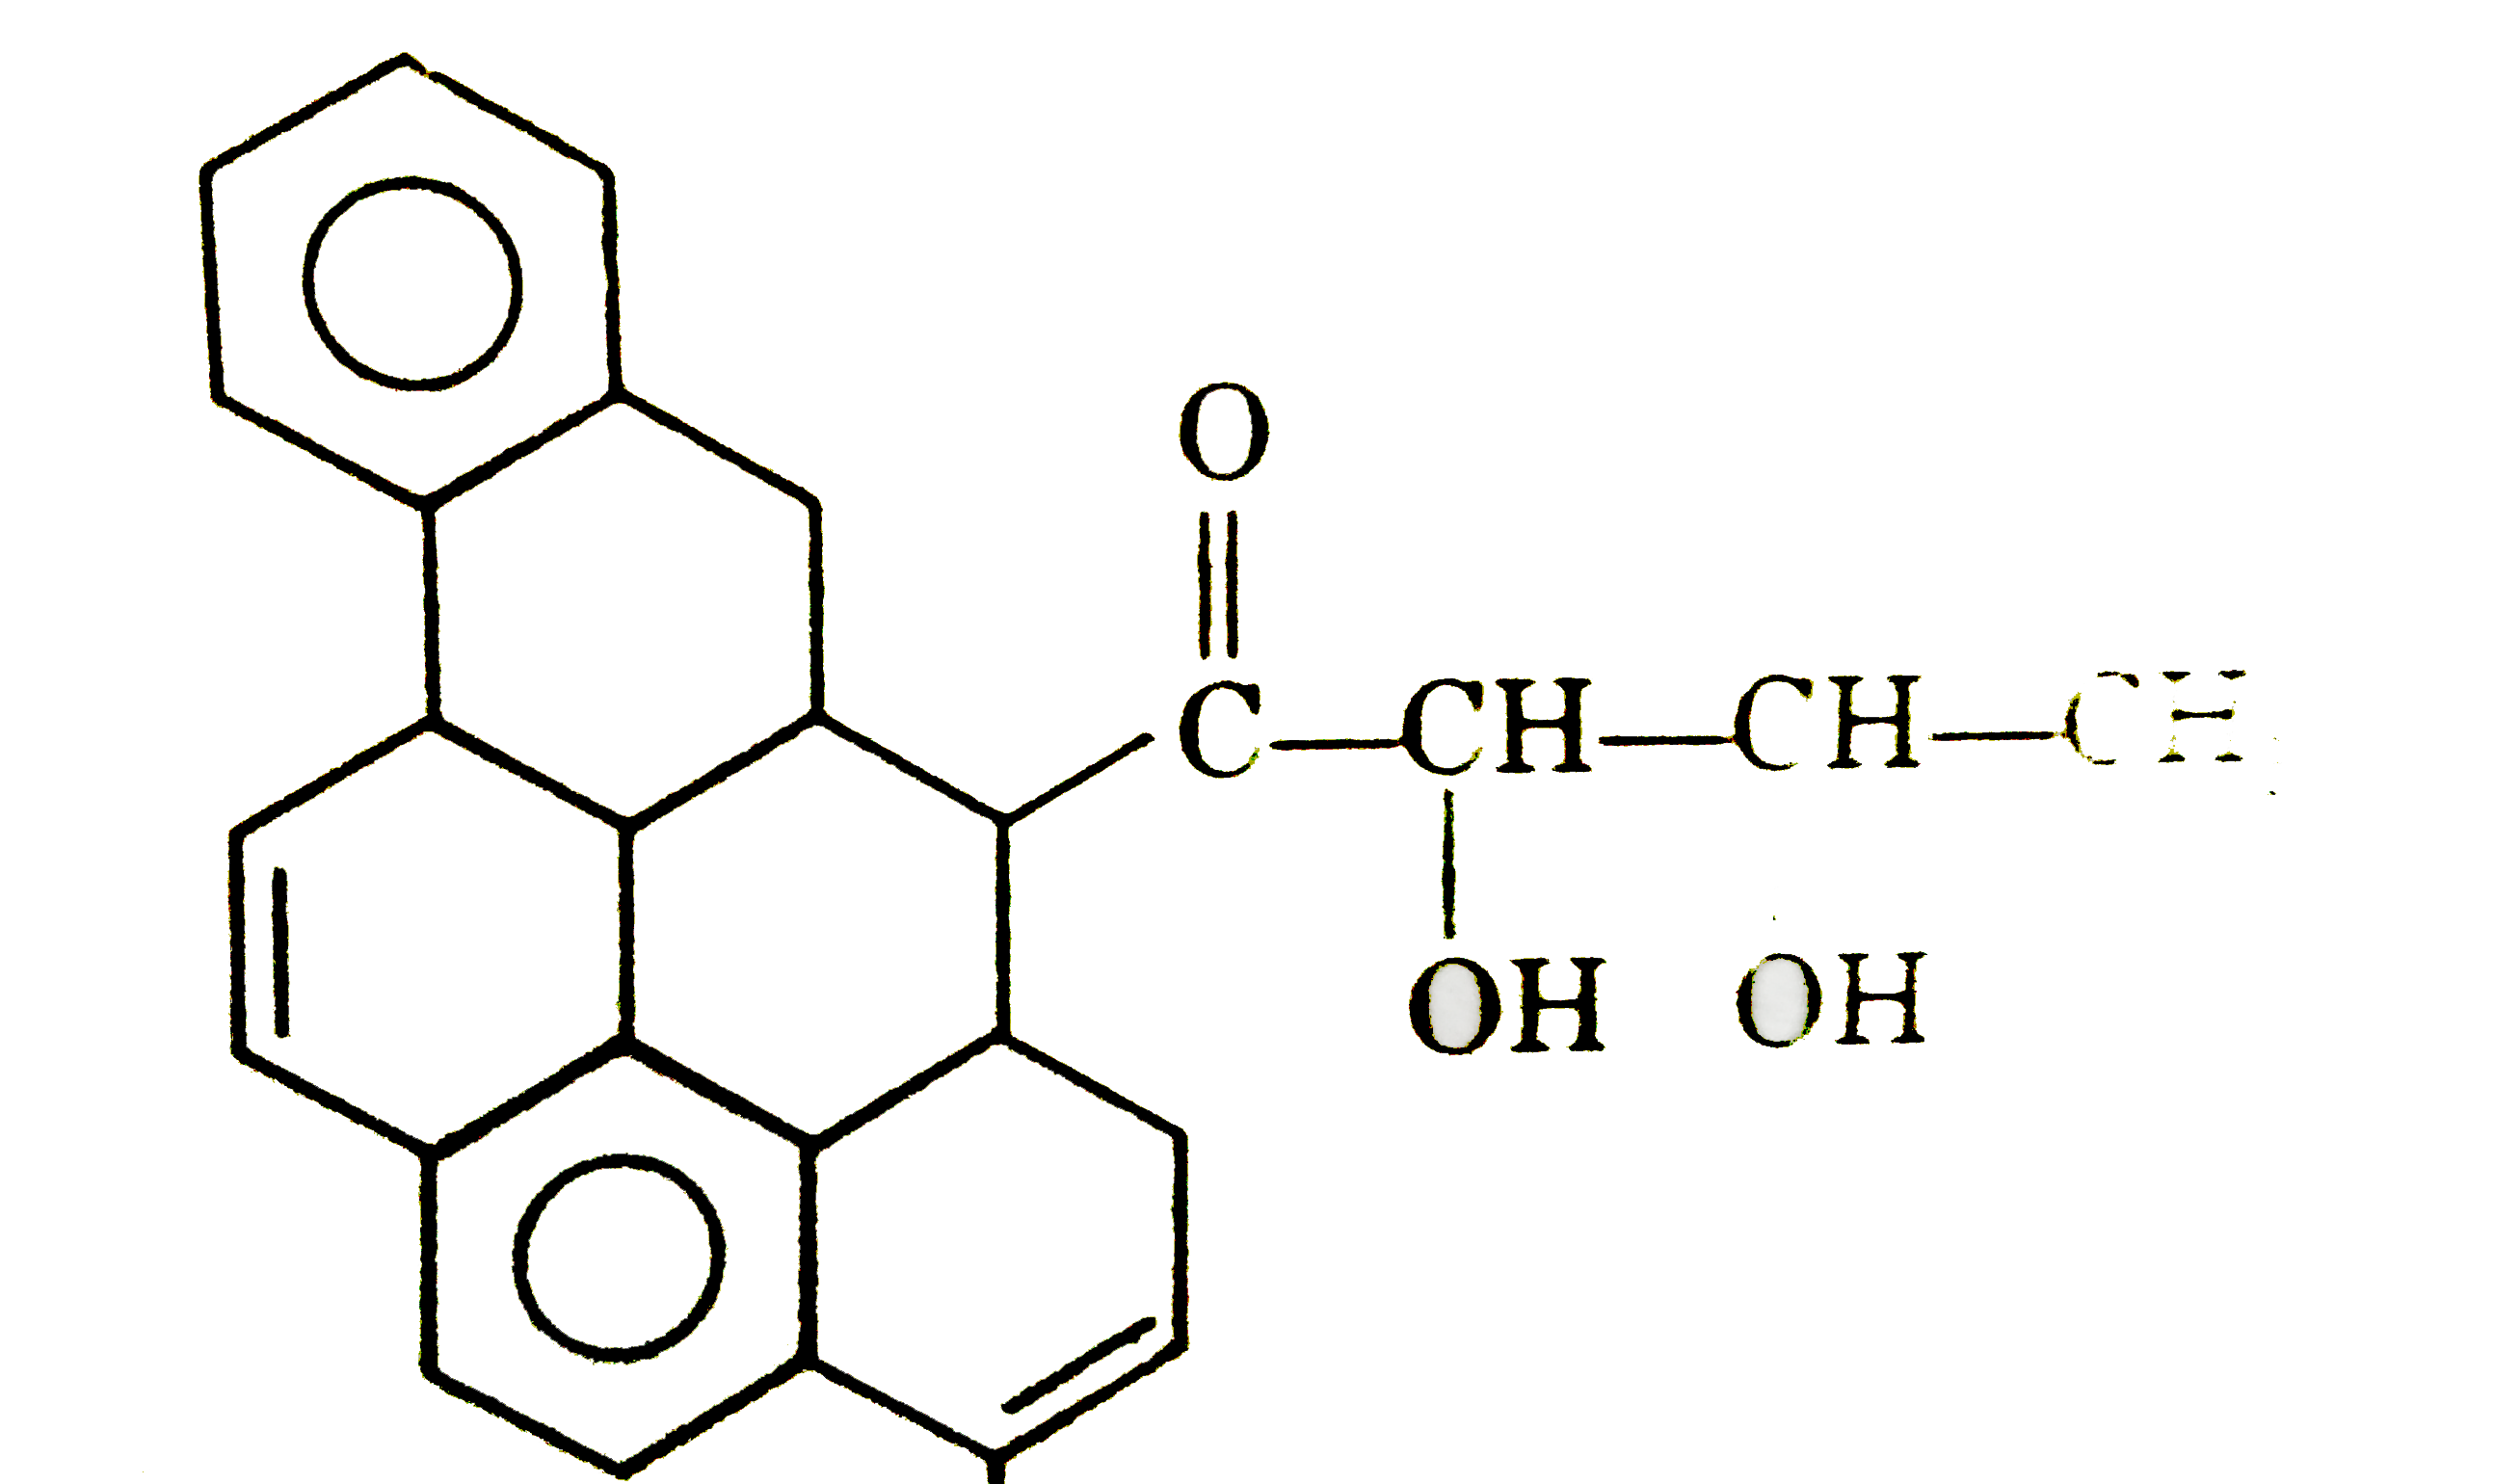
How many chiral centres are present in
 A5B6C7D8
How many silicon atoms are present in the atom are present in the anion of a pyrosilicates ?
View SolutionHow many arms are present in sepia ?
View SolutionHow many facial bones are present in pairs
View SolutionHow many centrioles are normally present in a sperm?
View SolutionHow many quadrants are there in a graph Paper
View Solution

