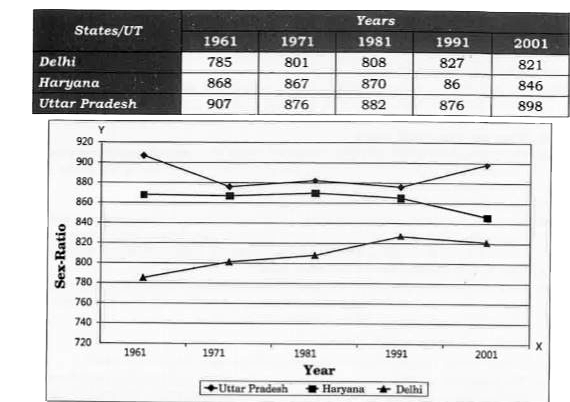
How are data presented using ploygraphs?
Video Solution
Text Solution
Polygraph is a line graph in which two or more than two variables are shown by an equal number of lines for an immediate comparison, such as the growth rate of different crops like rice, pulses or the birth rates and life expectancy or sex ratio in different states or countries. A different line pattern such as straight line (______________) ,, broken line (---) dotted line (...) or a combination of dotted and broken line (....) or line of different colours may be used to indicated the value of different variables.

|
Topper's Solved these Questions
- GRAPHICAL REPRESENTATION OF DATABOOK - FULL MARKSCHAPTER - GRAPHICAL REPRESENTATION OF DATAEXERCISE - ADDITIONAL QUESTIONS SOLVED (VIVA VOCE QUESTIONS)
15 Videos
- GRAPHICAL REPRESENTATION OF DATABOOK - FULL MARKSCHAPTER - GRAPHICAL REPRESENTATION OF DATAEXERCISE - TEST ASSIGNMENT
3 Videos
- GRAPHICAL REPRESENTATION OF DATABOOK - FULL MARKSCHAPTER - GRAPHICAL REPRESENTATION OF DATAEXERCISE - ADDITIONAL QUESTIONS SOLVED (SHORT ANSWER QUESTIONS)
3 Videos
- DATA-ITS SOURCE AND COMPLIATIONBOOK - FULL MARKSCHAPTER - DATA-ITS SOURCE AND COMPLIATIONEXERCISE - ADDITIONAL QUESTION SOLVED (IV. VIVA-VOCE QUESTIONS)
8 Videos
- HUMAN DEVELOPMENTBOOK - FULL MARKSCHAPTER - HUMAN DEVELOPMENTEXERCISE - Worksheet (Based on Chapter -4)
12 Videos
Similar Questions
Knowledge Check
Data becomes ...... when it is presented in a format hat people can understand and use
AprocessedBgraphsCinformationDpresentationThose diagrams in which data are presented in the form of bars or rectangles-
APie diagrams,BScatter diagramCBar diagramsDFrequency Curve
How the bacteria present in soil and root nodules of leguminous plants are useful?
View SolutionHow the bacteria present in soil and root nodules of leguminous plants are useful ?
View SolutionData represented using circles is known as
View SolutionWhat are data? How are these important?
View SolutionIn how many catergories are maps and graphs used to present data?
View SolutionWhat are different methods of presenting spatial data ?
View Solution
