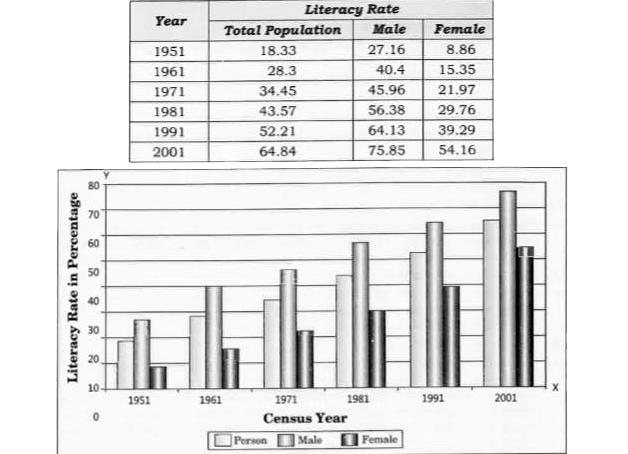
Draft a multiple bar diagram.
Video Solution
Text Solution
Multiple bar diagram is constructed to represente two or more than two variables for the purpose of comparison.
|
Topper's Solved these Questions
- GRAPHICAL REPRESENTATION OF DATABOOK - FULL MARKSCHAPTER - GRAPHICAL REPRESENTATION OF DATAEXERCISE - ADDITIONAL QUESTIONS SOLVED (VIVA VOCE QUESTIONS)
15 Videos
- GRAPHICAL REPRESENTATION OF DATABOOK - FULL MARKSCHAPTER - GRAPHICAL REPRESENTATION OF DATAEXERCISE - TEST ASSIGNMENT
3 Videos
- GRAPHICAL REPRESENTATION OF DATABOOK - FULL MARKSCHAPTER - GRAPHICAL REPRESENTATION OF DATAEXERCISE - ADDITIONAL QUESTIONS SOLVED (SHORT ANSWER QUESTIONS)
3 Videos
- DATA-ITS SOURCE AND COMPLIATIONBOOK - FULL MARKSCHAPTER - DATA-ITS SOURCE AND COMPLIATIONEXERCISE - ADDITIONAL QUESTION SOLVED (IV. VIVA-VOCE QUESTIONS)
8 Videos
- HUMAN DEVELOPMENTBOOK - FULL MARKSCHAPTER - HUMAN DEVELOPMENTEXERCISE - Worksheet (Based on Chapter -4)
12 Videos
Similar Questions
Knowledge Check
Glven here is a multiple bar diagram depicting the changes in the students strength of a college in four faculties from 1990-91 to 199293. Study the diagram and answer the questions.
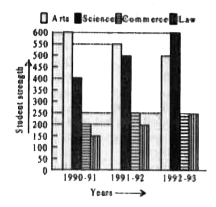
In which faculty was there a regular decrease in students' strength?AArtsBScienceCCommerceDLawGlven here is a multiple bar diagram depicting the changes in the students strength of a college in four faculties from 1990-91 to 199293. Study the diagram and answer the questions.
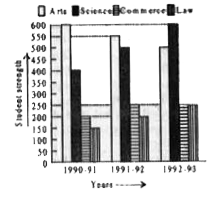
The percentage of students in Science faculty in 1990-91 wasA26.9B27.8C29.6D30.2Given here is a multiple bar diagram depicting the changes in the students strength of a college in four faculties from 1990 - 91 to 1992 - 93. Study the diagram and answer the questions.
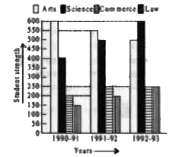
In which faculty was there a regular decease in students' strength?AArtsBScienceCCommerceDLaw
What is a multiple bar diagram ?
View SolutionThe following table gives the data on the marks obtained by two students 'A and B' in five subjects :

Represent the data by a multiple bar diagram.
View SolutionPresent the following data in the form of a multiple bar diagrm:

View SolutionMake a multiple bar diagram of the following data

View SolutionGiven here is a multiple bar diagram depicting the changes in the students strength of a college in four faculties from 1990 - 91 to 1992 - 93. Study the diagram and answer the questions.
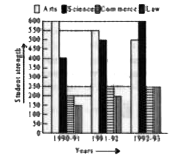
The percentage of students in Science faculty in 1990 - 91 was
View Solution


