What is a line graph? For which type of data are they used?
In line graph data are presented using a line on graph paper. The line graph are usually drawn to represent the time series data related to the temperature, rainfall, population growth, birt rates and death rates.
More thatn one variable can also be presented through line graph to do a comparative analysis. For example, temperature and pressure of an area can be presented in the same graph to make a comparison.
Topper's Solved these Questions
- GRAPHICAL REPRESENTATION OF DATABOOK - FULL MARKSCHAPTER - GRAPHICAL REPRESENTATION OF DATAEXERCISE - ADDITIONAL QUESTIONS SOLVED (LONG ANSWER QUESTIONS)
3 Videos
- GRAPHICAL REPRESENTATION OF DATABOOK - FULL MARKSCHAPTER - GRAPHICAL REPRESENTATION OF DATAEXERCISE - ADDITIONAL QUESTIONS SOLVED (VIVA VOCE QUESTIONS)
15 Videos
- GRAPHICAL REPRESENTATION OF DATABOOK - FULL MARKSCHAPTER - GRAPHICAL REPRESENTATION OF DATAEXERCISE - ADDITIONAL QUESTIONS SOLVED (VERY SHORT ANSWER QUESTIONS)
11 Videos
- DATA-ITS SOURCE AND COMPLIATIONBOOK - FULL MARKSCHAPTER - DATA-ITS SOURCE AND COMPLIATIONEXERCISE - ADDITIONAL QUESTION SOLVED (IV. VIVA-VOCE QUESTIONS)
8 Videos
- HUMAN DEVELOPMENTBOOK - FULL MARKSCHAPTER - HUMAN DEVELOPMENTEXERCISE - Worksheet (Based on Chapter -4)
12 Videos
Similar Questions
Knowledge Check
Newspaper is a source of which type of data ?
APrimaryBSecondaryC(1) and (2) bothDNone of these,A hard disk is an example of which type of data storage device?
APrimary StorageBOffline StorageCTertiary StorageDSecondary StorageA hard disk is an example of which type of data storage device?
APrimary StorageBSecondary StorageCOffline StorageDTertiary Storage
In a distance-time graph :
What type of motion does a curved line represent?
View SolutionWhich of the following graphs shows the type of natural selection which favours polymorphisms ?
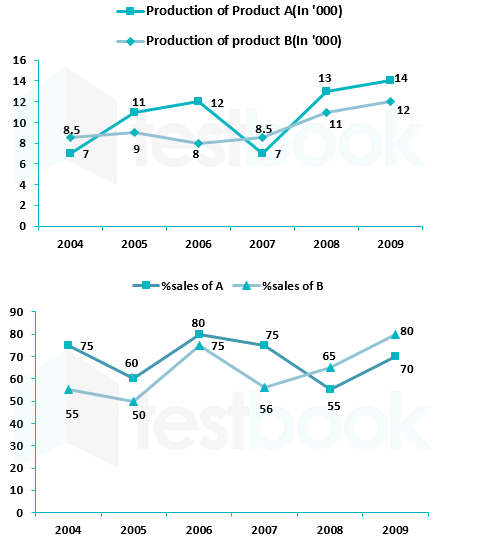
View SolutionThe line graph shows the production of product A and B (in thousands) during the period 2004 to 2009 and the second line Graph shows the percentage sale of these products.

In the given line graph, what is the total sale of Products A and B in the year 2007?
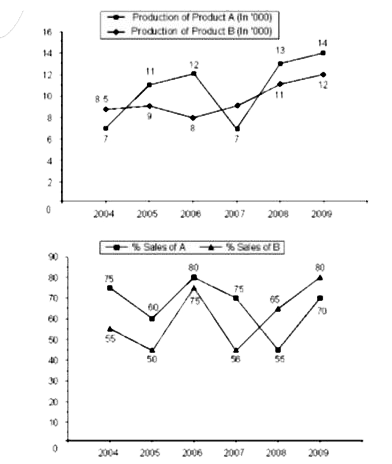
View SolutionThe line graph shows the production of product A and B during the period 2004 to 2009 and the second line graph shows the percentage sale of these products

In the given line graph, what is the total sale of products A and B in the year 2007
View SolutionDistricts within states would be represented in which type of spatial data?
View Solution

