Study the table give below and draw the given diagrams/ maps.
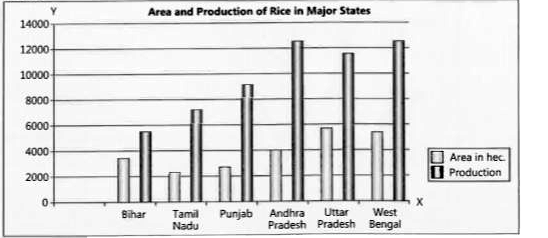
Area and Production of Rice in Major States.

a. Construct a multiple bar diagram to show area under rice in each state.
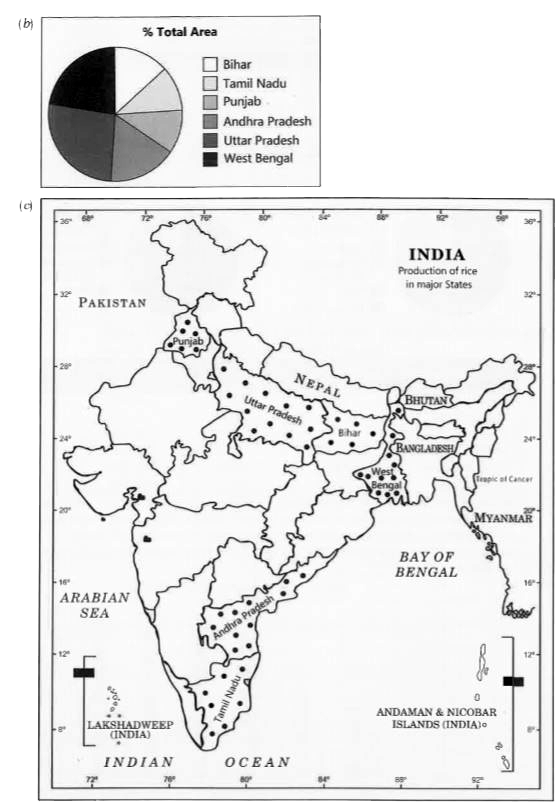
b. Construct a pie diagram to show the percentage of area under rice in each state.
c. Construct a dot map to show the production of rice in each state.
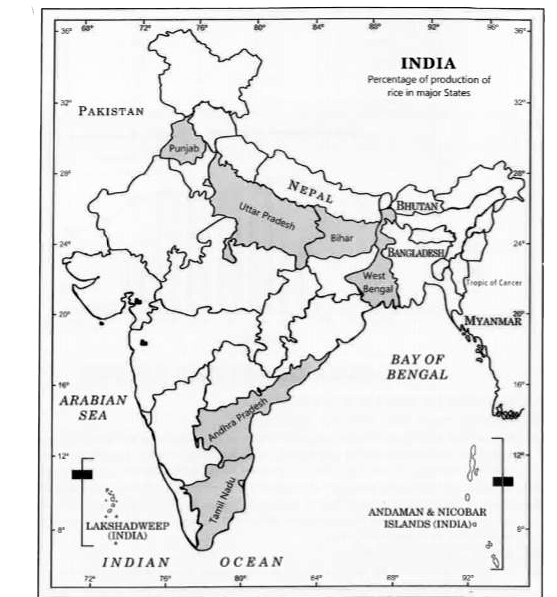
d. Construct a Choropleth map to show the percentage of production of rice in states.
Video Solution
Text Solution
|
Topper's Solved these Questions
- GRAPHICAL REPRESENTATION OF DATABOOK - FULL MARKSCHAPTER - GRAPHICAL REPRESENTATION OF DATAEXERCISE - ADDITIONAL QUESTIONS SOLVED (VERY SHORT ANSWER QUESTIONS)
11 Videos
- GRAPHICAL REPRESENTATION OF DATABOOK - FULL MARKSCHAPTER - GRAPHICAL REPRESENTATION OF DATAEXERCISE - ADDITIONAL QUESTIONS SOLVED (SHORT ANSWER QUESTIONS)
3 Videos
- GRAPHICAL REPRESENTATION OF DATABOOK - FULL MARKSCHAPTER - GRAPHICAL REPRESENTATION OF DATAEXERCISE - TEST ASSIGNMENT
3 Videos
- DATA-ITS SOURCE AND COMPLIATIONBOOK - FULL MARKSCHAPTER - DATA-ITS SOURCE AND COMPLIATIONEXERCISE - ADDITIONAL QUESTION SOLVED (IV. VIVA-VOCE QUESTIONS)
8 Videos
- HUMAN DEVELOPMENTBOOK - FULL MARKSCHAPTER - HUMAN DEVELOPMENTEXERCISE - Worksheet (Based on Chapter -4)
12 Videos
Similar Questions
Knowledge Check
What is the average production of rice in state A over the years.
A6B6.1C5.8D5.9Study the graph and answer the question.
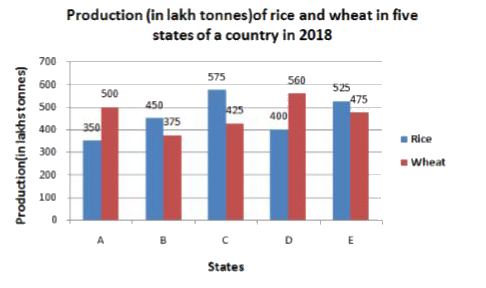
Total production of wheat in states A, B and E is what percentage less than the total production of rice in states C, D and E?A10B12C12.2D11.1Table shows the production of rice of three states over six years
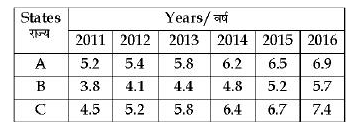
What is the ratio of the production of rice in all three states in the year 2014 to that in 2016?A85:102B89:102C85:103D87:100
Study the graph and answer the question
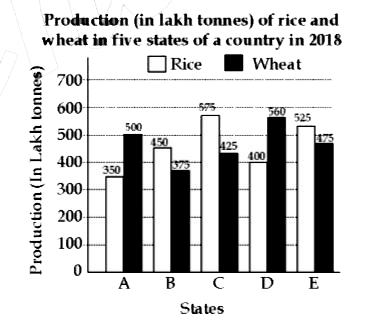
the ratio of the total production of rice in states C and E to the total production of wheat in states B and D is……..
View SolutionStudy the graph and answer the question
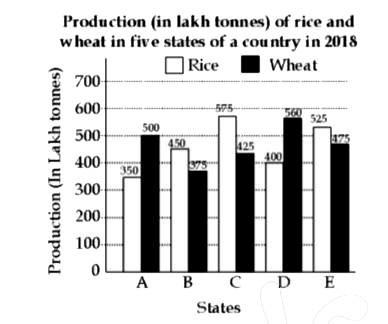
Total production of wheat in states A , B and E is what percentage less than the total production of rice in states C, D and E?
View SolutionWhat are the requirements to construct a dot map?
View SolutionWhat is the percentage increase in the production of rice in B from 2014 to 2016?
View SolutionThe bar graph given below shows the production (in000 tonnes) of rice of a country for the year 2007 to 2011 .
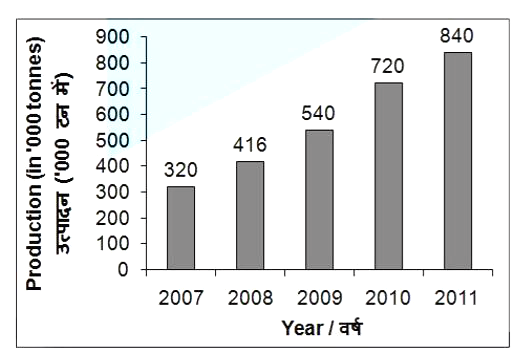
The production of rice in year 2010 is how much percent more that the production of rice in the year 2009 ?
View Solution

