The percentage increase in demand of sugar was the lowest as compared to its previous year in
2011
2008
2009
2010
The correct Answer is:A
To solve the problem of finding the year with the lowest percentage increase in the demand for sugar, we will follow these steps:
Step 1: Gather the data
We need the demand for sugar for the years in question. Let's assume the demand for sugar for the years is as follows:
- 2006: 43.3
- 2007: 47.2
- 2008: 49.5
- 2009: 53.4
- 2010: 54.5
- 2011: 62.7
Step 2: Calculate the percentage increase for each year
The formula for percentage increase is:
Percentage Increase=(Current Year Demand−Previous Year DemandPrevious Year Demand)×100
For 2007:
- Current Year Demand = 47.2
- Previous Year Demand = 43.3
Percentage Increase=(47.2−43.343.3)×100=(3.943.3)×100≈9%
For 2008:
- Current Year Demand = 49.5
- Previous Year Demand = 47.2
Percentage Increase=(49.5−47.247.2)×100=(2.347.2)×100≈4.88%≈4.8%
For 2009:
- Current Year Demand = 53.4
- Previous Year Demand = 49.5
Percentage Increase=(53.4−49.549.5)×100=(3.949.5)×100≈7.87%≈7.8%
For 2010:
- Current Year Demand = 54.5
- Previous Year Demand = 53.4
Percentage Increase=(54.5−53.453.4)×100=(1.153.4)×100≈2.06%≈2%
For 2011:
- Current Year Demand = 62.7
- Previous Year Demand = 54.5
Percentage Increase=(62.7−54.554.5)×100=(8.254.5)×100≈15%
Step 3: Compile the results
Now we compile the percentage increases calculated:
- 2007: 9%
- 2008: 4.8%
- 2009: 7.8%
- 2010: 2%
- 2011: 15%
Step 4: Identify the lowest percentage increase
From the compiled results, we see that:
- The lowest percentage increase is for the year 2010 with 2%.
Conclusion
The year with the lowest percentage increase in demand for sugar compared to the previous year is 2010.
---
We need the demand for sugar for the years in question. Let's assume the demand for sugar for the years is as follows:
- 2006: 43.3
- 2007: 47.2
- 2008: 49.5
- 2009: 53.4
- 2010: 54.5
- 2011: 62.7
The formula for percentage increase is:
Percentage Increase=(Current Year Demand−Previous Year DemandPrevious Year Demand)×100
- Current Year Demand = 47.2
- Previous Year Demand = 43.3
Percentage Increase=(47.2−43.343.3)×100=(3.943.3)×100≈9%
- Current Year Demand = 49.5
- Previous Year Demand = 47.2
Percentage Increase=(49.5−47.247.2)×100=(2.347.2)×100≈4.88%≈4.8%
- Current Year Demand = 53.4
- Previous Year Demand = 49.5
Percentage Increase=(53.4−49.549.5)×100=(3.949.5)×100≈7.87%≈7.8%
- Current Year Demand = 54.5
- Previous Year Demand = 53.4
Percentage Increase=(54.5−53.453.4)×100=(1.153.4)×100≈2.06%≈2%
- Current Year Demand = 62.7
- Previous Year Demand = 54.5
Percentage Increase=(62.7−54.554.5)×100=(8.254.5)×100≈15%
Now we compile the percentage increases calculated:
- 2007: 9%
- 2008: 4.8%
- 2009: 7.8%
- 2010: 2%
- 2011: 15%
From the compiled results, we see that:
- The lowest percentage increase is for the year 2010 with 2%.
The year with the lowest percentage increase in demand for sugar compared to the previous year is 2010.
Topper's Solved these Questions
- DATA TABLE BOOK - ARIHANT SSCCHAPTER - DATA TABLE EXERCISE - HIGHER SKILL LEVEL QUESTIONS
25 Videos
- DATA TABLE BOOK - ARIHANT SSCCHAPTER - DATA TABLE EXERCISE - HIGHER SKILL LEVEL QUESTIONS
25 Videos
- DATA SUFFICIENCYBOOK - ARIHANT SSCCHAPTER - DATA SUFFICIENCYEXERCISE - FAST TRACK PRACTICE
30 Videos
- DISCOUNTBOOK - ARIHANT SSCCHAPTER - DISCOUNTEXERCISE - FAST TRACK PRACTICE
47 Videos
Similar Questions
The following table shows the productions of food-grains (in million tons) in a state for the period 1999-2000 to 2003-2004. Read the table and answer the questions
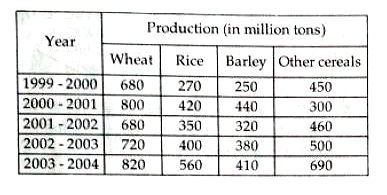
In 2002-2003, the percentage increase in the production of barley as compared to the previous year was
View SolutionIn which financial year the percentage increase in imports is the highest in comparison to its previous financial year?
View Solution
Knowledge Check
The given Bar Graph presents the results in terms of the number of students in a school for the five academic years, 2013-2014 to 2017-2018.
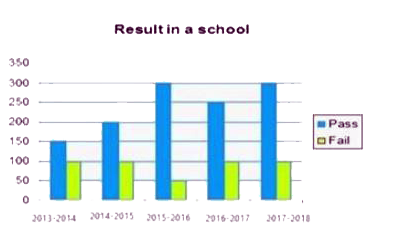
In which year the percentage increase in total number of students is the lowest in comparison to its previous academic yearA2016-2017B2014-2015C2015-2016D2017-2018In which year, the percentage increase in students in school B is the highest in comparison to its previous year
A2011B2013C2009D2010Study the following graph and answer the given questions
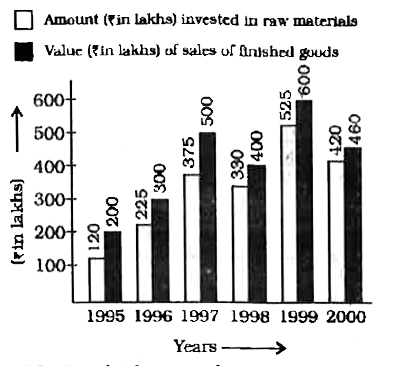
In which year, there has been a maximum percentage increase in the amount invested in raw materials as compared to the previous year ?A1996B1997C1998D1999
In which year the percentage increase of students in school A is the highest in comparison to its previous years?
View SolutionThe given bar graph presents the results in terms of number of students in a school for the five academic year 2013-2014 to 2017-2018.
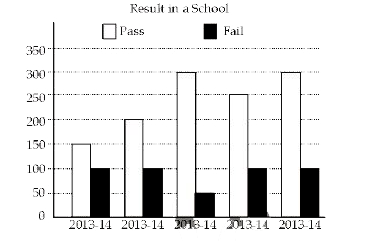
In which year the percentage increase in the total number of students is the highest in a comparison to the previous academic year?
View SolutionThe given bar graph presents the Revenue and Expenditure of a company during the five year period 2014-2018
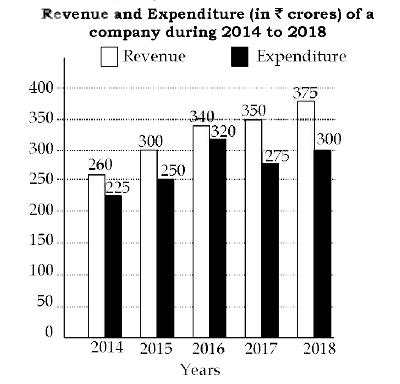
In which year the percentage increase in the revenue as compared to that in its preceding year is between 7% and 8%?
View SolutionStudy the following bar graph and answer the question that follows.
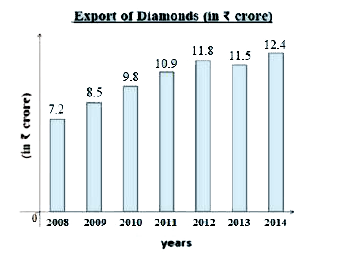
In which year was the maximum percentage increase in diamond exports compared to the previous year?
View SolutionStudy the following graph carefully and answer the questions given below –
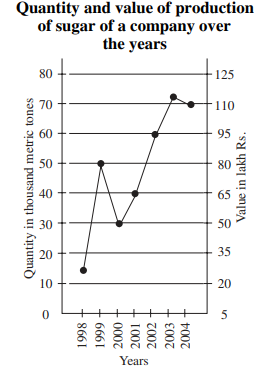
In which of the following years was the percentage increase in value of sugar per metric ton from the previous year the maximum?
View Solution
