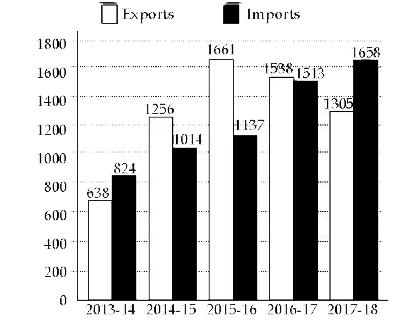
In which financial year the percentage increase in imports is the highest in comparison to its previous financial year?
2014-2015
2016-2017
2017-2018
2015-2016
The correct Answer is:B
To determine in which financial year the percentage increase in imports is the highest compared to the previous financial year, we will follow these steps:
Step 1: Identify the Import Values
First, we need to extract the import values for each financial year from the bar graph. Let's assume the import values for the years are as follows (these values are hypothetical, as the actual values were not provided in the transcript):
- 2014: 1000
- 2015: 1127
- 2016: 1513
- 2017: 1813
- 2018: 2100
Step 2: Calculate the Increase in Imports
Next, we will calculate the increase in imports for each year compared to the previous year:
- From 2014 to 2015:
1127−1000=127
- From 2015 to 2016:
1513−1127=386
- From 2016 to 2017:
1813−1513=300
- From 2017 to 2018:
2100−1813=287
Step 3: Calculate the Percentage Increase
Now, we will calculate the percentage increase for each year:
- From 2014 to 2015:
1271000×100=12.7%
- From 2015 to 2016:
3861127×100≈34.3%
- From 2016 to 2017:
3001513×100≈19.8%
- From 2017 to 2018:
2871813×100≈15.8%
Step 4: Compare the Percentage Increases
Now we will compare the percentage increases calculated:
- 2014 to 2015: 12.7%
- 2015 to 2016: 34.3%
- 2016 to 2017: 19.8%
- 2017 to 2018: 15.8%
Step 5: Identify the Highest Percentage Increase
From the comparison, we see that the highest percentage increase in imports occurred from 2015 to 2016, which is 34.3%.
Conclusion
Therefore, the financial year in which the percentage increase in imports is the highest compared to its previous financial year is 2015 to 2016.
---
First, we need to extract the import values for each financial year from the bar graph. Let's assume the import values for the years are as follows (these values are hypothetical, as the actual values were not provided in the transcript):
- 2015: 1127
- 2016: 1513
- 2017: 1813
- 2018: 2100
Next, we will calculate the increase in imports for each year compared to the previous year:
1127−1000=127
1513−1127=386
1813−1513=300
2100−1813=287
Now, we will calculate the percentage increase for each year:
1271000×100=12.7%
3861127×100≈34.3%
3001513×100≈19.8%
2871813×100≈15.8%
Now we will compare the percentage increases calculated:
- 2015 to 2016: 34.3%
- 2016 to 2017: 19.8%
- 2017 to 2018: 15.8%
From the comparison, we see that the highest percentage increase in imports occurred from 2015 to 2016, which is 34.3%.
Therefore, the financial year in which the percentage increase in imports is the highest compared to its previous financial year is 2015 to 2016.
Topper's Solved these Questions
Similar Questions
The given bar graph presents the Imports and Exports of an item manufactured by a company for the five financial years, 2013-2014 to 2017-2018.

In which financial year the percentage increase in total of Exports and Imports is the highest in comparison to its previous financial year?
View SolutionThe given bar graph presents the Imports and Exports of an item manufactured by a company for the five financial years, 2013-2014 to 2017-2018.

In which financial year the percentage increase in imports and Exports taken together is the lowest in comparison to its previous financial year?
View Solution
Knowledge Check
The given bar graph presents the Imports and Exports of an item manufactured by a company for the five financial years, 2013-2014 to 2017-2018.

In which financial year the percentage increase in total of Exports and Imports is the highest in comparison to its previous financial year?A2015-2016B2017-2018C2014-2015D2016-2017In which year, the percentage increase in students in school B is the highest in comparison to its previous year
A2011B2013C2009D2010In which year the percentage increase of students in school A is the highest in comparison to its previous years?
A2010B2012C2011D2009
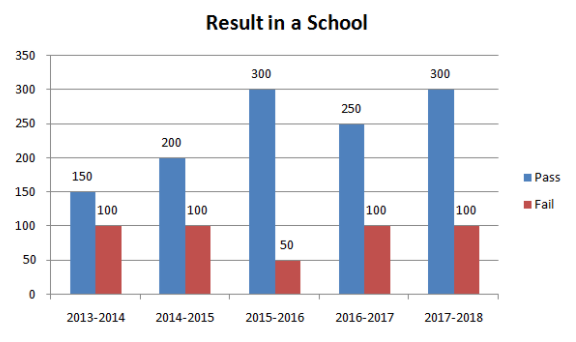
The given bar graph presents the results in terms of number of students in a school for the five academic year 2013-2014 to 2017-2018.

In which year the percentage increase in the total number of students is the highest in a comparison to the previous academic year?
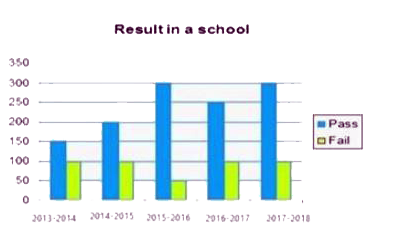
View SolutionThe given Bar Graph presents the results in terms of the number of students in a school for the five academic years, 2013-2014 to 2017-2018.

In which year the percentage increase in total number of students is the lowest in comparison to its previous academic year
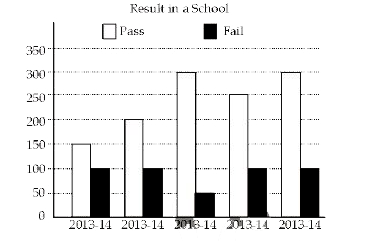
View SolutionThe given bar graph presents the results in terms of number of students in a school for the five academic year 2013-2014 to 2017-2018.

In which year the percentage increase in the total number of students is the highest in a comparison to the previous academic year?
View SolutionIn which financial year, total of Exports and Imports is the highest?
View SolutionThe given bar graph presents the Imports and Exports of an item manufactured by a company for the five financial years, 2013-2014 to 2017-2018.

In which financial year the total of the Exports and Imports is the lowest?
View Solution
