In which year, the total production of cars of types P and Q together was equal to the total production of cars of typesR and S together?
1990
1991
1994
1993
The correct Answer is:D
To solve the problem of determining in which year the total production of cars of types P and Q was equal to the total production of cars of types R and S, we can follow these steps:
Step 1: Gather the data
We need to collect the production data for each type of car (P, Q, R, S) for the years provided: 1989, 1990, 1991, 1992, 1993, and 1994.
Step 2: Calculate the total production for P and Q
For each year, we will add the production numbers of cars of type P and type Q together.
- For 1989: P = 8, Q = 16 → Total P + Q = 8 + 16 = 24
- For 1990: P = 20, Q = 10 → Total P + Q = 20 + 10 = 30
- For 1991: P = 17, Q = 6 → Total P + Q = 17 + 6 = 23
- For 1992: P = 16, Q = 14 → Total P + Q = 16 + 14 = 30
- For 1993: P = 16, Q = 10 → Total P + Q = 16 + 10 = 26
- For 1994: P = 17, Q = 12 → Total P + Q = 17 + 12 = 29
Step 3: Calculate the total production for R and S
Similarly, we will add the production numbers of cars of type R and type S together for each year.
- For 1989: R = 21, S = 4 → Total R + S = 21 + 4 = 25
- For 1990: R = 30, S = 17 → Total R + S = 30 + 17 = 47
- For 1991: R = 6, S = 16 → Total R + S = 6 + 16 = 22
- For 1992: R = 14, S = 16 → Total R + S = 14 + 16 = 30
- For 1993: R = 21, S = 12 → Total R + S = 21 + 12 = 33
- For 1994: R = 13, S = 20 → Total R + S = 13 + 20 = 33
Step 4: Compare totals for P + Q and R + S
Now we compare the totals calculated for P + Q and R + S for each year to find out when they are equal.
- 1989: P + Q = 24, R + S = 25 (not equal)
- 1990: P + Q = 30, R + S = 47 (not equal)
- 1991: P + Q = 23, R + S = 22 (not equal)
- 1992: P + Q = 30, R + S = 30 (equal)
- 1993: P + Q = 26, R + S = 33 (not equal)
- 1994: P + Q = 29, R + S = 33 (not equal)
Conclusion
The total production of cars of types P and Q was equal to the total production of cars of types R and S in the year 1992.
Final Answer
The answer is 1992.
---
We need to collect the production data for each type of car (P, Q, R, S) for the years provided: 1989, 1990, 1991, 1992, 1993, and 1994.
For each year, we will add the production numbers of cars of type P and type Q together.
- For 1990: P = 20, Q = 10 → Total P + Q = 20 + 10 = 30
- For 1991: P = 17, Q = 6 → Total P + Q = 17 + 6 = 23
- For 1992: P = 16, Q = 14 → Total P + Q = 16 + 14 = 30
- For 1993: P = 16, Q = 10 → Total P + Q = 16 + 10 = 26
- For 1994: P = 17, Q = 12 → Total P + Q = 17 + 12 = 29
Similarly, we will add the production numbers of cars of type R and type S together for each year.
- For 1990: R = 30, S = 17 → Total R + S = 30 + 17 = 47
- For 1991: R = 6, S = 16 → Total R + S = 6 + 16 = 22
- For 1992: R = 14, S = 16 → Total R + S = 14 + 16 = 30
- For 1993: R = 21, S = 12 → Total R + S = 21 + 12 = 33
- For 1994: R = 13, S = 20 → Total R + S = 13 + 20 = 33
Now we compare the totals calculated for P + Q and R + S for each year to find out when they are equal.
- 1990: P + Q = 30, R + S = 47 (not equal)
- 1991: P + Q = 23, R + S = 22 (not equal)
- 1992: P + Q = 30, R + S = 30 (equal)
- 1993: P + Q = 26, R + S = 33 (not equal)
- 1994: P + Q = 29, R + S = 33 (not equal)
The total production of cars of types P and Q was equal to the total production of cars of types R and S in the year 1992.
The answer is 1992.
Topper's Solved these Questions
- DATA TABLE BOOK - ARIHANT SSCCHAPTER - DATA TABLE EXERCISE - HIGHER SKILL LEVEL QUESTIONS
25 Videos
- DATA TABLE BOOK - ARIHANT SSCCHAPTER - DATA TABLE EXERCISE - HIGHER SKILL LEVEL QUESTIONS
25 Videos
- DATA SUFFICIENCYBOOK - ARIHANT SSCCHAPTER - DATA SUFFICIENCYEXERCISE - FAST TRACK PRACTICE
30 Videos
- DISCOUNTBOOK - ARIHANT SSCCHAPTER - DISCOUNTEXERCISE - FAST TRACK PRACTICE
47 Videos
Similar Questions
The table shows the production of different types of cars (in thousands)
यह तालिका अलग-अलग प्रकार के कारों का उत्पादन ( हज़ार में ) दर्शाती है |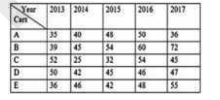 The ratio of the total production of cars of type C and E taken together in 2013 to the total production of cars of type D in 2014 and 2016 and type E in 2017 taken together is:
2013 में C और E प्रकार की कारों के कुल उत्पादन का 2014 और 2016 में D तथा 2017 में E प्रकार की कारों के कुल उत्पादन के साथ अनुपात ज्ञात करें |
View SolutionThe table shows the production of different types of cars (in thousands).
यह तालिका अलग-अलग प्रकार के कारों का उत्पादन ( हज़ार में) दर्शाती है |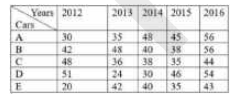 What is the ratio of the total production of cars of type A in 2014 and type C in 2013 taken together to the total production of cars of type B in 2016 and type E in 2015 taken together?
2014 में A प्रकार की कारों और 2013 में C प्रकार की कारों के कु ल उत्पादन का 2016 में B प्रकार की कारों और 2015 में E प्रकार की कारों के कुल उत्पादन के साथ अनुपात ज्ञात करें |
View Solution
Knowledge Check
The table given here shows production of five types of cars by a company in the year 1989 to 1994. Study the table and answer questions
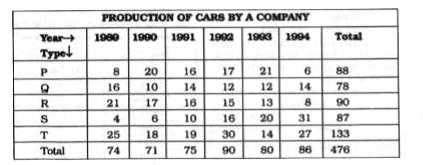
In which year the production of cars of types P and Q together was equal to the total production of cars of types R and S together?A1990B1991C1994DNone of the aboveThe table shows the production of different types of cars (in thousands)
यह तालिका अलग-अलग प्रकार के कारों का उत्पादन ( हज़ार में ) दर्शाती है | The ratio of the total production of cars of type C and E taken together in 2013 to the total production of cars of type D in 2014 and 2016 and type E in 2017 taken together is:
2013 में C और E प्रकार की कारों के कुल उत्पादन का 2014 और 2016 में D तथा 2017 में E प्रकार की कारों के कुल उत्पादन के साथ अनुपात ज्ञात करें |A8:13B5:8C13:32D8:11In which year, the production of cars of all types taken together was approximately equal to the average of the total production during the period?
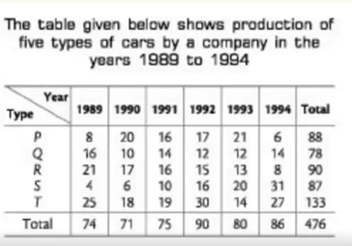 A1989B1991C1993D1994
The table shows the production of different types of cars (in thousands). Study the table carefully and answer the questions

What is the ratio of the total production of cars ot type A in 2014 and type C in 2013 taken together to the total production of cars of type B in 2016 and type E in 2015 taken together?
View SolutionThe table shows the production of different types of cars (in thousands).
यह तालिका अलग-अलग प्रकार के कारों का उत्पादन ( हज़ार में) दर्शाती है | What is the ratio of the total production of cars of type A in 2014 and type C in 2013 taken together to the total production of cars of type B in 2016 and type E in 2015 taken together?
2014 में A प्रकार की कारों और 2013 में C प्रकार की कारों के कु ल उत्पादन का 2016 में B प्रकार की कारों और 2015 में E प्रकार की कारों के कुल उत्पादन के साथ अनुपात ज्ञात करें |
View SolutionThe time table below shows production of five types of cars by a company from the year 1998 to 2003. Study the table and answer the question.
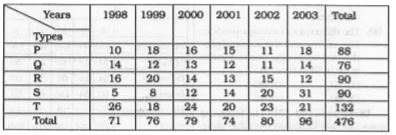
In which year the production of cars of all types taken together was approximately equal to the average of the total production during the period:
View SolutionThe table given here shows production of five types of cars by a company in the year 1989 to 1994. Study the table and answer questions
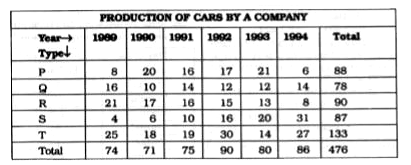
In which year the production of cars of all types taken together was approximately equal to the average of the total production during the period?
View SolutionThe table given below shows production of five types of cars by a company from the year 1998 to 2003. Study the table and answer the equation.
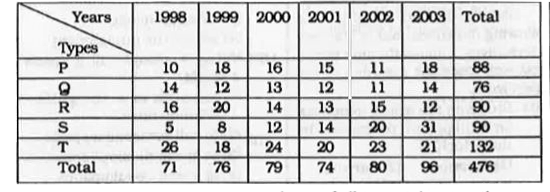
In which year the production of cars of all types taken together was approximately equal to the average of the total production during the period :
View Solution
