The surplus of sugar was lowest for the year
2012
2008
2009
2010
The correct Answer is:B
To determine the year with the lowest surplus of sugar, we need to calculate the surplus for each year by subtracting the demand from the supply. Here’s a step-by-step solution:
Step 1: Identify the Supply and Demand for Each Year
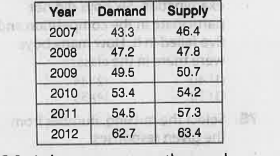
We need to know the supply and demand values for each year from the data provided. Let's assume the following values based on the video transcript:
- 2007: Supply = 50.0, Demand = 46.9
- 2008: Supply = 47.8, Demand = 47.2
- 2009: Supply = 50.7, Demand = 49.5
- 2010: Supply = 54.2, Demand = 53.4
- 2011: Supply = 57.3, Demand = 54.5
- 2012: Supply = 63.4, Demand = 62.7
Step 2: Calculate the Surplus for Each Year
Now, we will calculate the surplus for each year using the formula:
Surplus=Supply−Demand
- 2007: Surplus = 50.0 - 46.9 = 3.1
- 2008: Surplus = 47.8 - 47.2 = 0.6
- 2009: Surplus = 50.7 - 49.5 = 1.2
- 2010: Surplus = 54.2 - 53.4 = 0.8
- 2011: Surplus = 57.3 - 54.5 = 2.8
- 2012: Surplus = 63.4 - 62.7 = 0.7
Step 3: Identify the Lowest Surplus
Now we will compare the surplus values calculated for each year:
- 2007: 3.1
- 2008: 0.6
- 2009: 1.2
- 2010: 0.8
- 2011: 2.8
- 2012: 0.7
From these values, we can see that the lowest surplus is 0.6, which corresponds to the year 2008.
Conclusion
Thus, the surplus of sugar was lowest in the year 2008.
We need to know the supply and demand values for each year from the data provided. Let's assume the following values based on the video transcript:
- 2008: Supply = 47.8, Demand = 47.2
- 2009: Supply = 50.7, Demand = 49.5
- 2010: Supply = 54.2, Demand = 53.4
- 2011: Supply = 57.3, Demand = 54.5
- 2012: Supply = 63.4, Demand = 62.7
Now, we will calculate the surplus for each year using the formula:
Surplus=Supply−Demand
- 2008: Surplus = 47.8 - 47.2 = 0.6
- 2009: Surplus = 50.7 - 49.5 = 1.2
- 2010: Surplus = 54.2 - 53.4 = 0.8
- 2011: Surplus = 57.3 - 54.5 = 2.8
- 2012: Surplus = 63.4 - 62.7 = 0.7
Now we will compare the surplus values calculated for each year:
- 2008: 0.6
- 2009: 1.2
- 2010: 0.8
- 2011: 2.8
- 2012: 0.7
Thus, the surplus of sugar was lowest in the year 2008.
Topper's Solved these Questions
- DATA TABLE Book:ARIHANT SSCChapter:DATA TABLE Exercise:HIGHER SKILL LEVEL QUESTIONS
Explore 25 Videos
- DATA TABLE Book:ARIHANT SSCChapter:DATA TABLE Exercise:HIGHER SKILL LEVEL QUESTIONS
Explore 25 Videos
- DATA SUFFICIENCYBook:ARIHANT SSCChapter:DATA SUFFICIENCYExercise:FAST TRACK PRACTICE
Explore 30 Videos
- DISCOUNTBook:ARIHANT SSCChapter:DISCOUNTExercise:FAST TRACK PRACTICE
Explore 47 Videos
Similar Questions
Read the table and answer the questions
The following table gives demand and supply of sugar in million tons, for the period 2007, to 2012 . Surplus is defined as excess of supply over demand
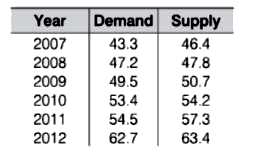
The percentage increase in demand of sugar was the lowest as compared to its previous year in
View SolutionRead the table and answer the questions
The following table gives demand and supply of sugar in million tons, for the period 2007, to 2012 . Surplus is defined as excess of supply over demand
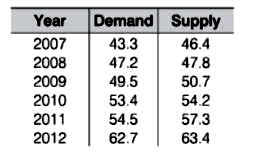
In how many years, the supply (in million tons) of sugar was more than the average supply for 2007 to 2012 ?
View Solution
Knowledge Check
The percentage increase in demand of sugar was the lowest as compared to its previous year in
A2011B2008C2009D2010The average surplus (in million tons) of sugar for the period 2008 to 2012 is
A1.44B1.84C1.53D1.22In how many years, the supply (in million tons) of sugar was more than the average supply from 2007 to 2012?
A5B4C3DA
How surplus farm products is sold by the farmers?
View SolutionStudy the following graph carefully and answer the given questions.
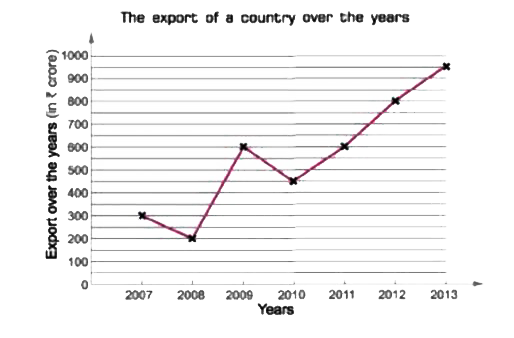
What is the percentage increase in exports from the lowest to the highest for the given years ?
View SolutionRead the table and answer the questions
The following table gives demand and supply of sugar in million tons, for the period 2007, to 2012 . Surplus is defined as excess of supply over demand
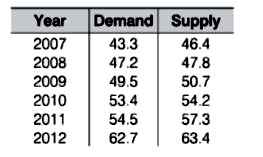
The average surplus (in million tons) of sugar for the period 2008 to 2012 is
View SolutionDirection :- Read the table and answer the questions.The following table gives demand and supply of sugar in million tonnes, for the period 2007 to 2012.Surplus is defined as excess of supply over demand.
 In how many years, the supply (in million tonnes) of sugar was more than average supply for 2007 to 2012?
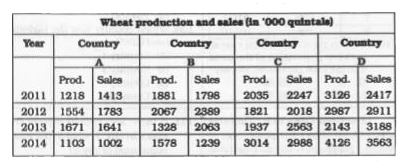
View SolutionThe table given below represents the production and sales of wheat in 4 different countries A, B, C and D over a period of 4 years. At the end of year 2010 A, B, C and D had a stock of 5200, 3500, 7835 and 1956 (in '000 quintals) of wheat respectively. For any given year, the stock of wheat is calculated as :
Stock of year (n + 1) = stock at end of year (n) + production in year (n + 1) - sales in year (n + 1)
And Surplus or year (n) = production in year (n) - sales in year (n)
What can be said about total surplus of country B and country D over the 4 years?
View Solution