In how many years, the supply (in million tons) of sugar was more than the average supply from 2007 to 2012?
5
4
3
A
The correct Answer is:C
To solve the problem of determining how many years the supply of sugar was more than the average supply from 2007 to 2012, we can follow these steps:
Step 1: Gather the Supply Data
First, we need the supply data for sugar from the years 2007 to 2012. Let's assume the supply data (in million tons) is as follows:
- 2007: 46.4
- 2008: 47.8
- 2009: 50.7
- 2010: 54.2
- 2011: 57.3
- 2012: 63.4
Step 2: Calculate the Total Supply
Next, we sum the supply for all the years from 2007 to 2012:
Total Supply=46.4+47.8+50.7+54.2+57.3+63.4
Calculating this gives:
Total Supply=319.8 million tons
Step 3: Calculate the Average Supply
To find the average supply over these years, we divide the total supply by the number of years (which is 6):
Average Supply=Total SupplyNumber of Years=319.86
Calculating this gives:
Average Supply=53.3 million tons
Step 4: Identify Years with Supply Above Average
Now, we need to check which years had a supply greater than the average supply of 53.3 million tons:
- 2007: 46.4 (not greater)
- 2008: 47.8 (not greater)
- 2009: 50.7 (not greater)
- 2010: 54.2 (greater)
- 2011: 57.3 (greater)
- 2012: 63.4 (greater)
Step 5: Count the Years
From the above data, the years where the supply was greater than 53.3 million tons are:
- 2010
- 2011
- 2012
Thus, there are 3 years where the supply was more than the average.
Final Answer
The supply of sugar was more than the average supply from 2007 to 2012 in 3 years.
---
First, we need the supply data for sugar from the years 2007 to 2012. Let's assume the supply data (in million tons) is as follows:
- 2007: 46.4
- 2008: 47.8
- 2009: 50.7
- 2010: 54.2
- 2011: 57.3
- 2012: 63.4
Next, we sum the supply for all the years from 2007 to 2012:
Total Supply=46.4+47.8+50.7+54.2+57.3+63.4
Calculating this gives:
Total Supply=319.8 million tons
To find the average supply over these years, we divide the total supply by the number of years (which is 6):
Average Supply=Total SupplyNumber of Years=319.86
Calculating this gives:
Average Supply=53.3 million tons
Now, we need to check which years had a supply greater than the average supply of 53.3 million tons:
- 2007: 46.4 (not greater)
- 2008: 47.8 (not greater)
- 2009: 50.7 (not greater)
- 2010: 54.2 (greater)
- 2011: 57.3 (greater)
- 2012: 63.4 (greater)
From the above data, the years where the supply was greater than 53.3 million tons are:
- 2010
- 2011
- 2012
The supply of sugar was more than the average supply from 2007 to 2012 in 3 years.
Topper's Solved these Questions
- DATA TABLE Book:ARIHANT SSCChapter:DATA TABLE Exercise:HIGHER SKILL LEVEL QUESTIONS
Explore 25 Videos
- DATA TABLE Book:ARIHANT SSCChapter:DATA TABLE Exercise:HIGHER SKILL LEVEL QUESTIONS
Explore 25 Videos
- DATA SUFFICIENCYBook:ARIHANT SSCChapter:DATA SUFFICIENCYExercise:FAST TRACK PRACTICE
Explore 30 Videos
- DISCOUNTBook:ARIHANT SSCChapter:DISCOUNTExercise:FAST TRACK PRACTICE
Explore 47 Videos
Similar Questions
Read the table and answer the questions
The following table gives demand and supply of sugar in million tons, for the period 2007, to 2012 . Surplus is defined as excess of supply over demand
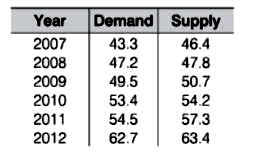
In how many years, the supply (in million tons) of sugar was more than the average supply for 2007 to 2012 ?
View SolutionDirection :- Read the table and answer the questions.The following table gives demand and supply of sugar in million tonnes, for the period 2007 to 2012.Surplus is defined as excess of supply over demand.
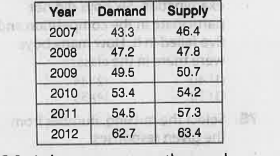 In how many years, the supply (in million tonnes) of sugar was more than average supply for 2007 to 2012?
View Solution
Knowledge Check
The average surplus (in million tons) of sugar for the period 2008 to 2012 is
A1.44B1.84C1.53D1.22In how many years, the revenue of the firm is less than the average revenue for these 8 years?
A3B4C5D6Study the following bar-diagram and answer the questions.
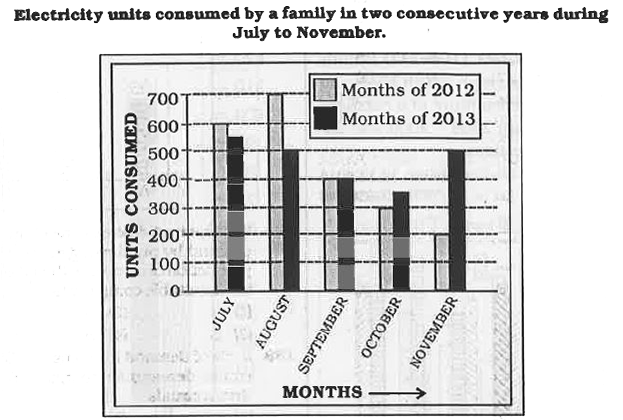
In how many months in 2012, the consumption of electric units was more than the average units consumption in that year ?A4B5C2D3
Study the graph and answer the question.
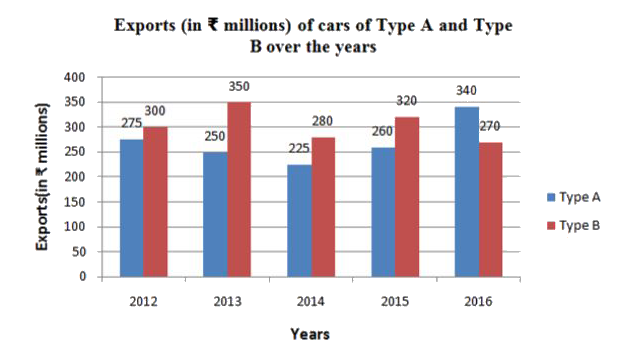
In how many years were the exports of type B cars more than the average exports of type A cars during 2012 to 2016?
View SolutionStudy the graph and answer the question
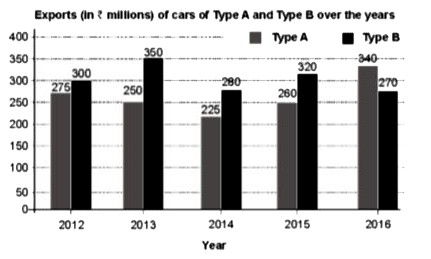
In how many years were the exports of type B cars more than the average exports of type A cars during 2012 to 2016
View SolutionRead the table and answer the questions
The following table gives demand and supply of sugar in million tons, for the period 2007, to 2012 . Surplus is defined as excess of supply over demand
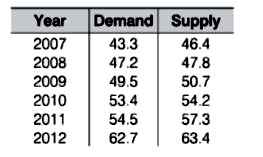
The average surplus (in million tons) of sugar for the period 2008 to 2012 is
View Solution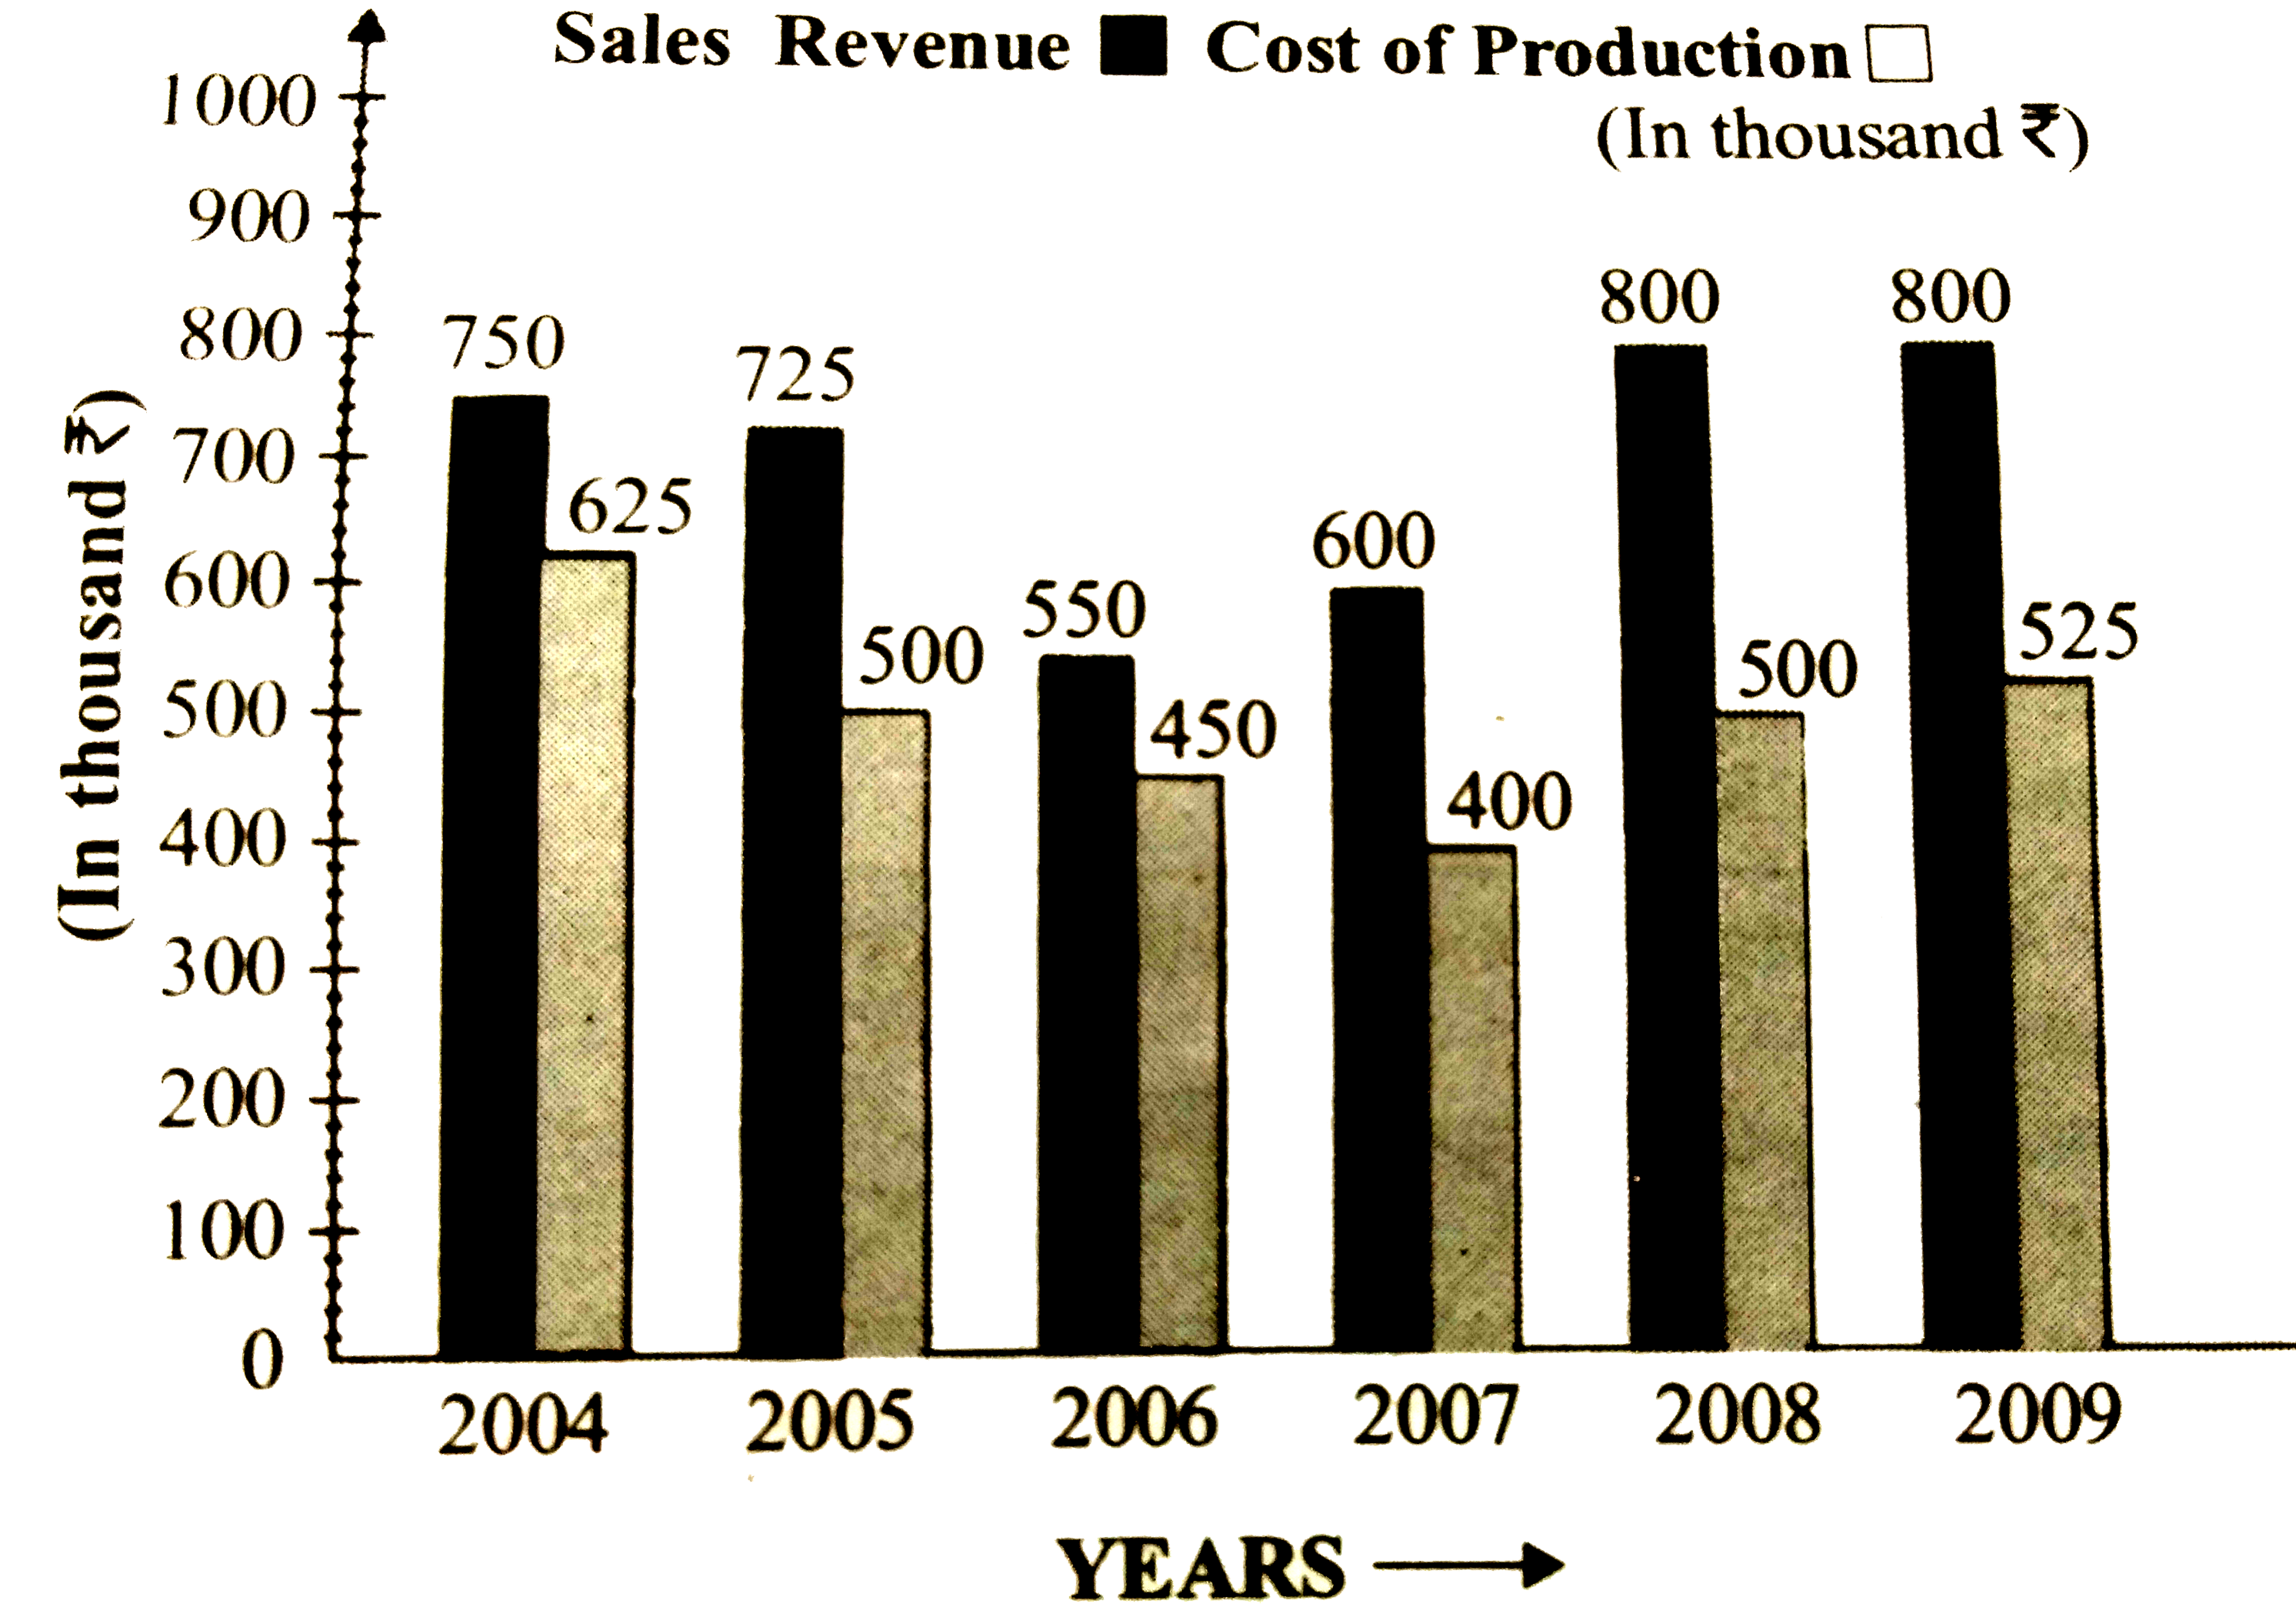
In how many years the cost of production is more than the average cost of production of the given years ?
View SolutionDirection :- Read the table and answer the questions.The following table gives demand and supply of sugar in million tonnes, for the period 2007 to 2012.Surplus is defined as excess of supply over demand.
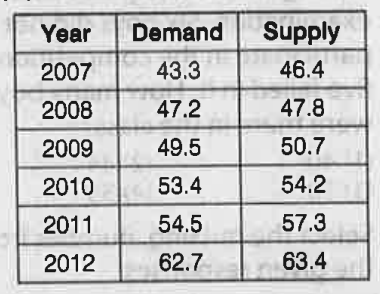
The average surplus (in million tonnes) of sugar for the period 2008 to 2012 is
View Solution