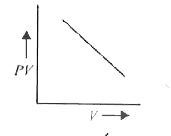
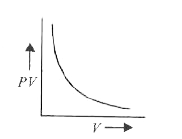
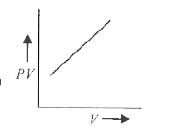
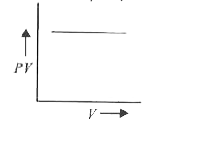
Which of the following graphs represent the behaviour of an ideal gas ?Solution in Kannada


The correct Answer is:D
For an ideal gas, for a given mass, PV=constant, whatever may be the volume.
Topper's Solved these Questions
Similar Questions
A metal rod of length of 10 cm and a rectangular cross - section of 1 cm ×12 cm is connected to a battery across apposite face . The resistance will be .'
View SolutionIf C be the capacitance and V be the electric potential ,then the dimensional formula of CV2 is
View SolutionWhich of the following graphs is consistent with ideal gas behaviour?
View SolutionGraph depicting correct behaviour of ideal gas and H_(2) gas will be (neglect a):
View SolutionWhich of the following graphs is inconsistent with ideal gas behaviour ? (Assume n = constant)
View SolutionThe graph that does not repersent the behaviour of an ideal gas is-
View SolutionThe graph that does represent the behaviour of an ideal gas is :
View SolutionWhich of the following graphs represent the behaviour of an ideal gas ?
View SolutionWhich one of the following graphs correctly gives the ideal gas behaviour ?
View SolutionWhich one of the following graphs represents the behaviour of an ideal gas.
View SolutionWhich of the following graphs represent the behaviour of an ideal gas ?
View SolutionWhich curve in the following graph represents the curve of ideal gas ?
View SolutionWhich of the following graphs represent the behaviour of an ideal gas ?
View SolutionWhich of the following correctly represent the behaviour of an ideal gas
View SolutionWhich of the following correctly represent the behaviour of an ideal gas
View SolutionWhich of the following shows ideal gas behaviour
View Solution
