The graph that does not repersent the behaviour of an ideal gas is-
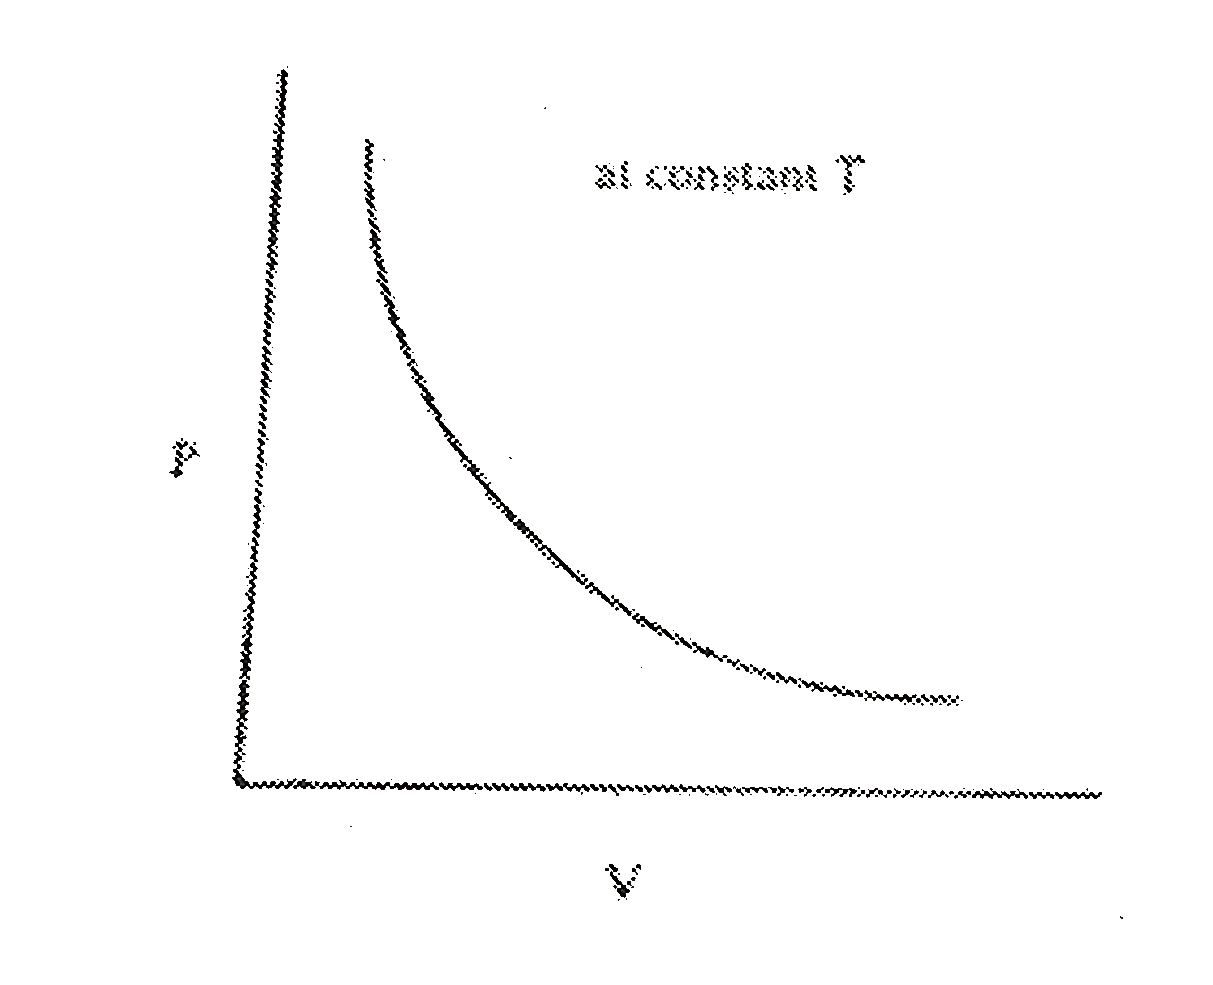
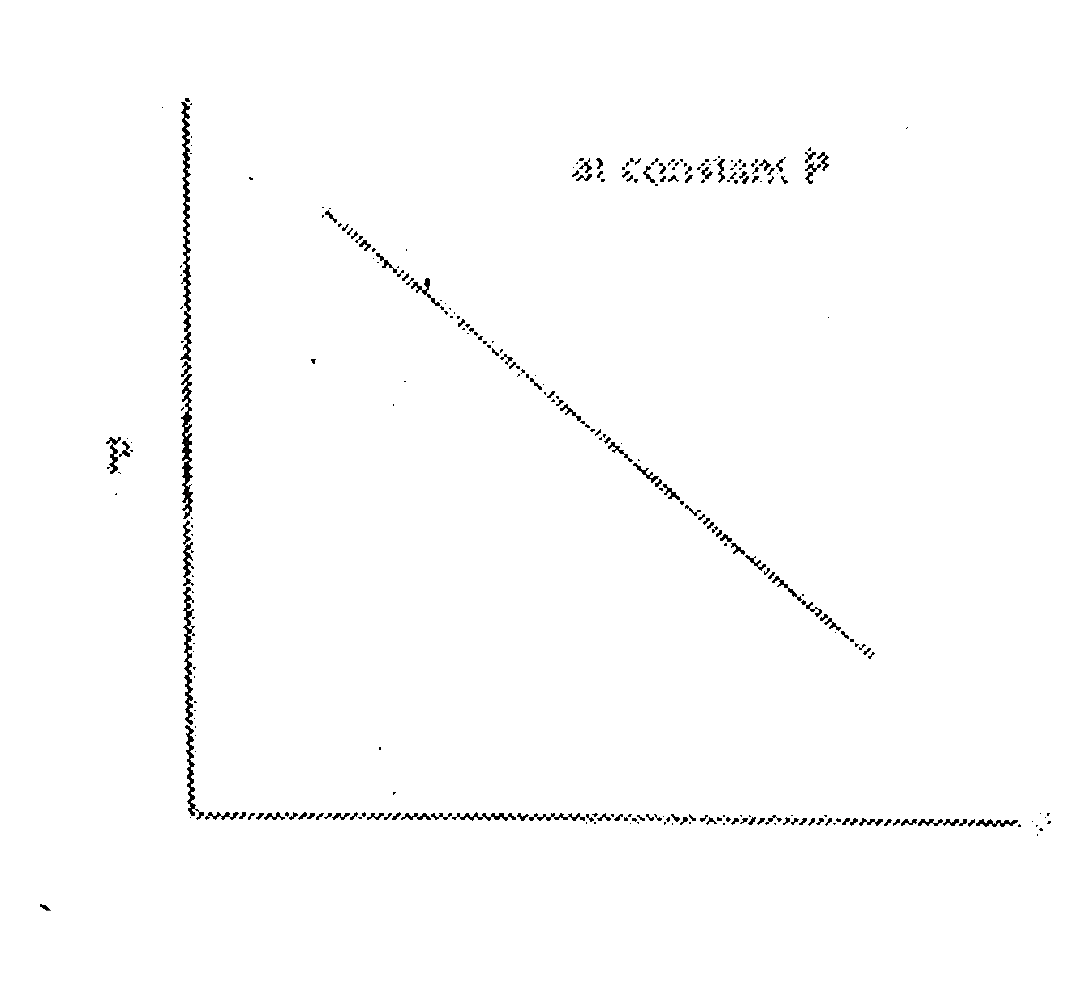

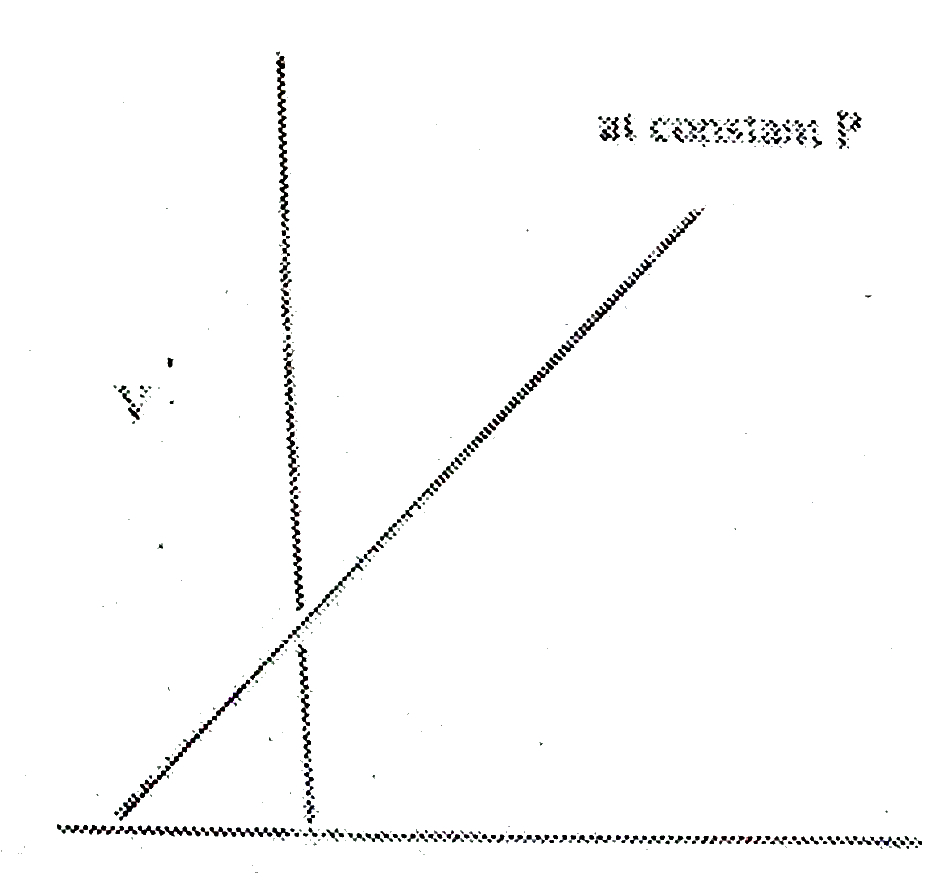
The correct Answer is:A, B, C, D
Step by step video, text & image solution for The graph that does not repersent the behaviour of an ideal gas is- by Chemistry experts to help you in doubts & scoring excellent marks in Class 12 exams.
Updated on:21/07/2023Topper's Solved these Questions
- KVPYBook:KVPY PREVIOUS YEARChapter:KVPYExercise:PART-I BIOLOGY
Explore 1 Video
- KVPYBook:KVPY PREVIOUS YEARChapter:KVPYExercise:PART-2 CHEMISTRY
Explore 15 Videos
- KVPYBook:KVPY PREVIOUS YEARChapter:KVPYExercise:Mathematics
Explore 10 Videos
- KVPY 2021Book:KVPY PREVIOUS YEARChapter:KVPY 2021Exercise:PART II CHEMISTRY
Explore 10 Videos
Similar Questions
Pressure versus volume graph for real gas and are shown in figure. Answer the following question on the basis of this graph.

(i) Interpret the behaviour of real gas with respect to ideal gas at low pressure.
(ii) Interpret the behaviour of real gas with respect to ideal gas at high pressure.
(iii) Mark the pressure and volume by drawing a line at the point where real gas behaves as an ideal gas.
View SolutionA real gas most closely approaches the behaviour of an ideal gas at
View Solution
Knowledge Check
The graph that does represent the behaviour of an ideal gas is :
A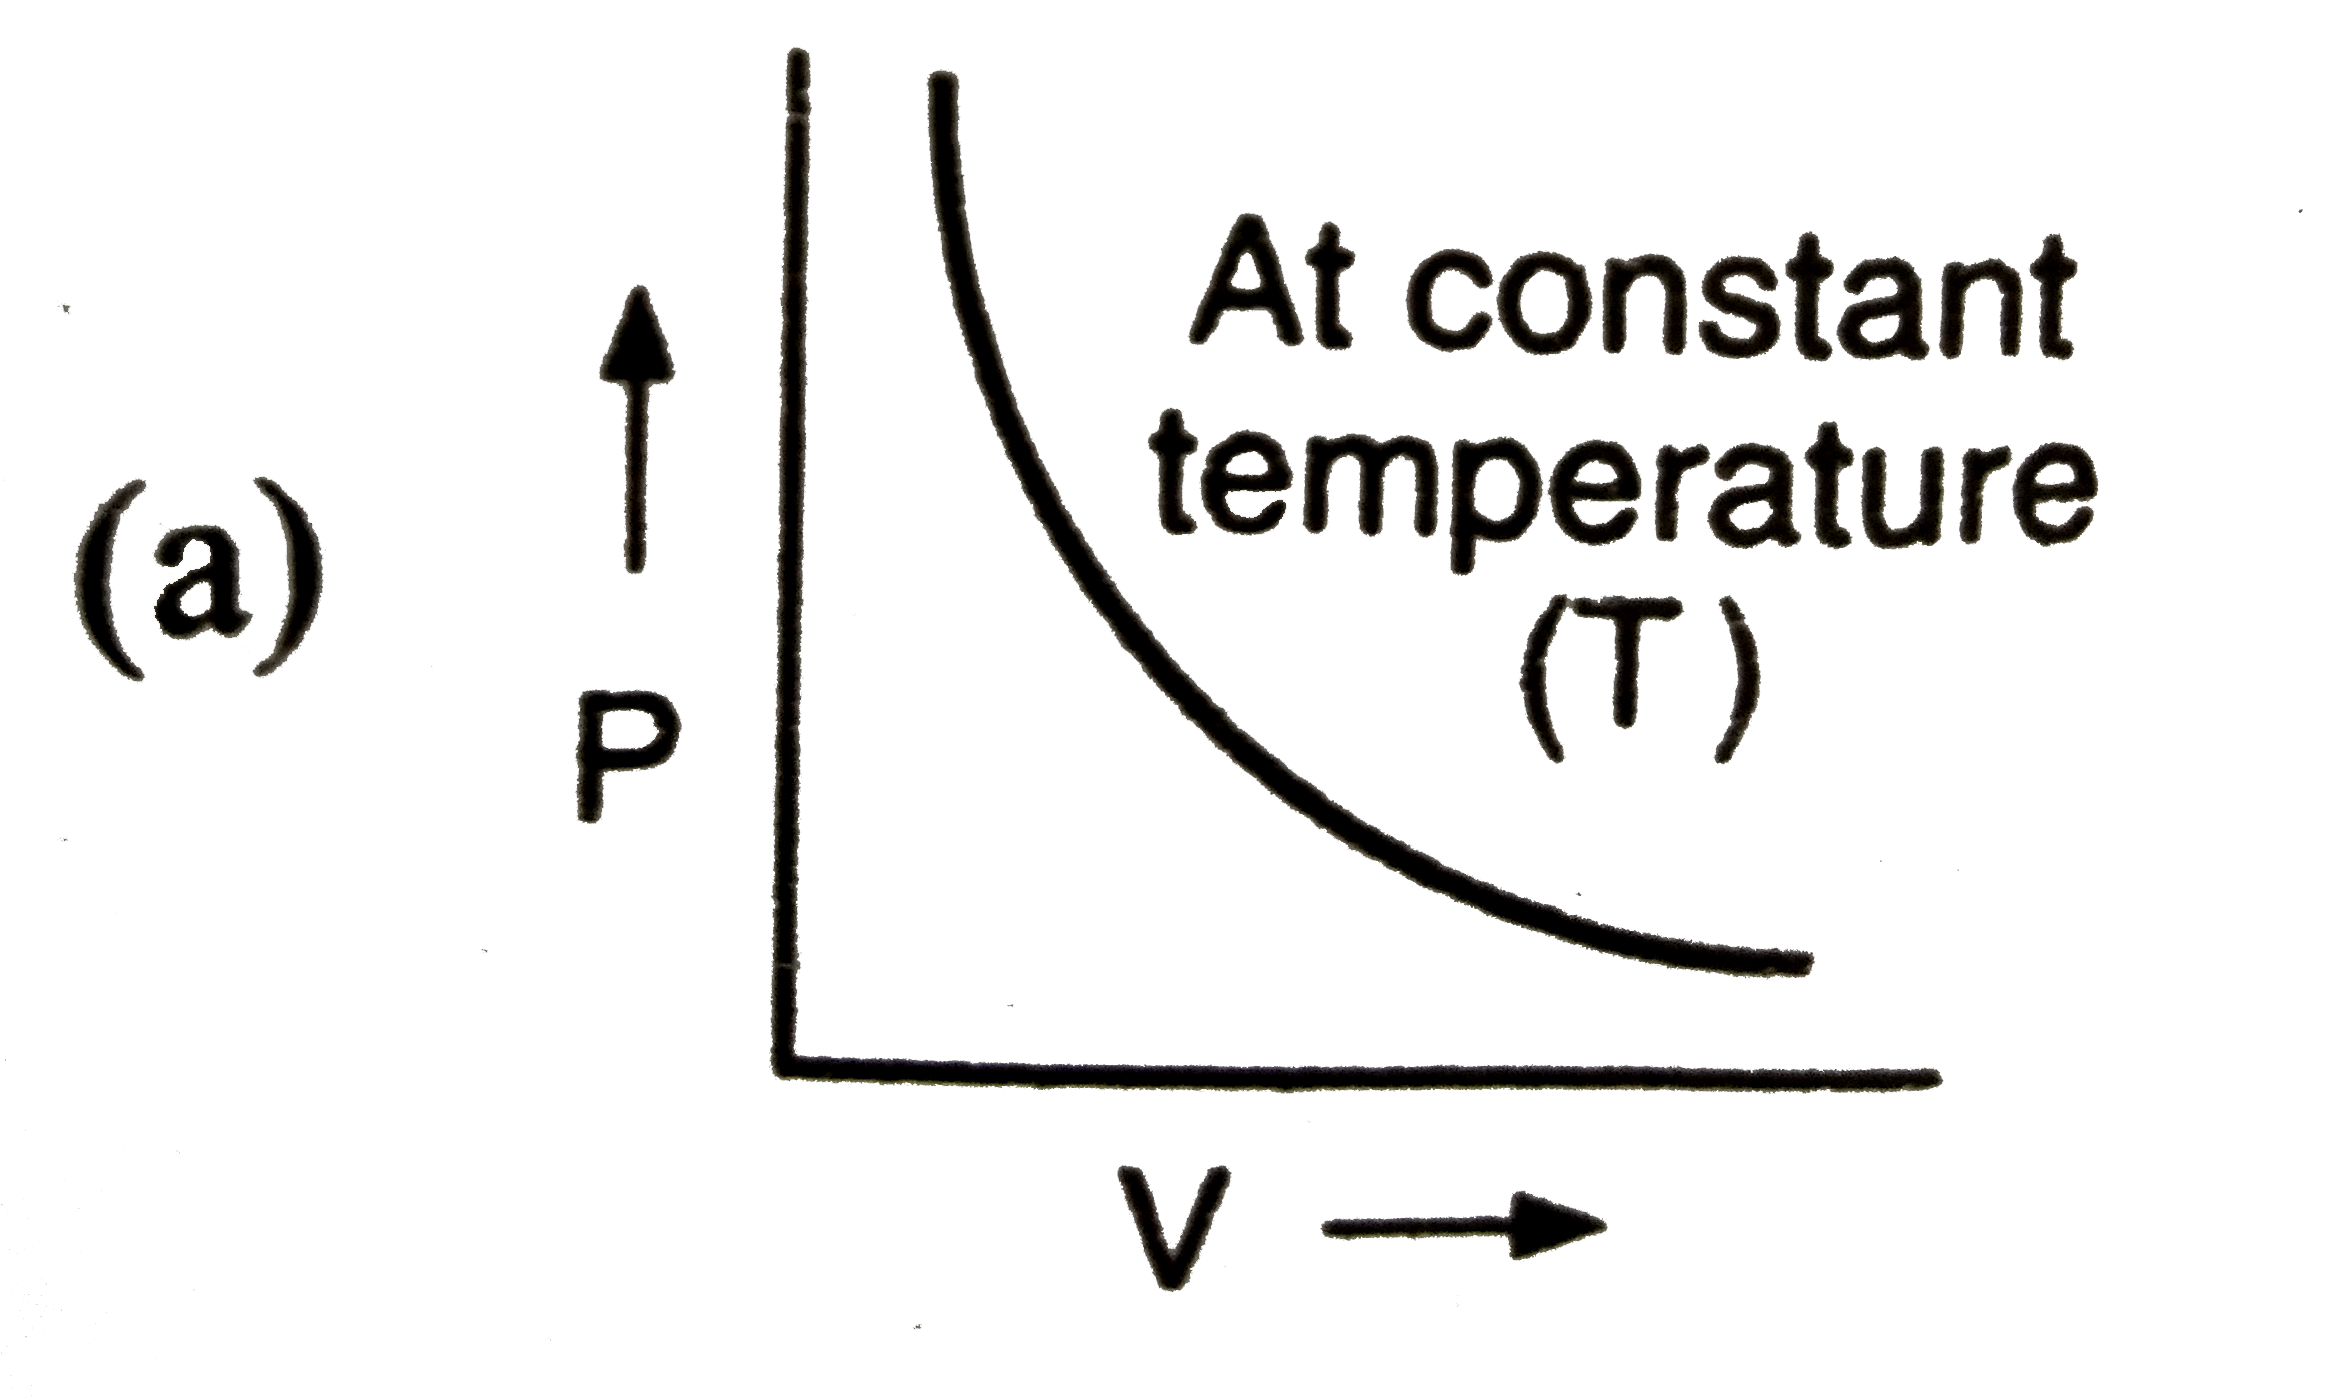 B
B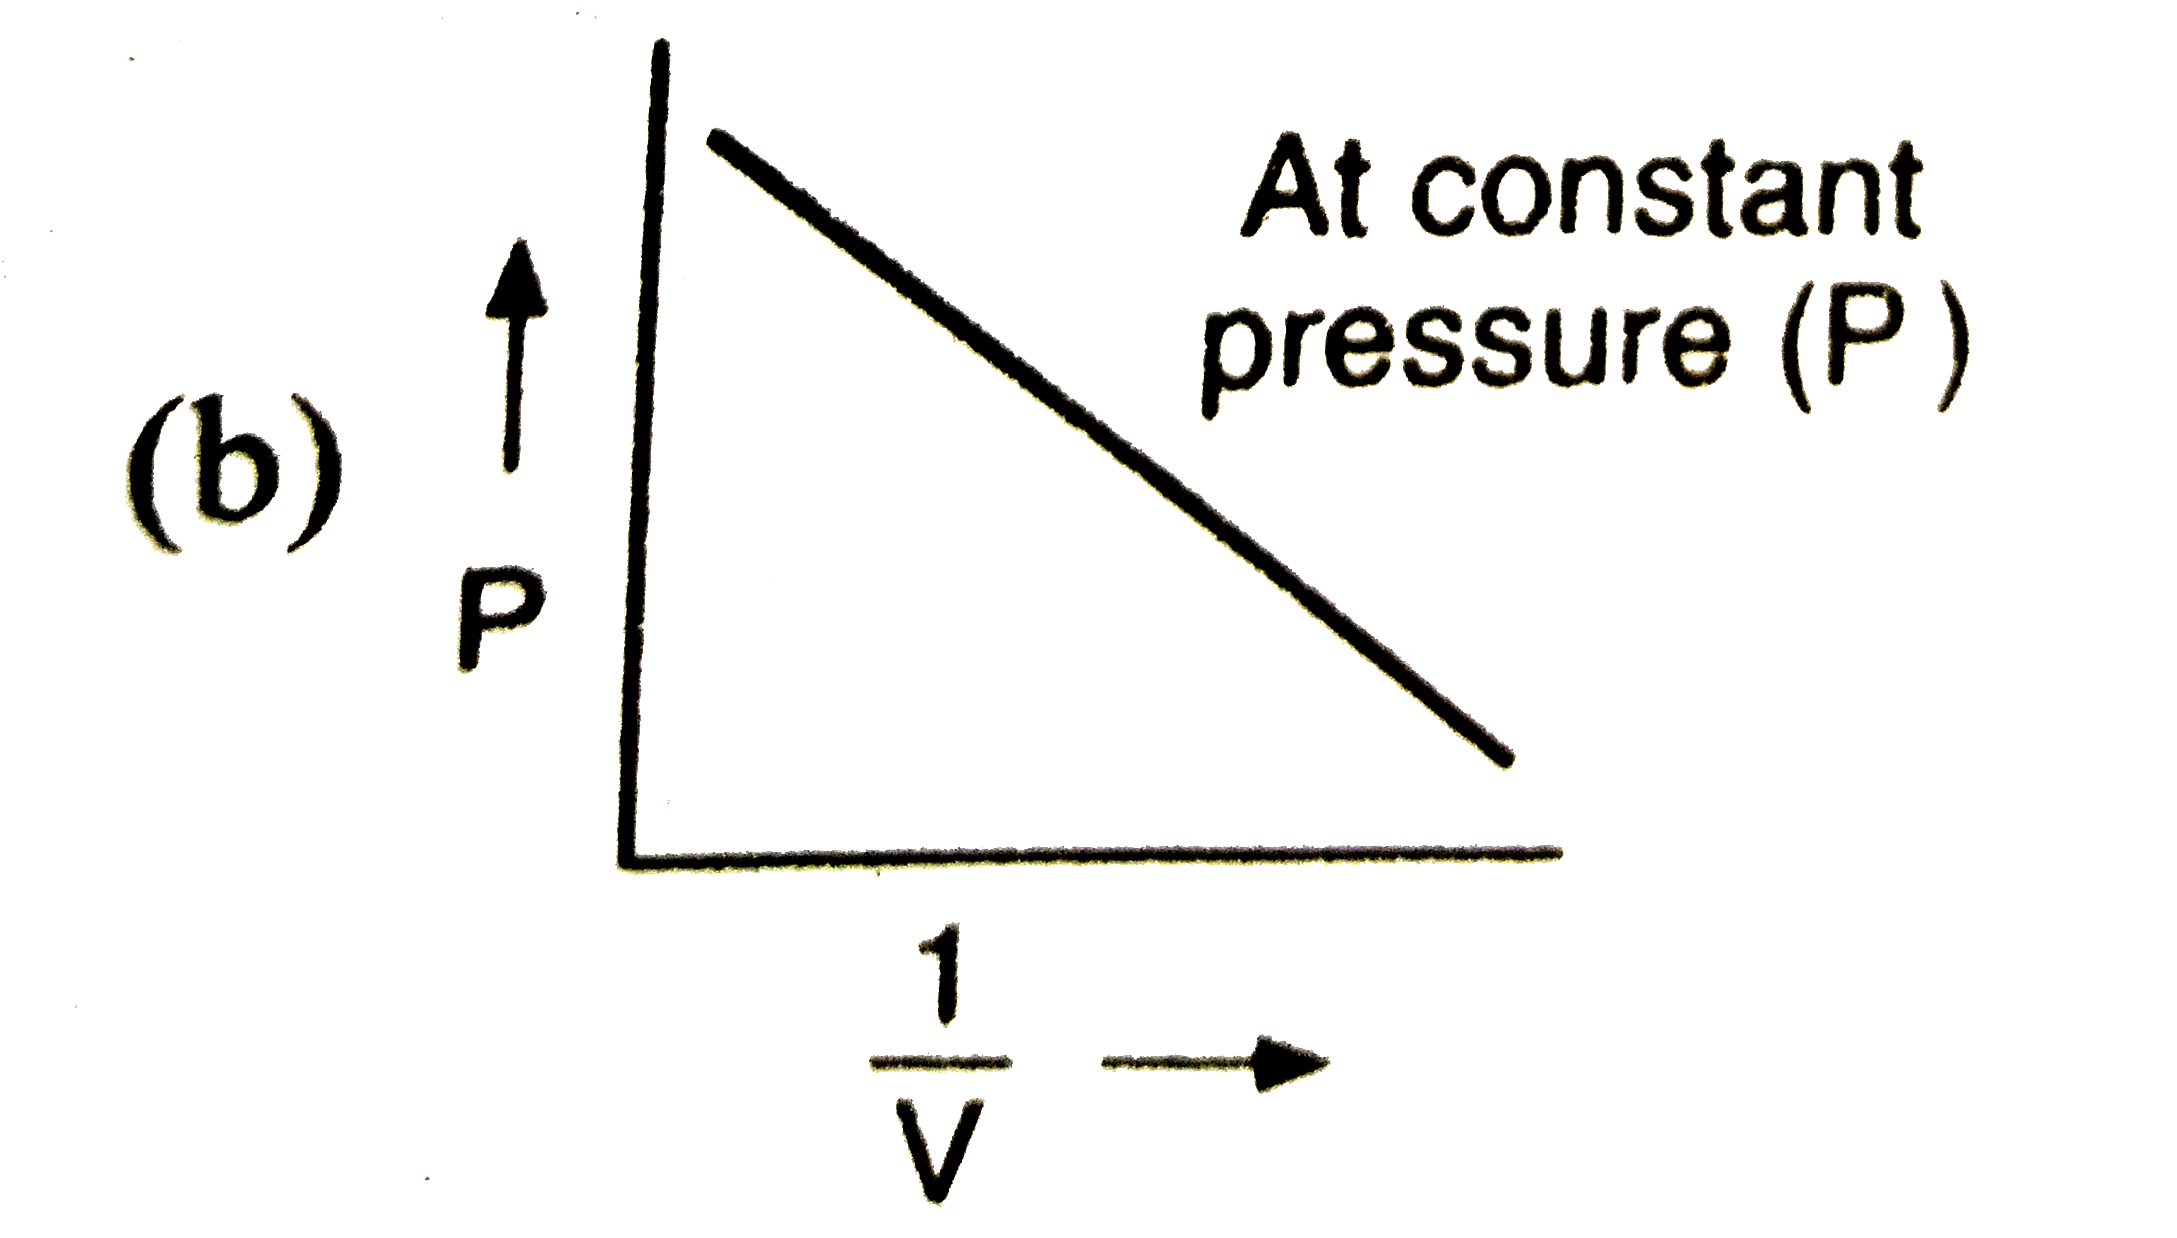 C
C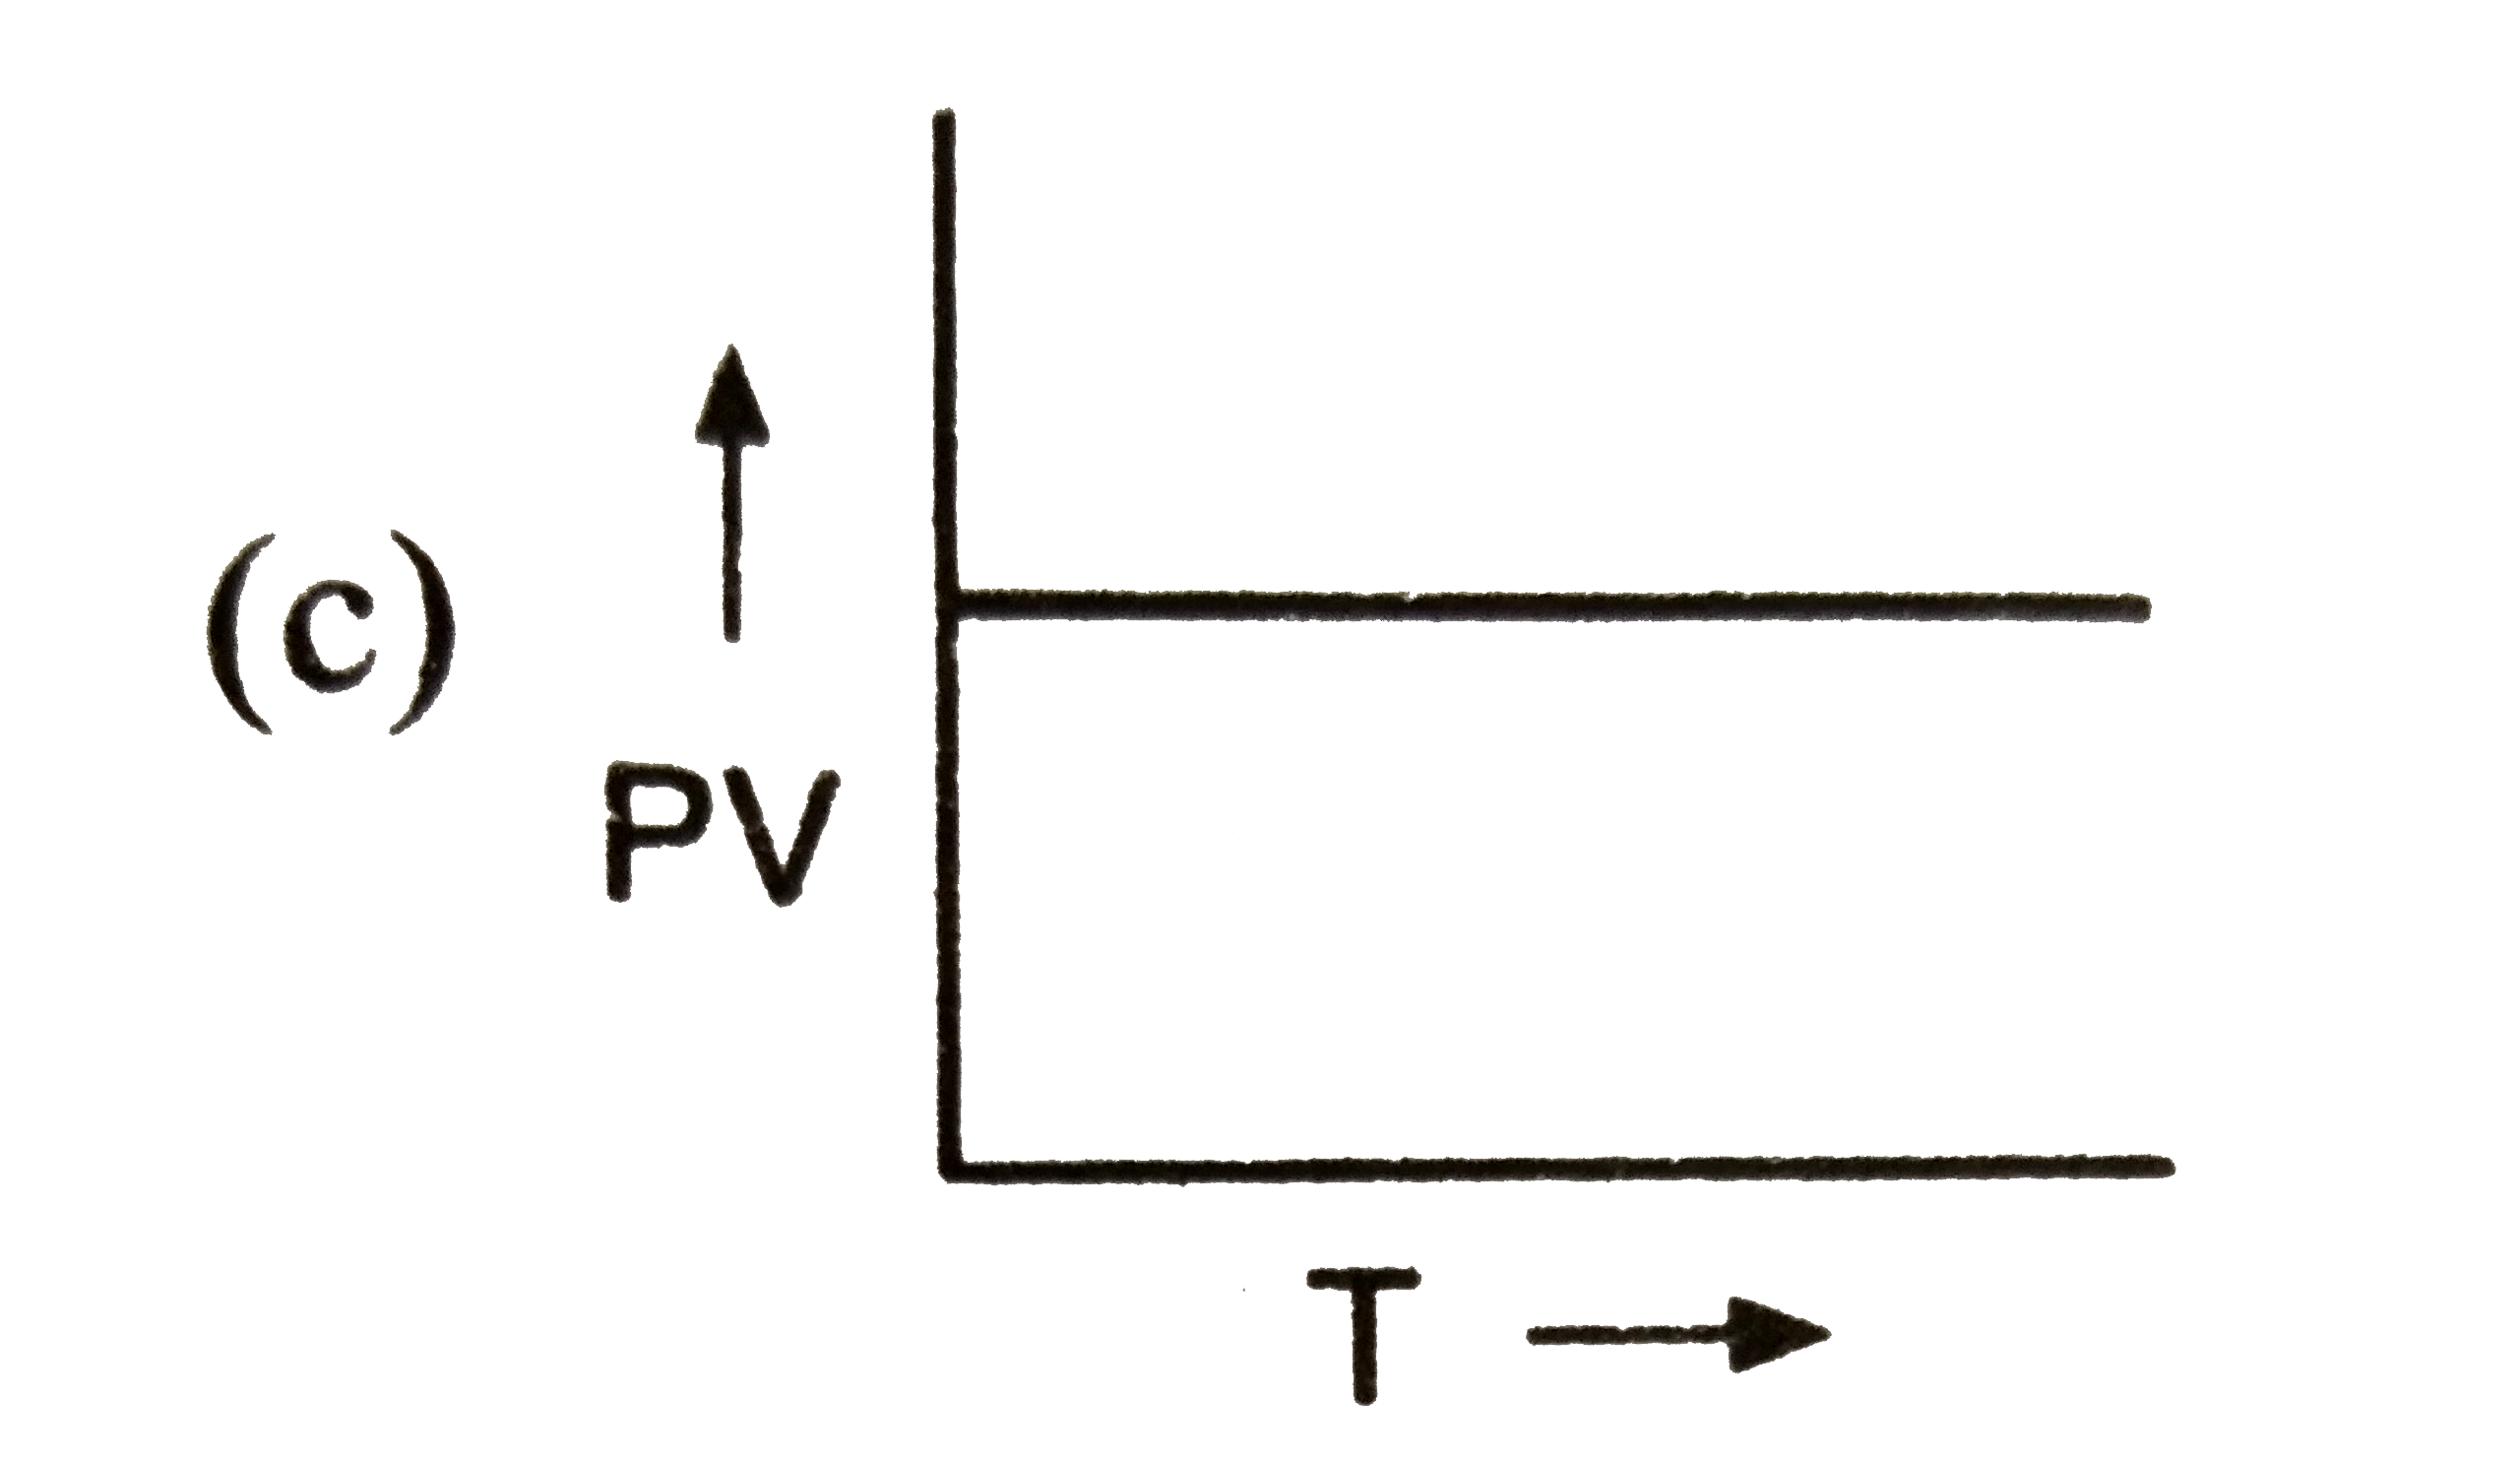 D
D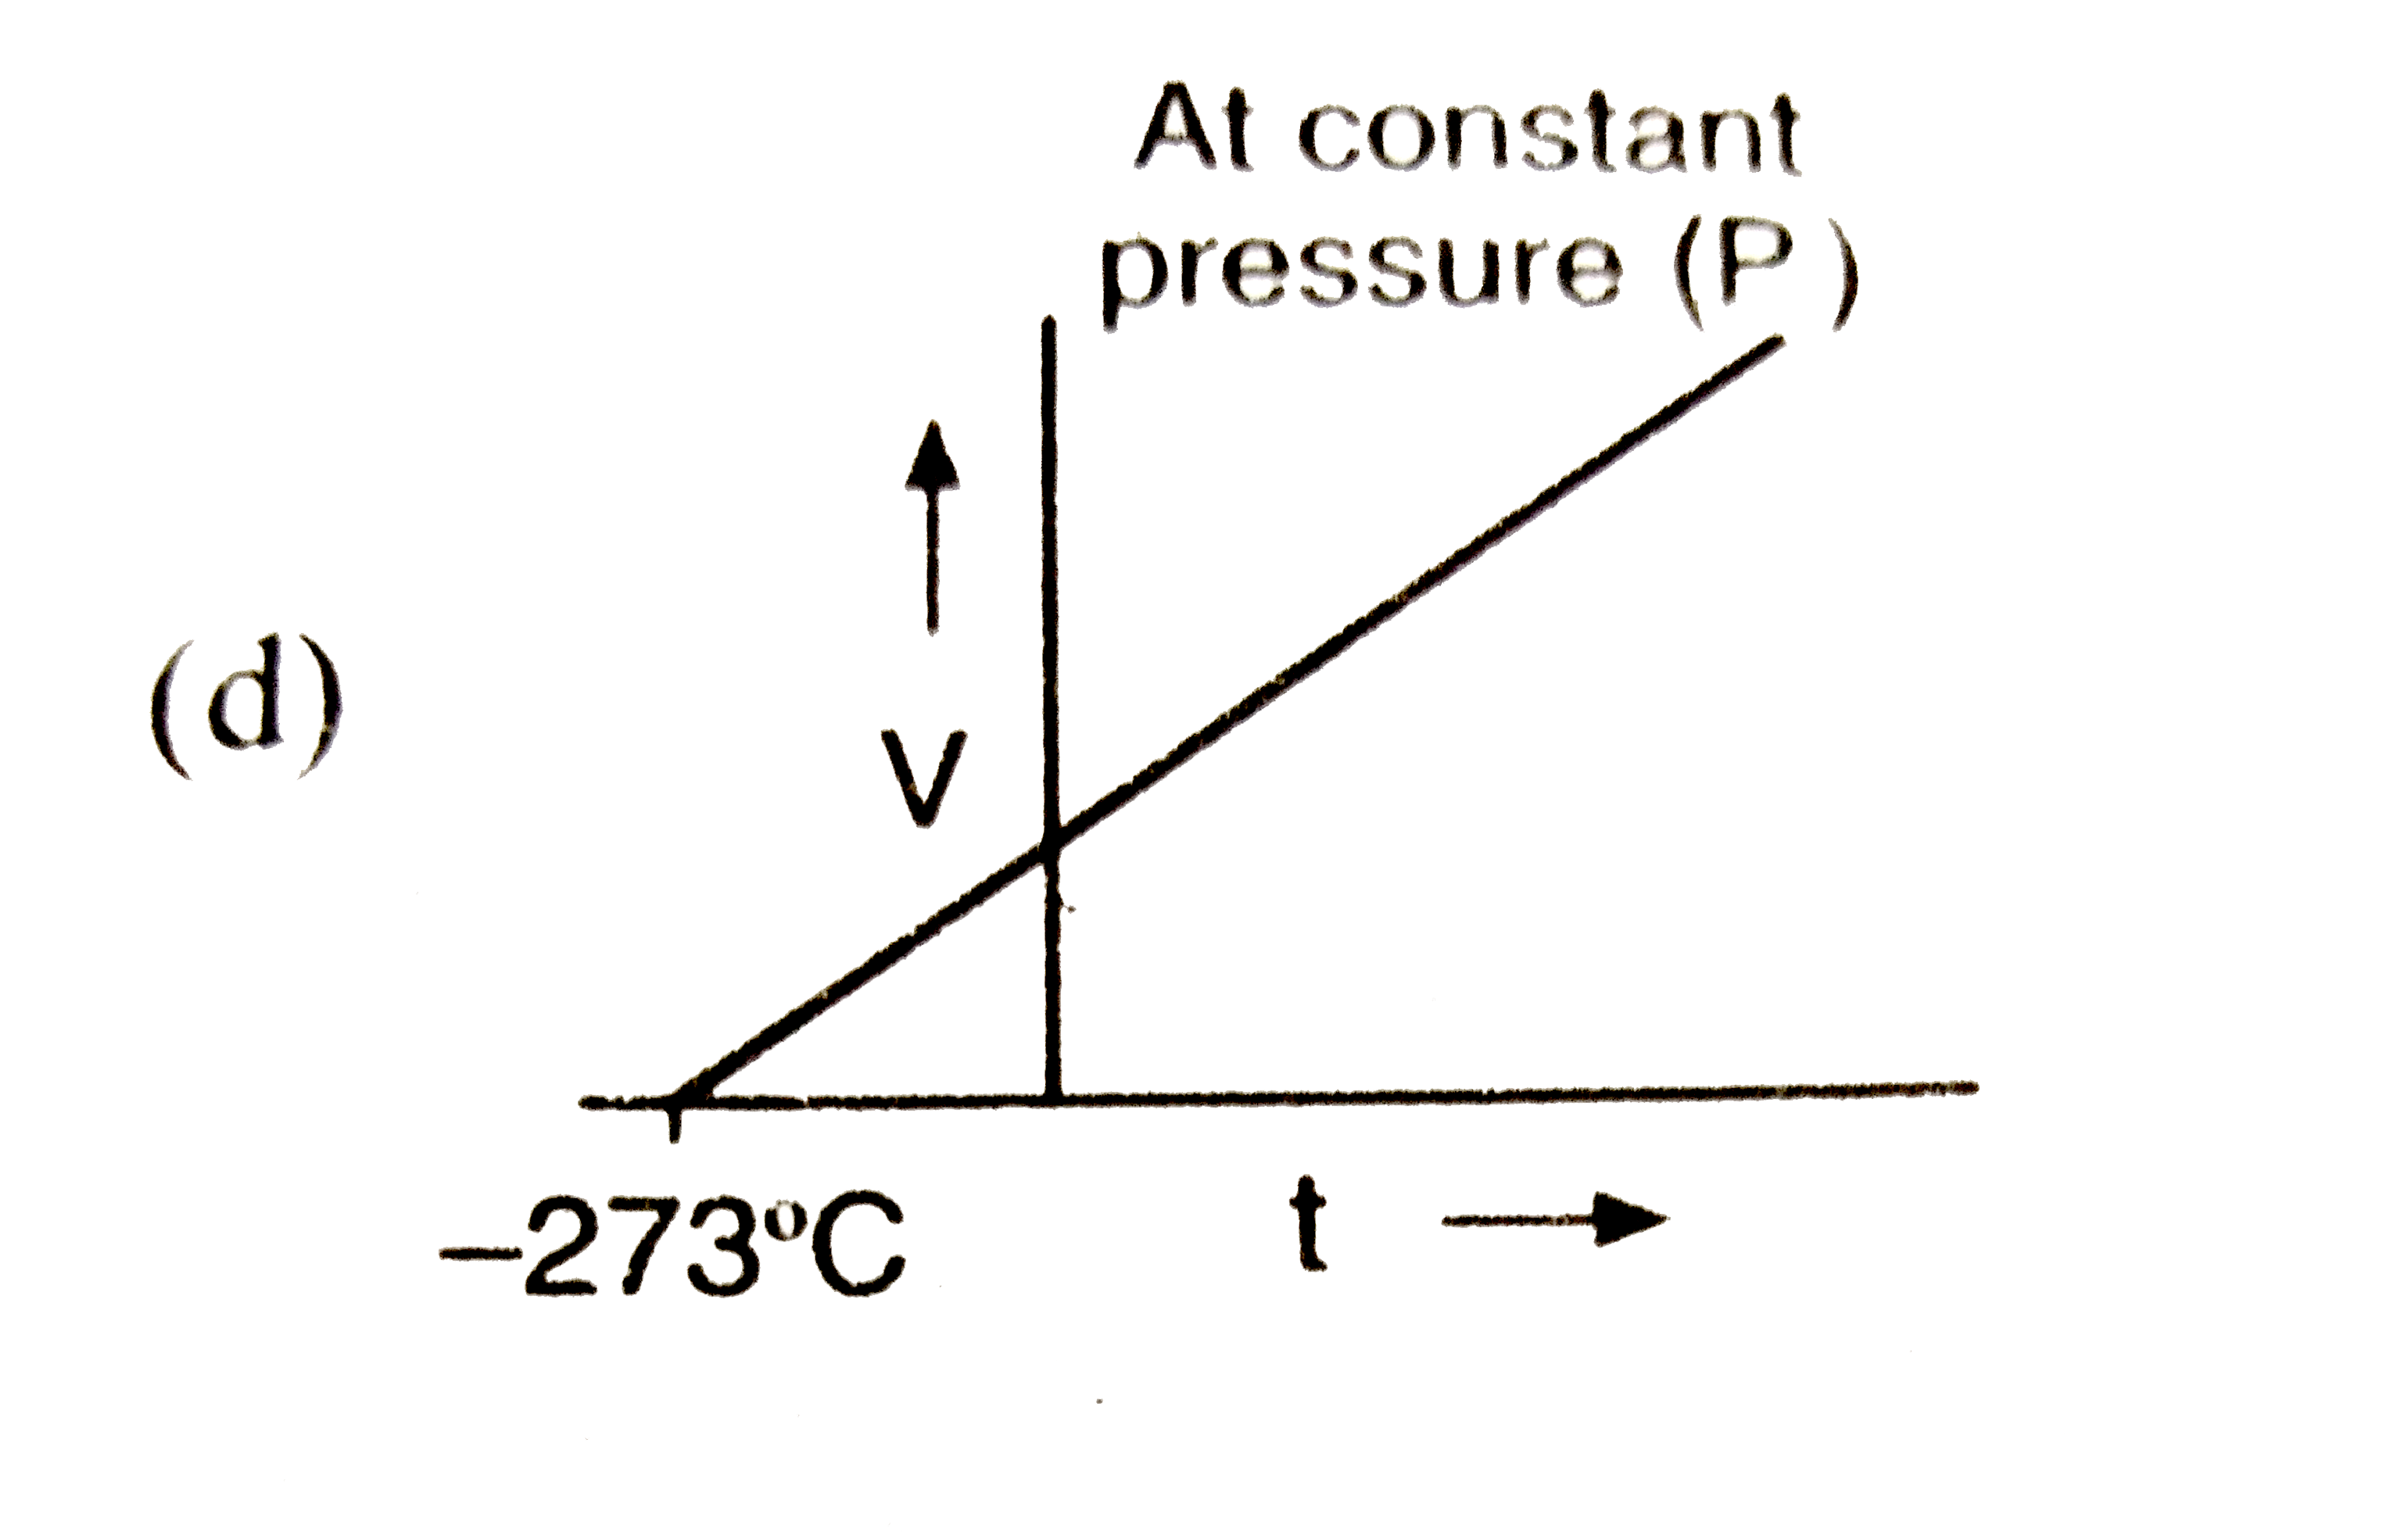
Which of the following plots does not represent the behaviour of an ideal binary liquid solution?
APlot of pA versus xA (mole fraction of A in liquid phase) is linearBPlot of pB versus xB is linearCPlot of ptotal versus xA (or xB) is linearDPlot of ptotal versus xA is non-linearWhich of the following graphs represent the behaviour of an ideal gas ?
A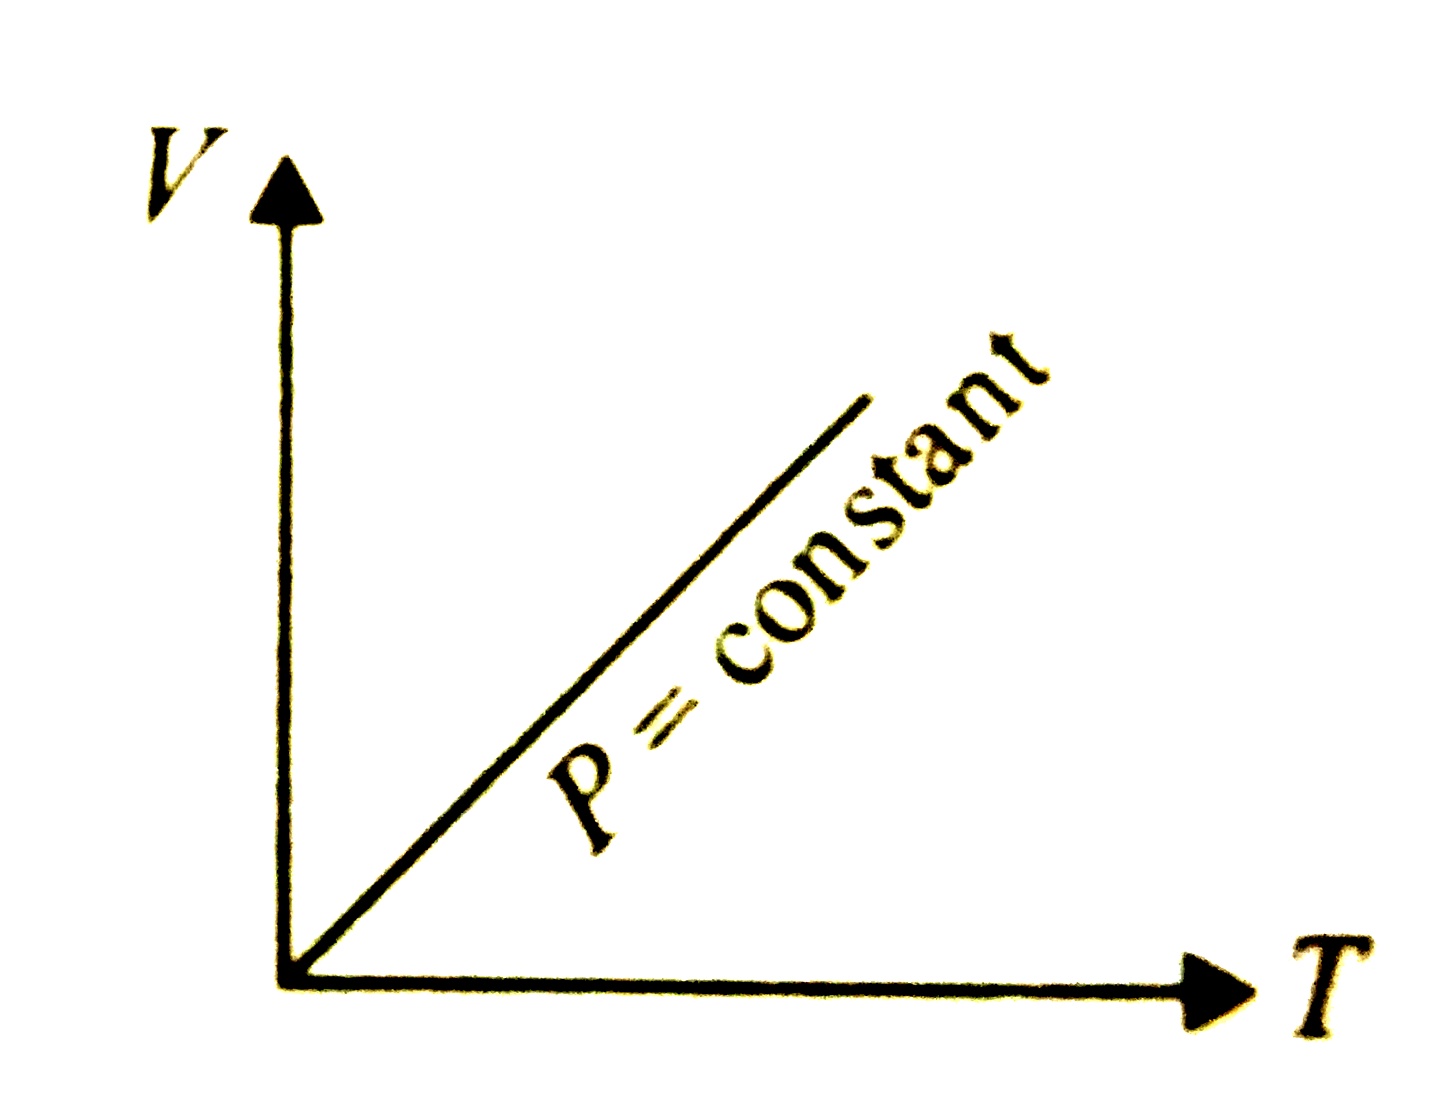 B
B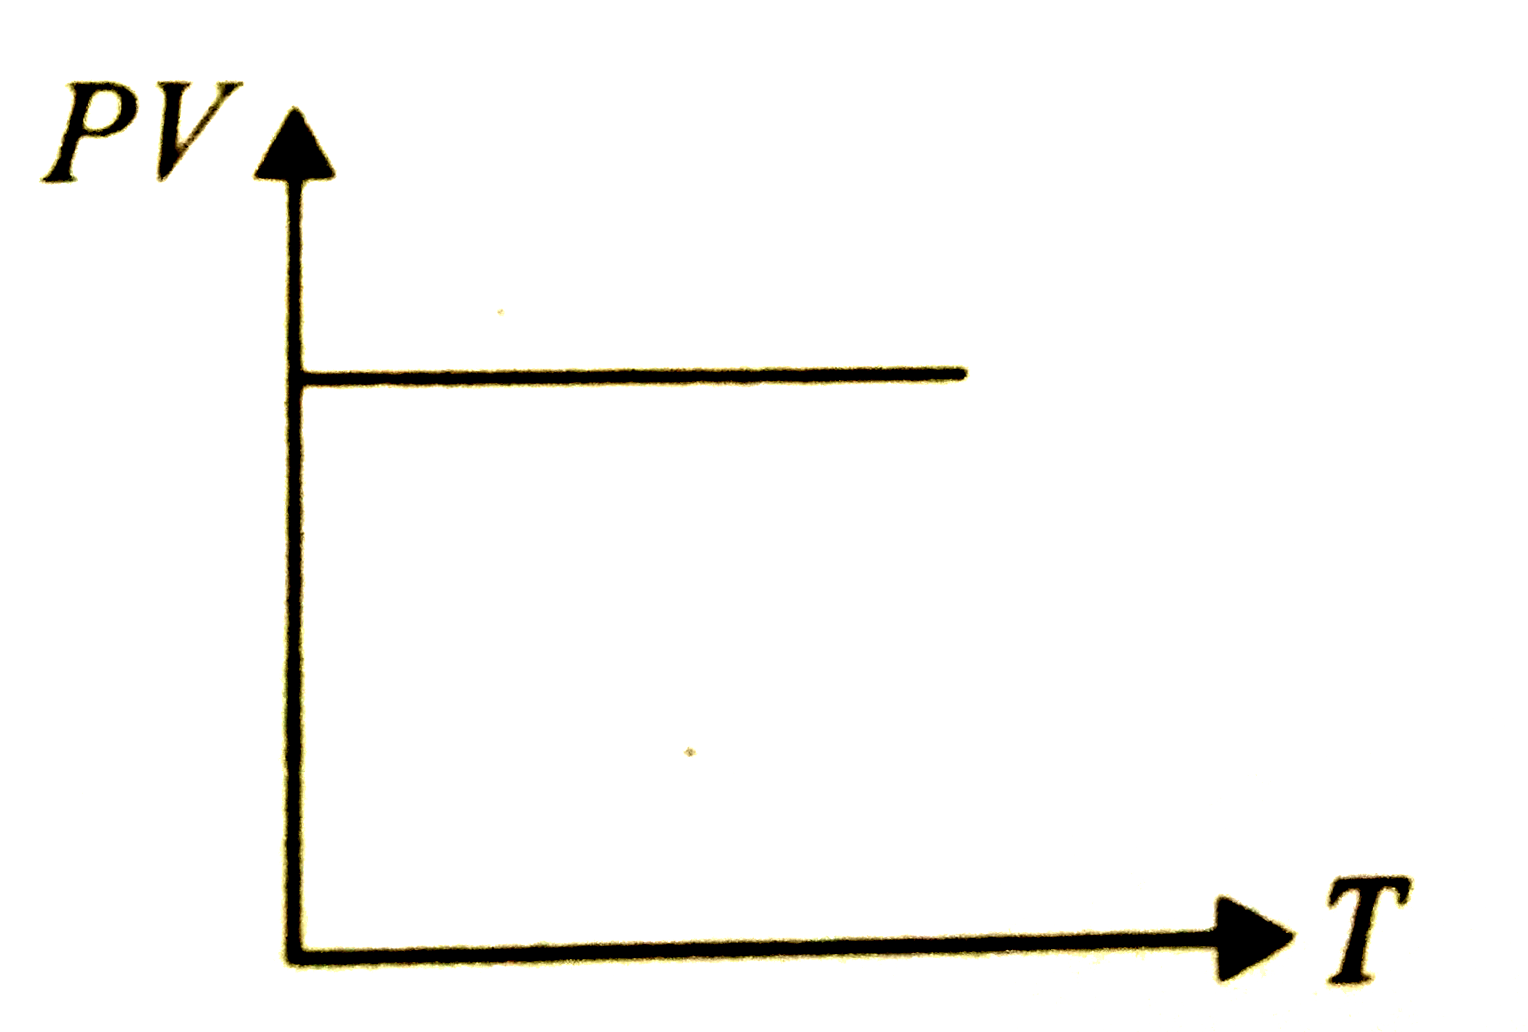 C
C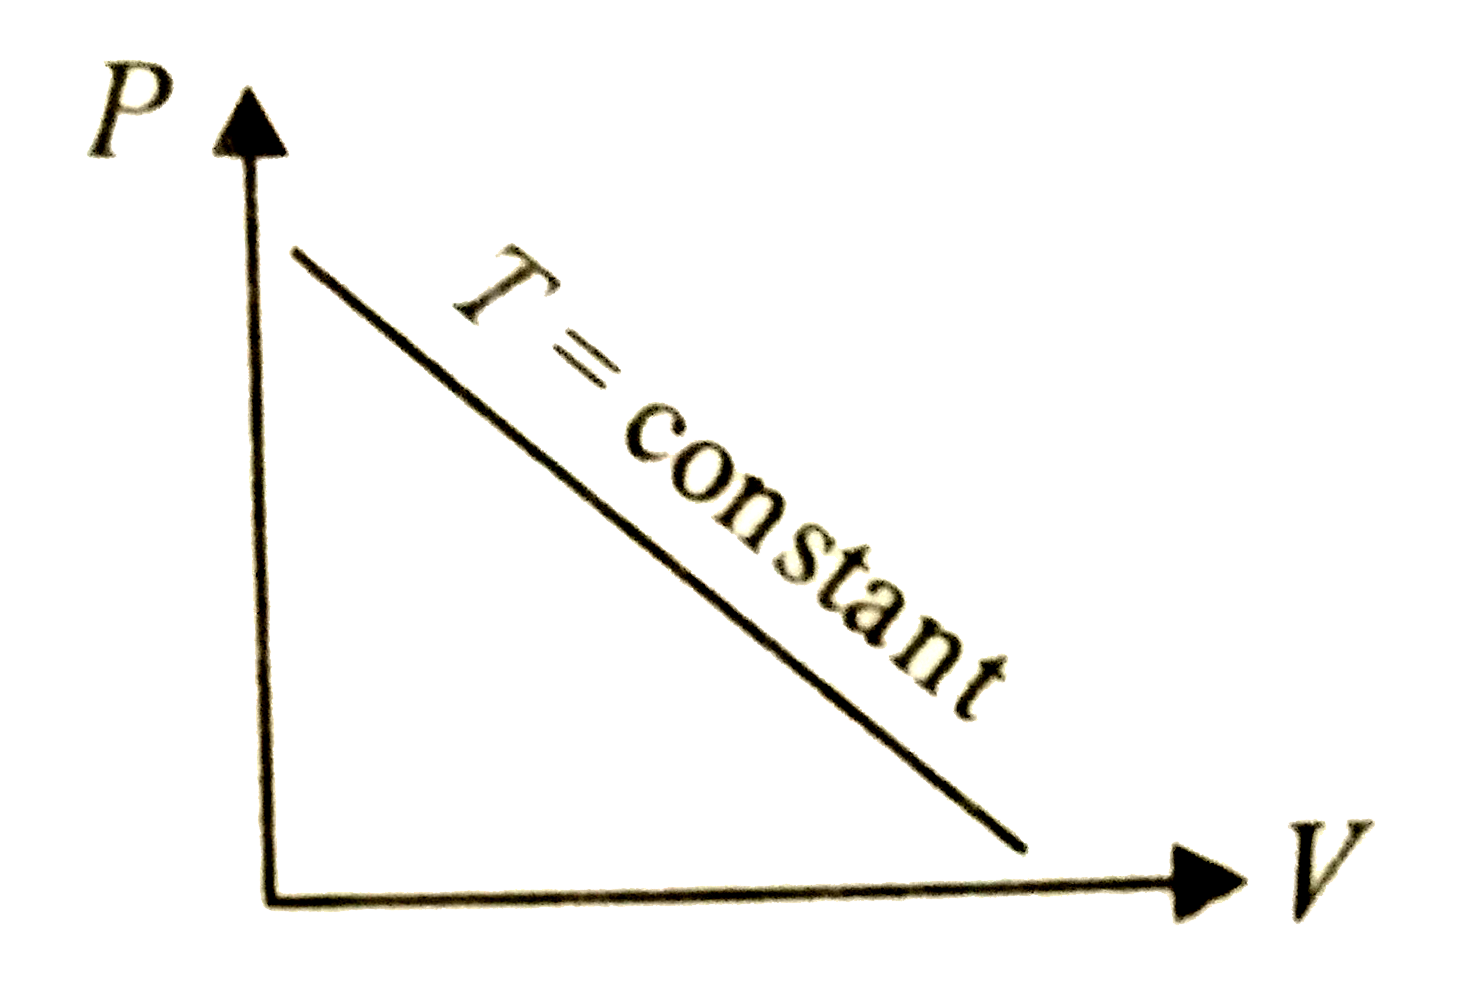 D
D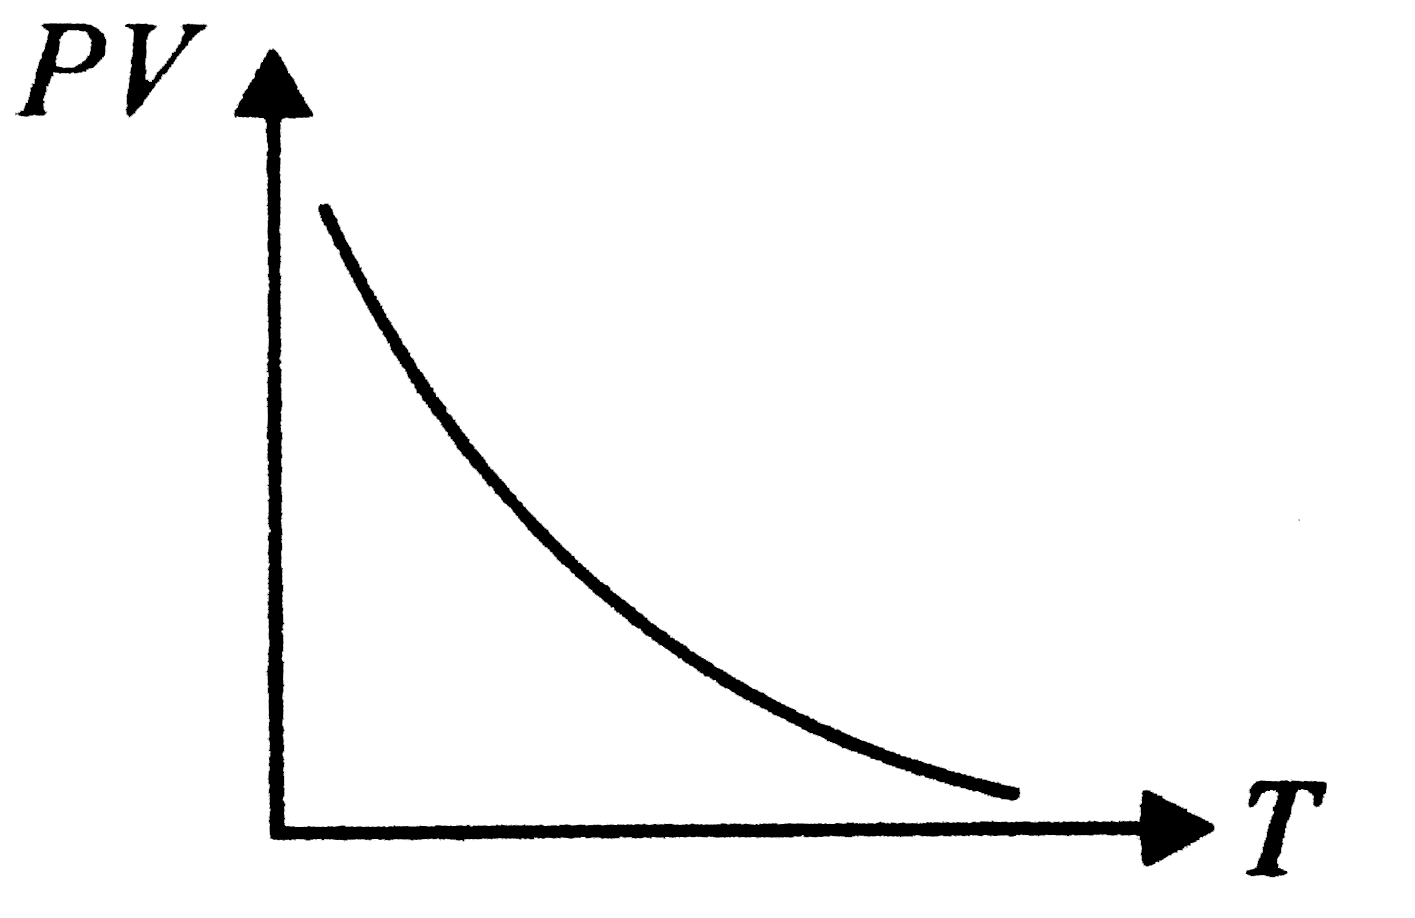
A real gas most closely approaches the behaviour of an ideal gas at:
View SolutionA real gas most closely approaches the behaviour of an ideal gas at:
View SolutionA real gas most closely approaches the behaviour of an ideal gas at ,
View SolutionReal gas will approach the behaviour of ideal gas at
View SolutionReal gas will approach the behaviour of ideal gas at
View Solution

