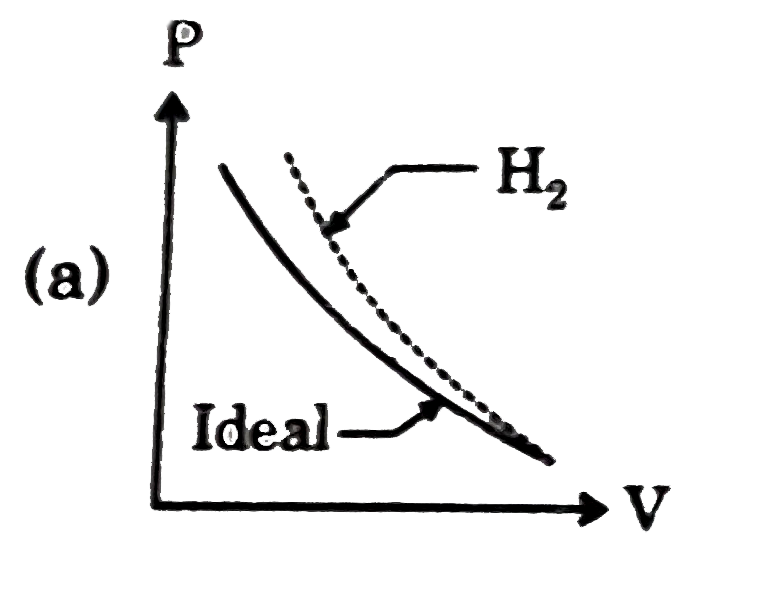
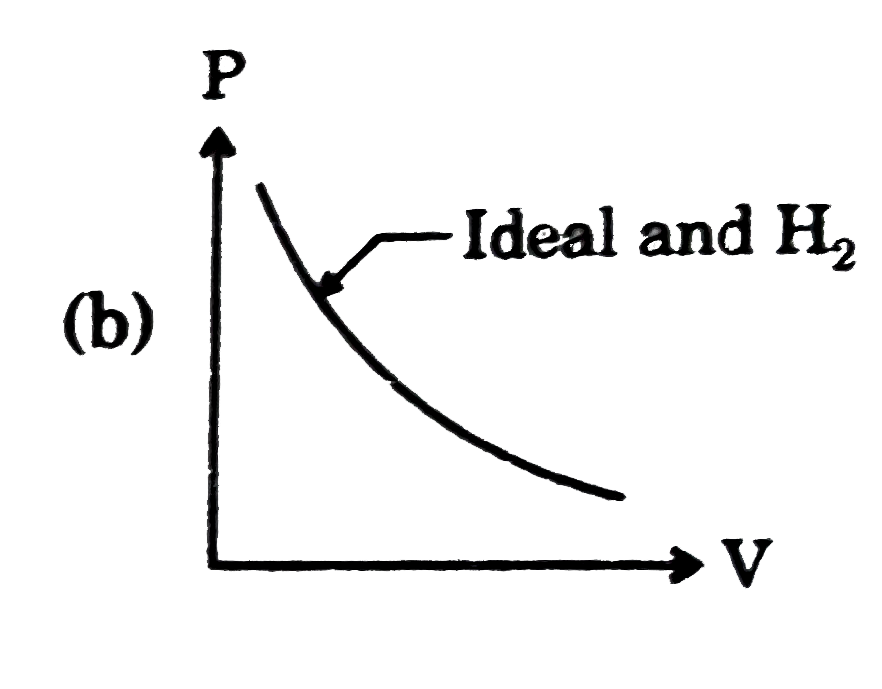
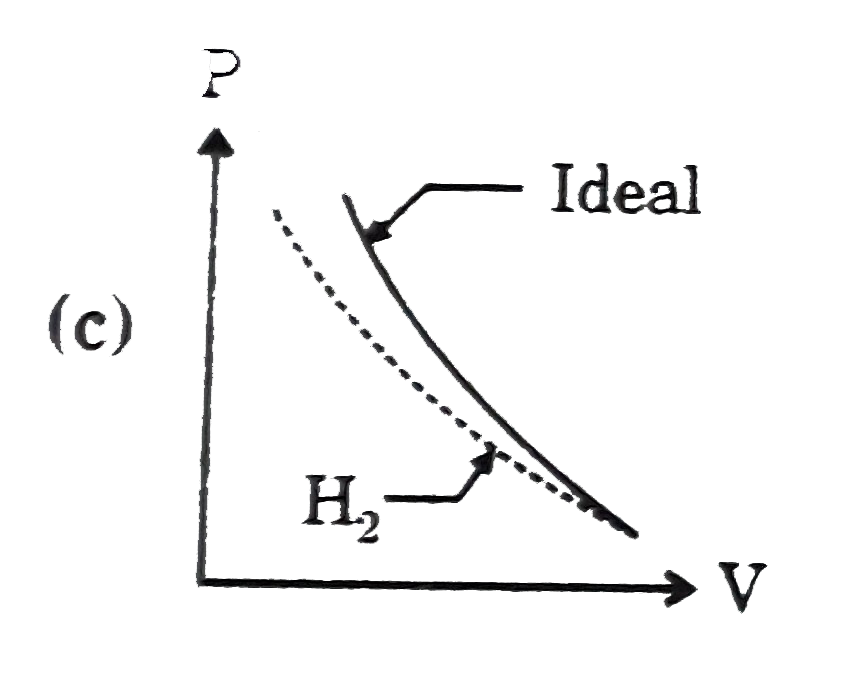
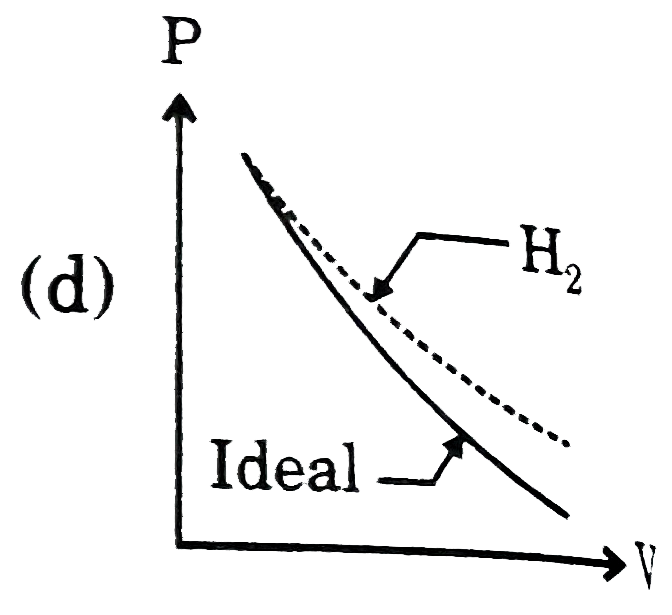
Graph depicting correct behaviour of ideal gas and H2 gas will be (neglect a):
A

B

C

D

Video Solution
Text Solution
The correct Answer is:A
|
Answer
Step by step video, text & image solution for Graph depicting correct behaviour of ideal gas and H_(2) gas will be (neglect a): by Chemistry experts to help you in doubts & scoring excellent marks in Class 12 exams.
Updated on:21/07/2023Topper's Solved these Questions
- GRAPHICAL INTERPRETATIONBook:GRB PUBLICATIONChapter:GRAPHICAL INTERPRETATIONExercise:C. Atomic Sturcture
Explore 1 Video
- GRAPHICAL INTERPRETATIONBook:GRB PUBLICATIONChapter:GRAPHICAL INTERPRETATIONExercise:Atomic Sturcture
Explore 9 Videos
- GRAPHICAL INTERPRETATIONBook:GRB PUBLICATIONChapter:GRAPHICAL INTERPRETATIONExercise:B. Gaseous State
Explore 1 Video
- F-BLOCK ELEMENTSBook:GRB PUBLICATIONChapter:F-BLOCK ELEMENTSExercise:Subjective type
Explore 7 Videos
- HYDROCARBON (ALIPHATIC)Book:GRB PUBLICATIONChapter:HYDROCARBON (ALIPHATIC)Exercise:Previous years jee questions
Explore 28 Videos
Similar Questions
Knowledge Check
Which is (are) correct for ideal gas ?
A(δUδT)P=0B(δTδP)H=0C(δEδV)T=0D(δUδP)T=0Which is (are) correct for ideal gas ?
A(δUδT)P=0B(δUδT)H=0C(δEδV)T=0D(δUδP)T=0Real gas will approach the behaviour of ideal gas at
Alow temperature and high pressureBhigh temperature and low pressureClow temperature and low pressureDhigh temperature and high pressure
The deviation from the ideal gas behaviour of a gas can be expressed as
View SolutionSelect the correct alternatives for an ideal gas :
View SolutionThe graph that does not repersent the behaviour of an ideal gas is-
View SolutionReal ggas show same behaviour as that of an ideal gas at
View SolutionThe deviation from the ideal gas behaviour of a gas can be expressed as
View Solution

