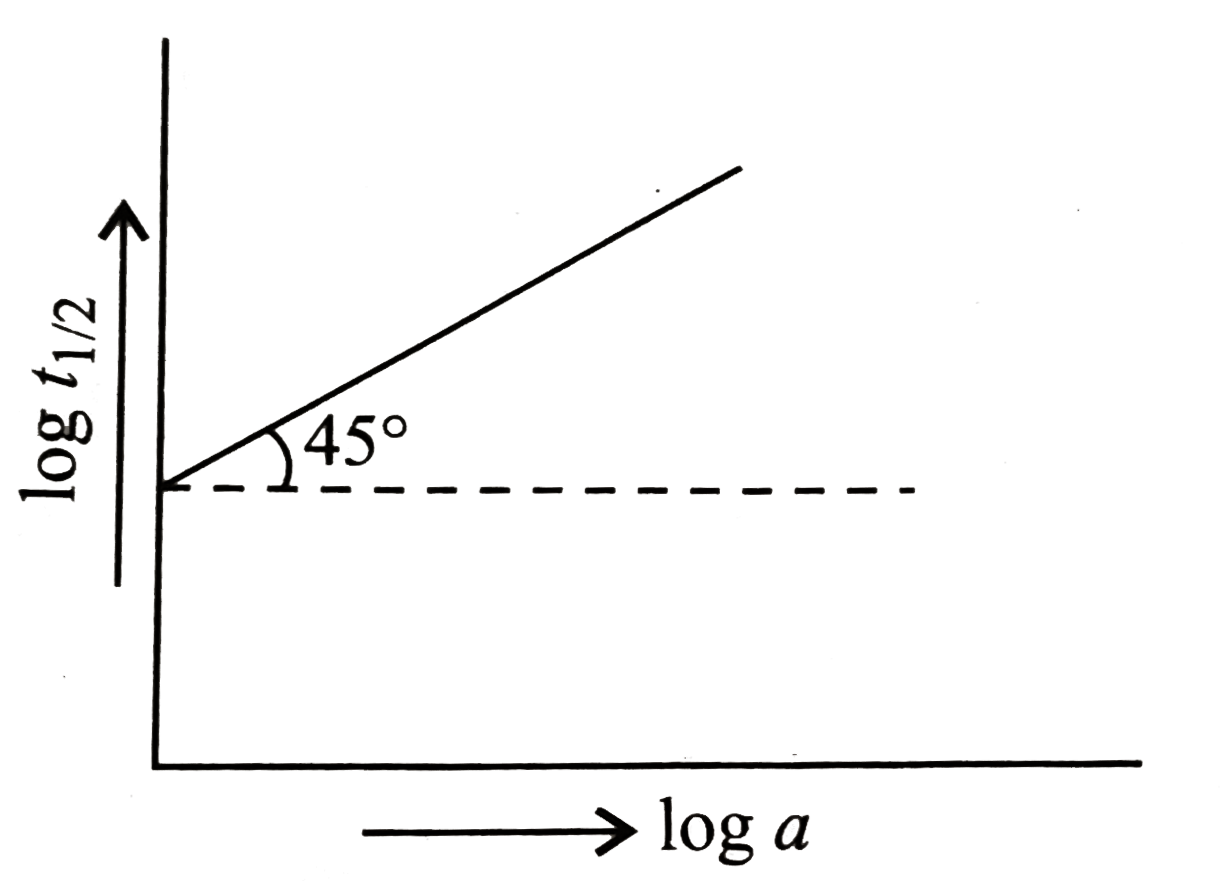
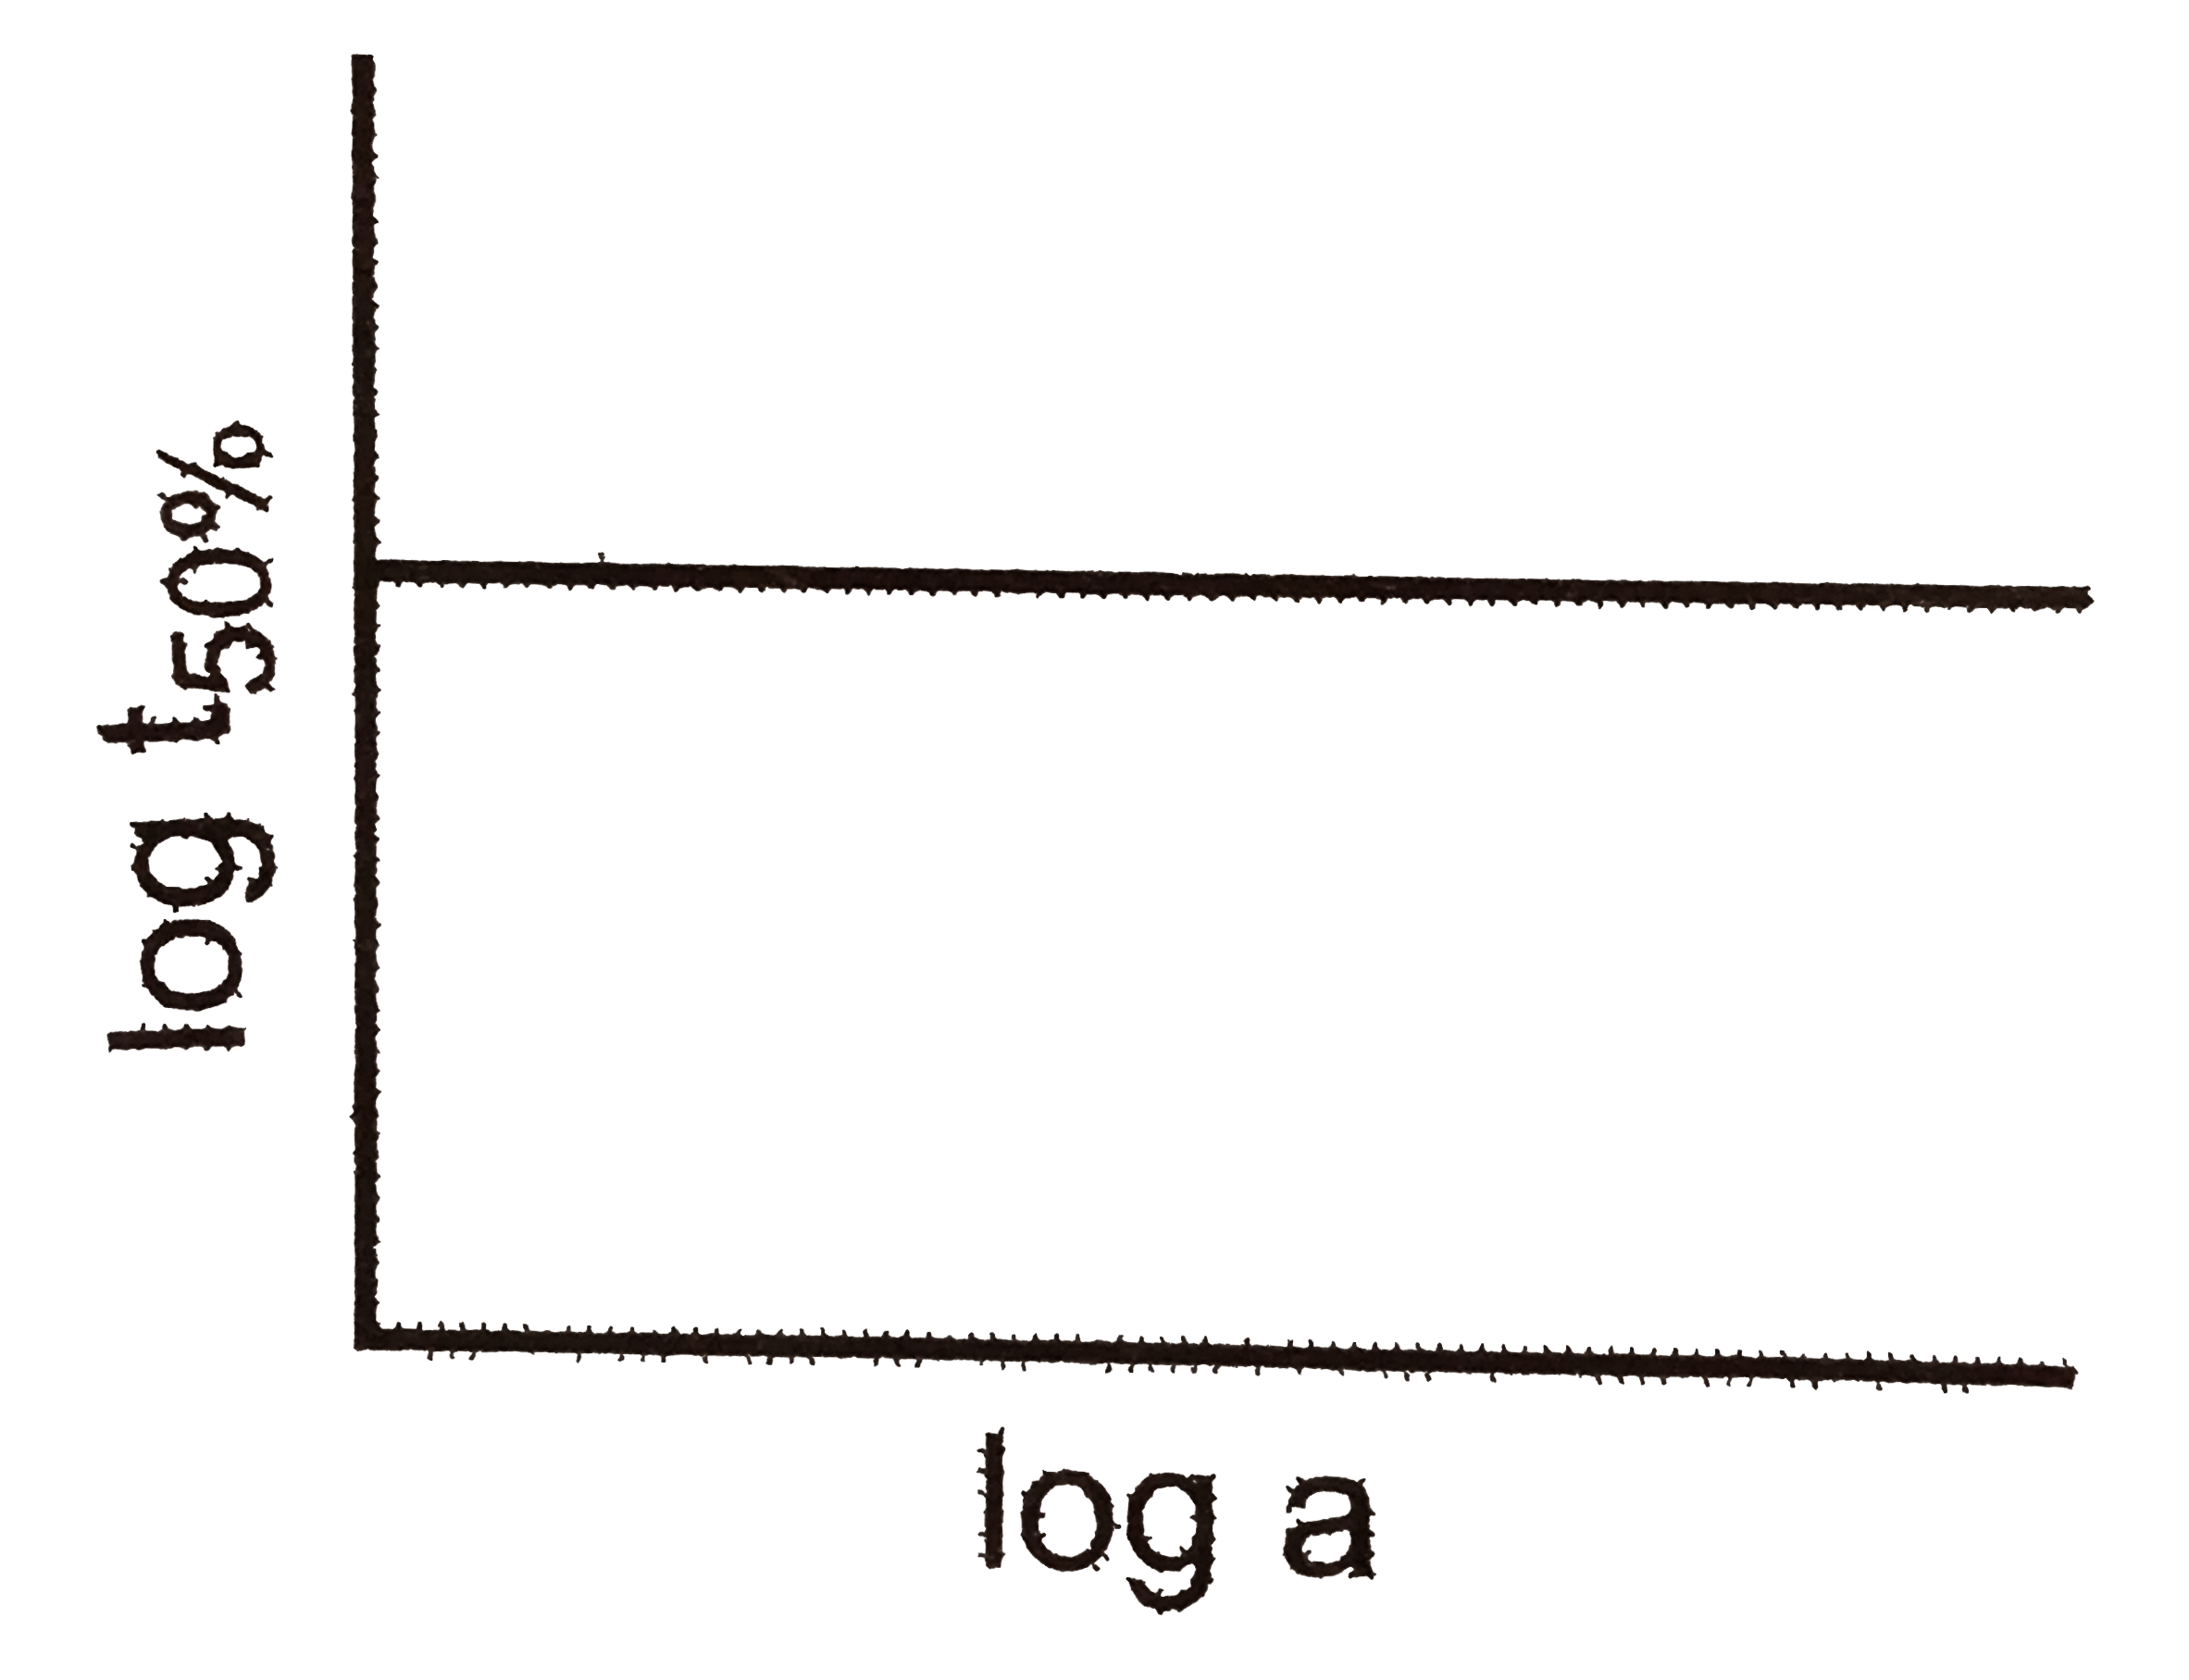
Following is the graph between logT50 and loga (a= initial concentration) for a given reaction at 27∘C. Hence order is
0
1
2
3
The correct Answer is:A
Step by step video, text & image solution for Following is the graph between log T_(50) and log a (a = initial concentration) for a given reaction at 27^(@)C. Hence order is by Chemistry experts to help you in doubts & scoring excellent marks in Class 12 exams.
Updated on:21/07/2023Topper's Solved these Questions
- CHEMICAL KINETICSBOOK - OP TANDONCHAPTER - CHEMICAL KINETICSEXERCISE - OBJECTIVE QUESTIONS (LEVEL-B) SET I
48 Videos
- CHEMICAL KINETICSBOOK - OP TANDONCHAPTER - CHEMICAL KINETICSEXERCISE - OBJECTIVE QUESTIONS (LEVEL-B) SET II
13 Videos
- CHEMICAL KINETICSBOOK - OP TANDONCHAPTER - CHEMICAL KINETICSEXERCISE - PRACTICE PROBLEMS
70 Videos
- CARBOXYLIC ACIDS AND THEIR DERIVATIVESBOOK - OP TANDONCHAPTER - CARBOXYLIC ACIDS AND THEIR DERIVATIVESEXERCISE - Integer
4 Videos
- Chemical Thermodynamics and ThermochemistryBOOK - OP TANDONCHAPTER - Chemical Thermodynamics and ThermochemistryEXERCISE - Self Assessment (Integer type).
3 Videos
Similar Questions
Knowledge Check
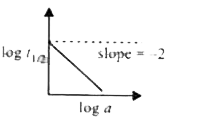
A graph between log t1/2 and log a (abscissa), a being the initial concentration of A in the reaction A → product, is depicted in the figure. The rate law is
 A−d[A]dt=kB−d[A]dt=k[A]C−d[A]dt=k[A]2D−d[A]dt=k[A]3
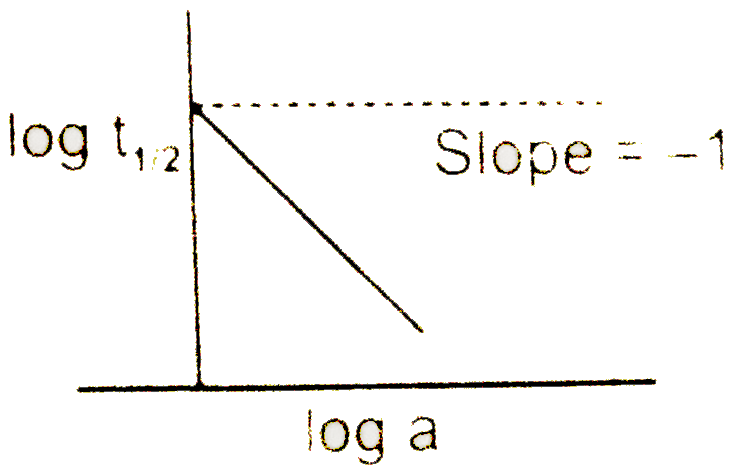
A graph between logt12 and log a (abscissa), a being the initial concentration of A in the reaction For reaction A→Product, the rate law is :
 A−d[A]dt=KB−d[A]dt=K[A]C−d[A]dt=K[A]2D−d[A]dt=K[A]3
A graph between logt12 and log a (abscissa), a being the initial concentration of A in the reaction For reaction A→Product, the rate law is :
 A−d[A]dt=kB−d[A]dt=k[A]C−d[A]dt=k[A]2D−d[A]dt=k[A]3
What is the type of graph between log P and log V at constant temperature?
View SolutionWhat is the type of graph between log P and log(1V) at constant temperature for a given amount of gas ?
View SolutionThe graph between log t1/2 and log a at a given temperature is
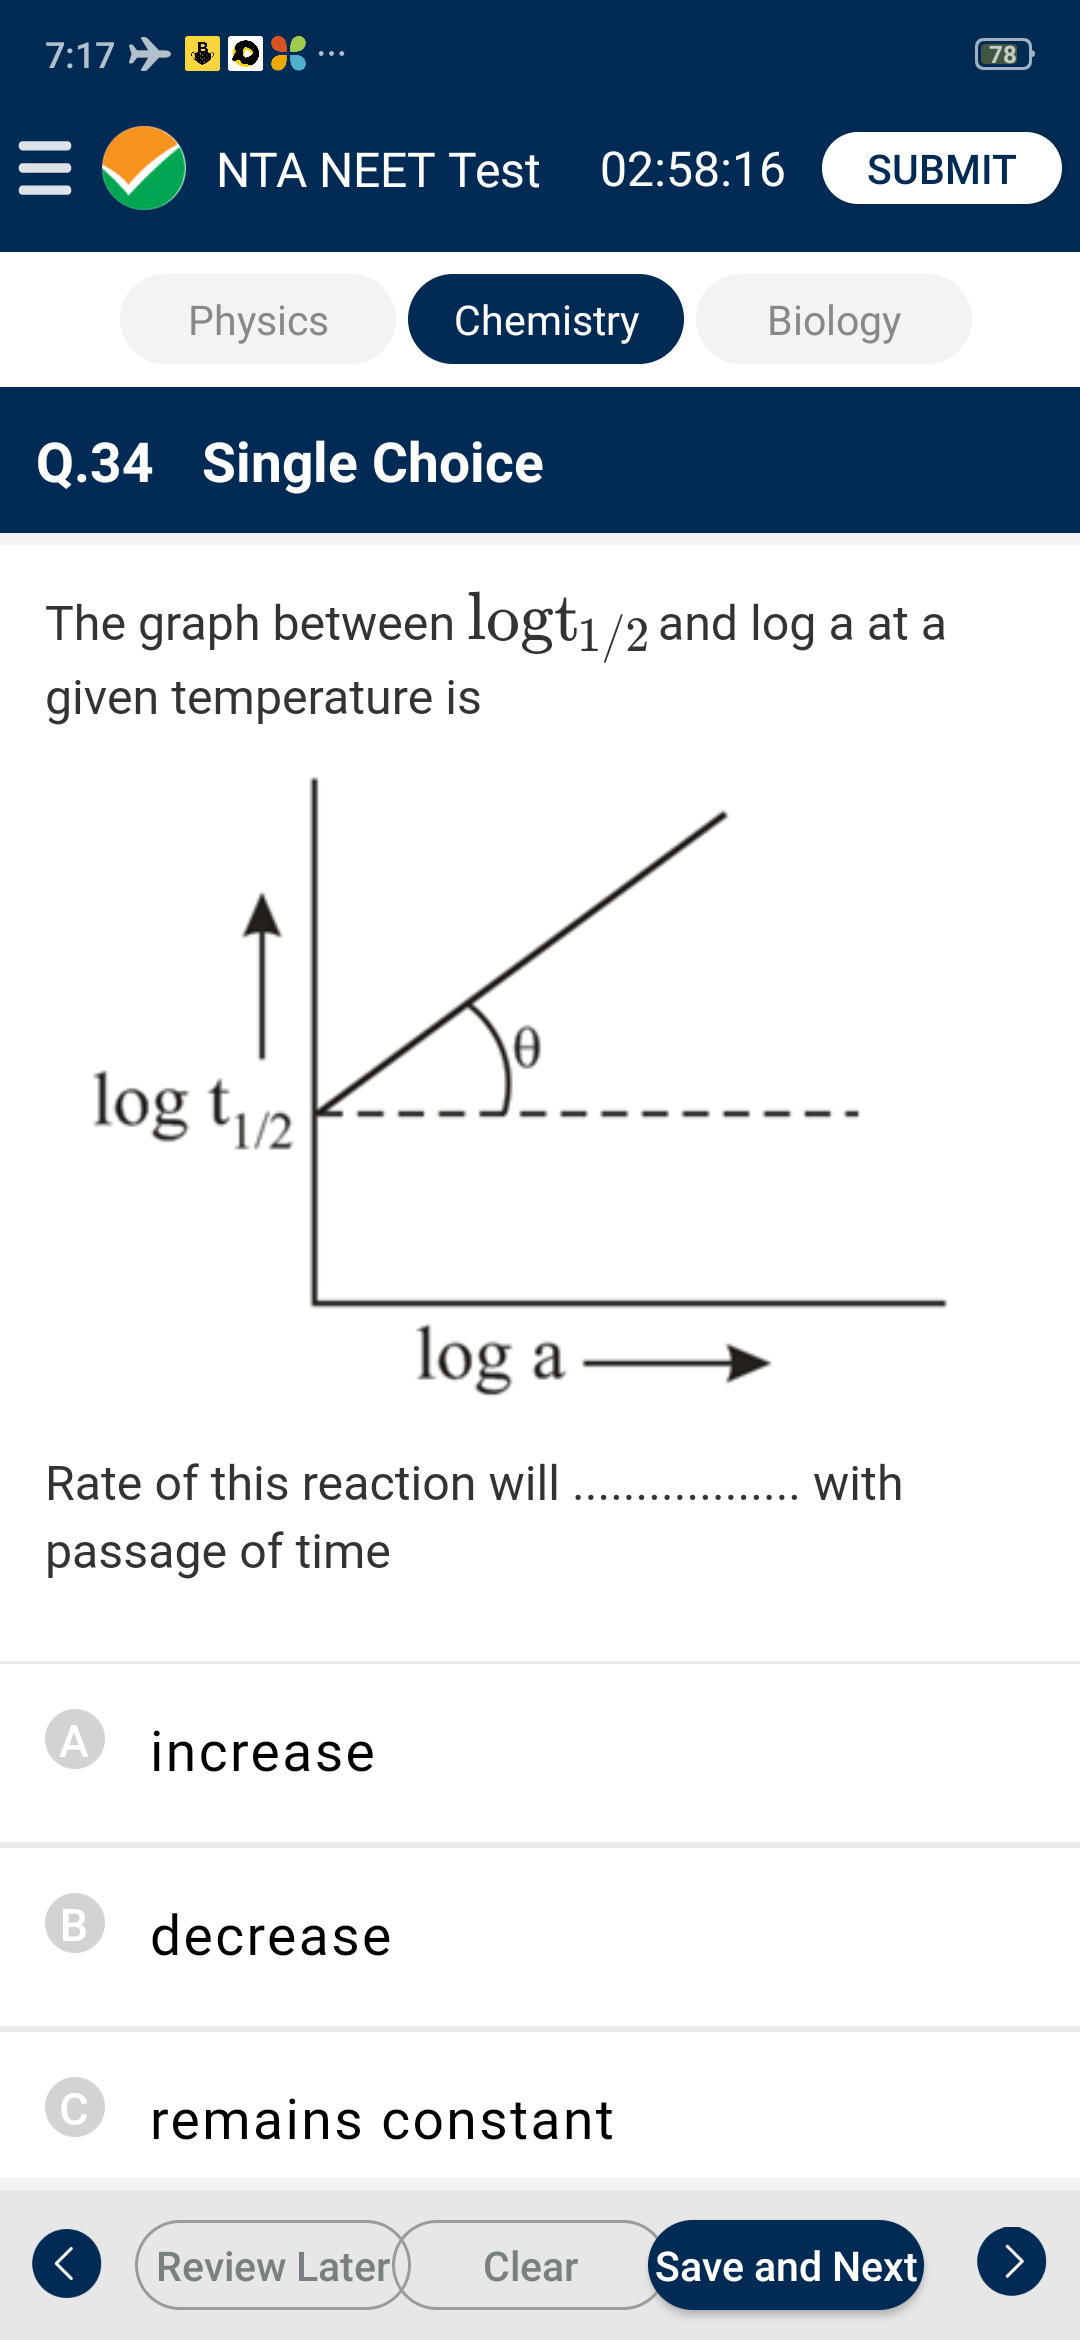
Rate of this reaction will …….with passage of time
View SolutionThe graph between log R and log A wher R is the nuclear radius and A is the mass of is.
View SolutionA graph plotted between log t50% vs log concentration is a straight line. What conclusion can you draw from this graph?
View Solution

