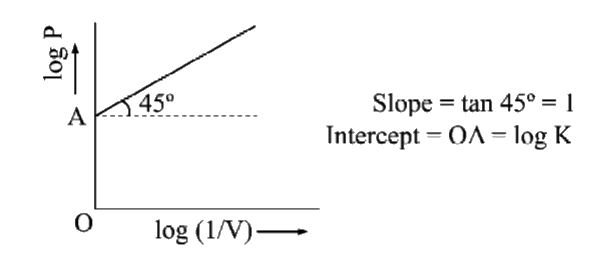
What is the type of graph between log P and log(1V) at constant temperature for a given amount of gas ?
Video Solution
Text Solution
At constant temperature by Boyle’s law, P=KV[K=nRT]
Taking logarithm on both sides, we get logP=log(1)V+logK
This equation can be compared to the equation of straight line, y = mx + c . Hence, a graph between log P and log(1V) gives a straight line as shown below
|
Similar Questions
Knowledge Check
The plot of log V against log P at constant temperature for a fixed mass of gas is :
A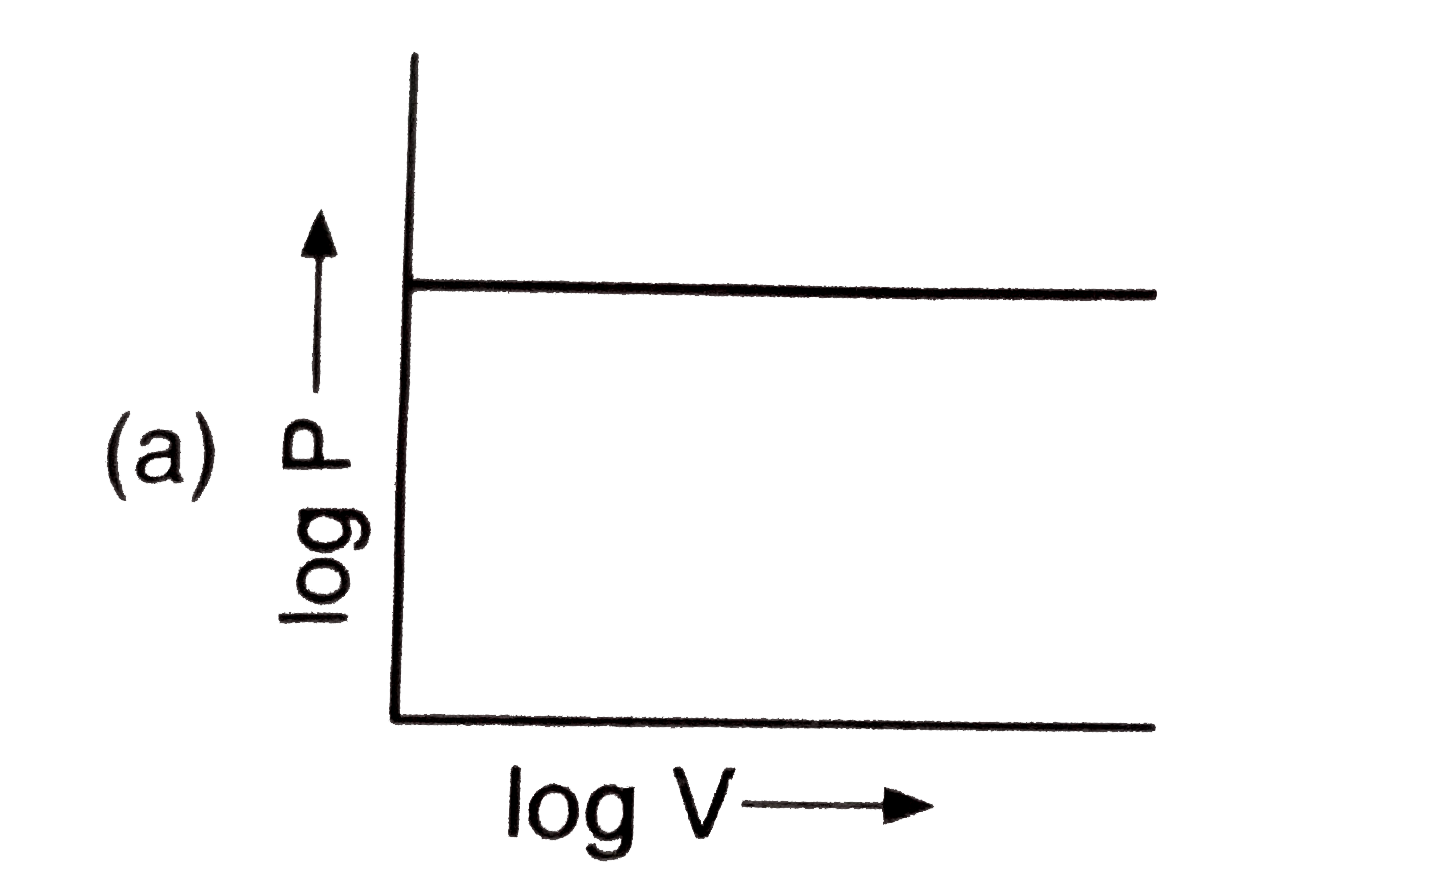 B
B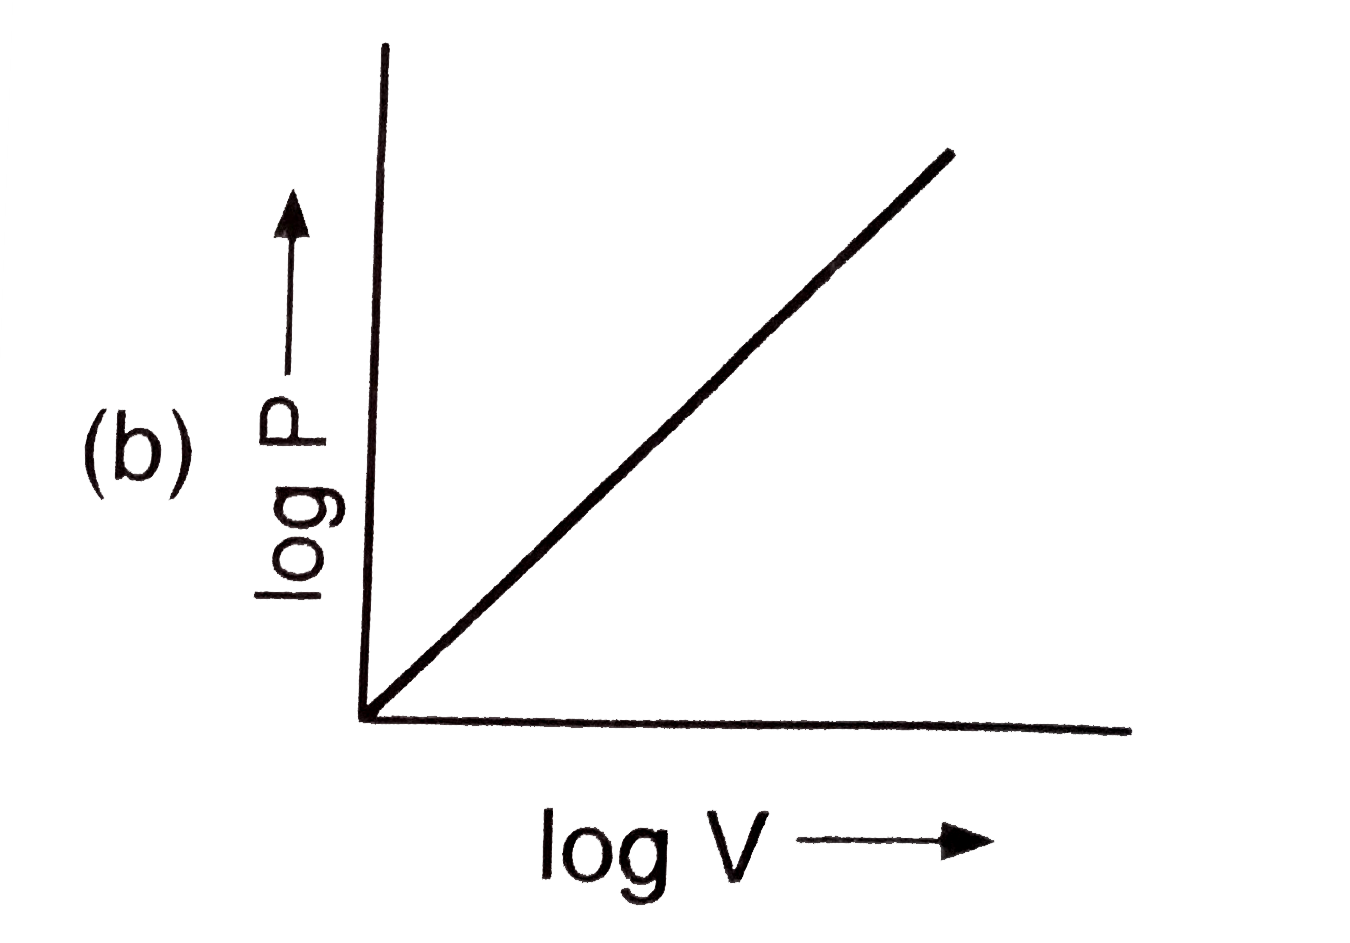 C
C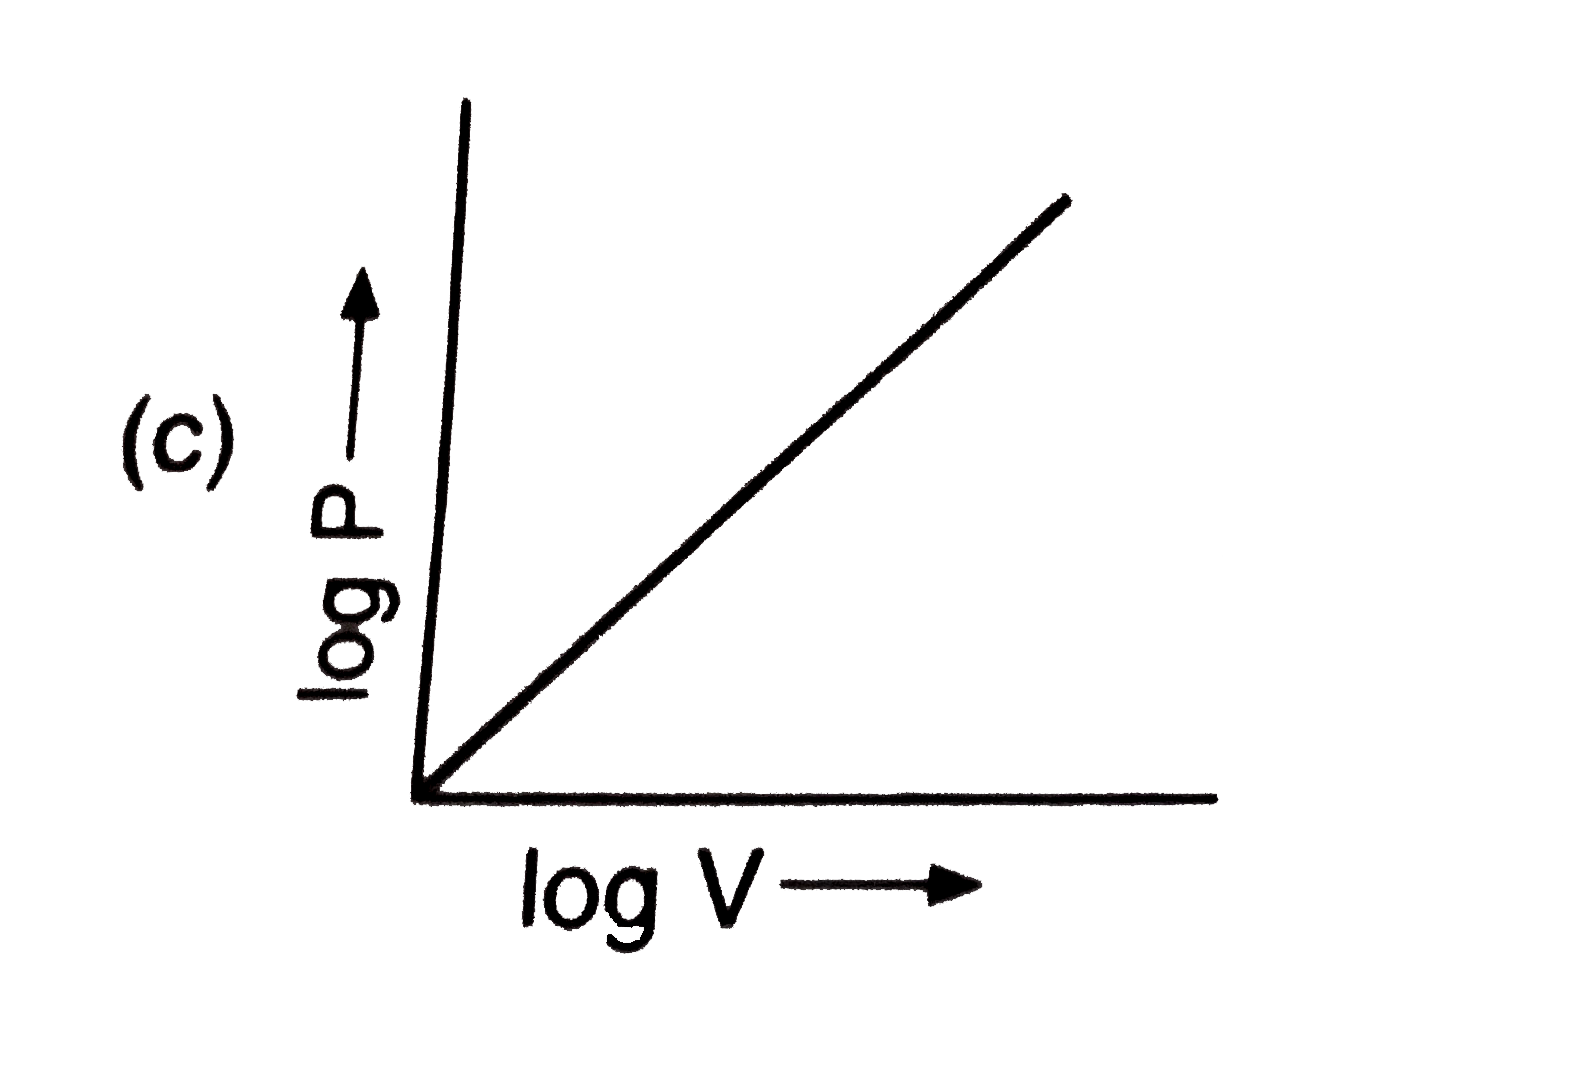 D
D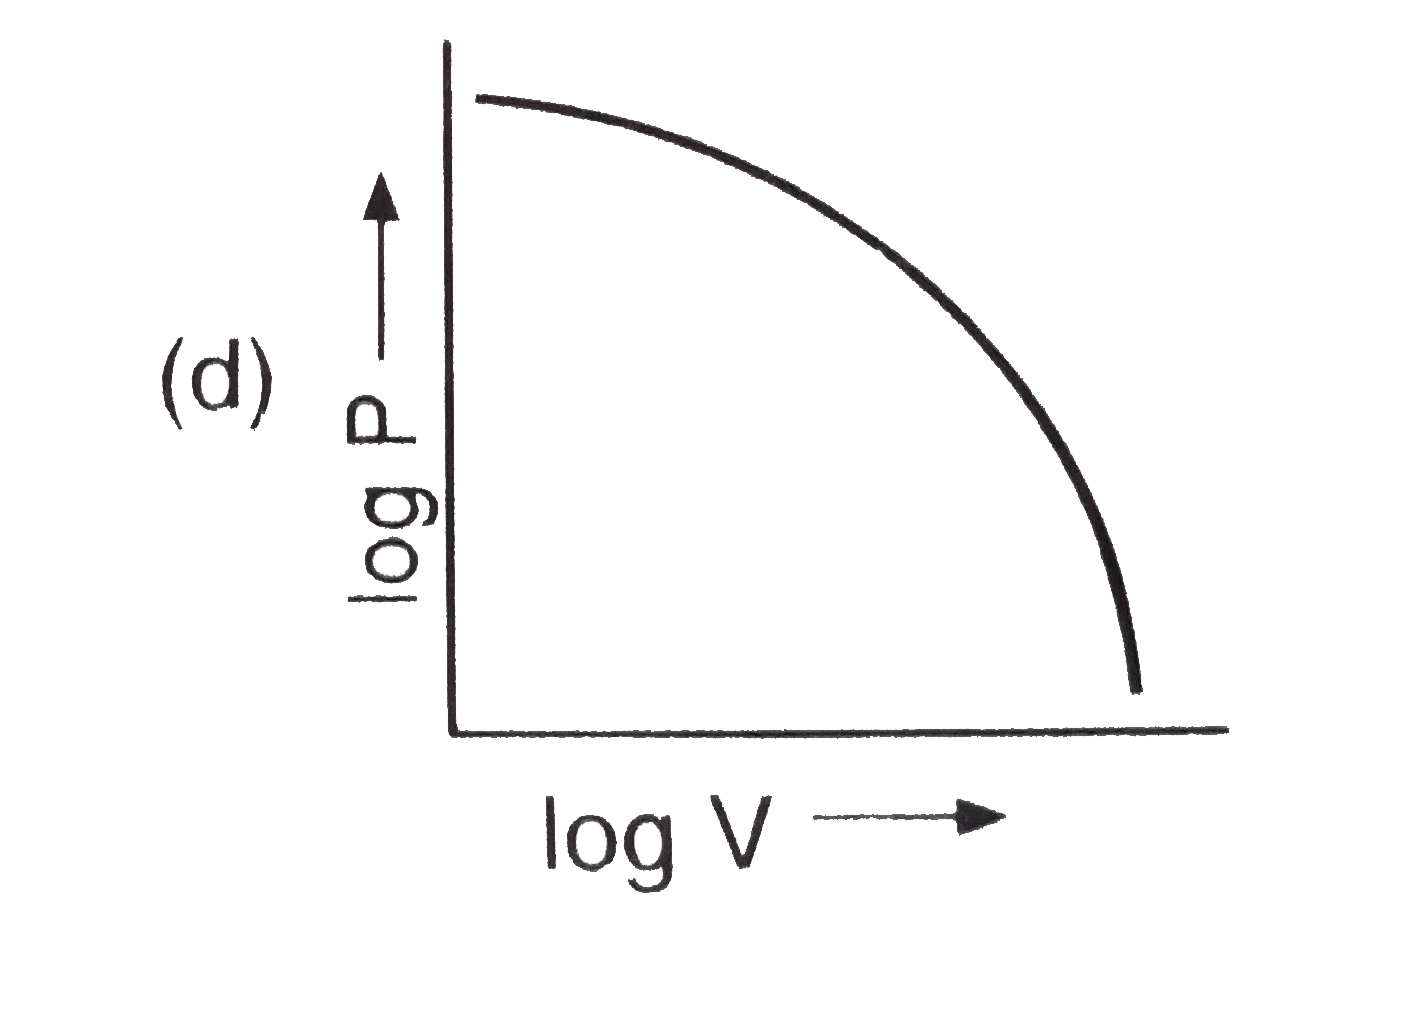
Graph between p and V at constant temperature is
AstraightBcurved increasingCstraight line with slopeDparabolic curve decreasingGraph between p and V at constant temperature is
AstraightBcurved increasingCstraight line with slopeDnone of these
What is the type of graph that would result between log(V) and log(1T) at constant pressure?
View SolutionWhat is the nature of graph of P versus (1/V) for a given mass of gas at constant temperature ?
View SolutionDraw a graph of logP and log(1/V) for a fixed amount of gas at constant temperature.
View SolutionUnder constant temperature, graph between P and 1/V is a
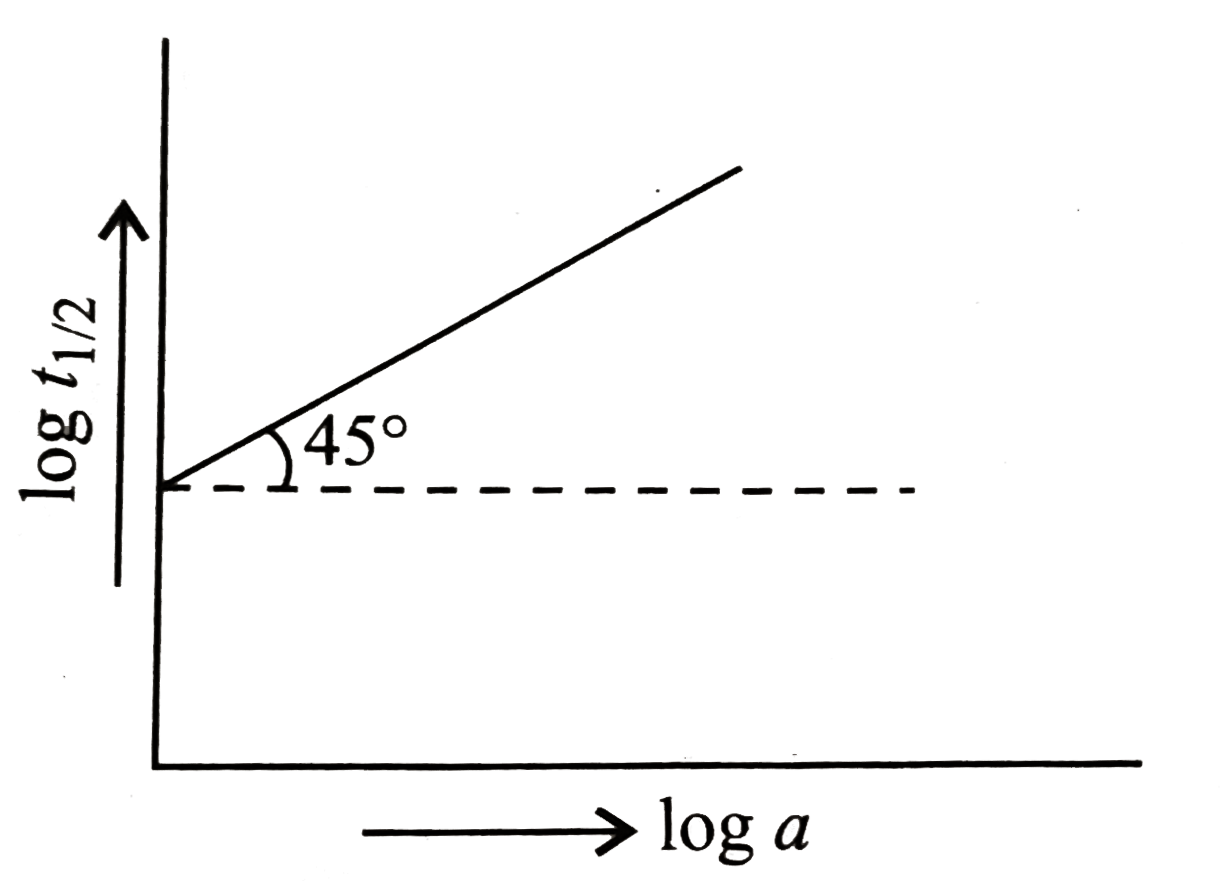
View SolutionFollowing is the graph between logT50 and loga (a= initial concentration) for a given reaction at 27∘C. Hence order is
View Solution

