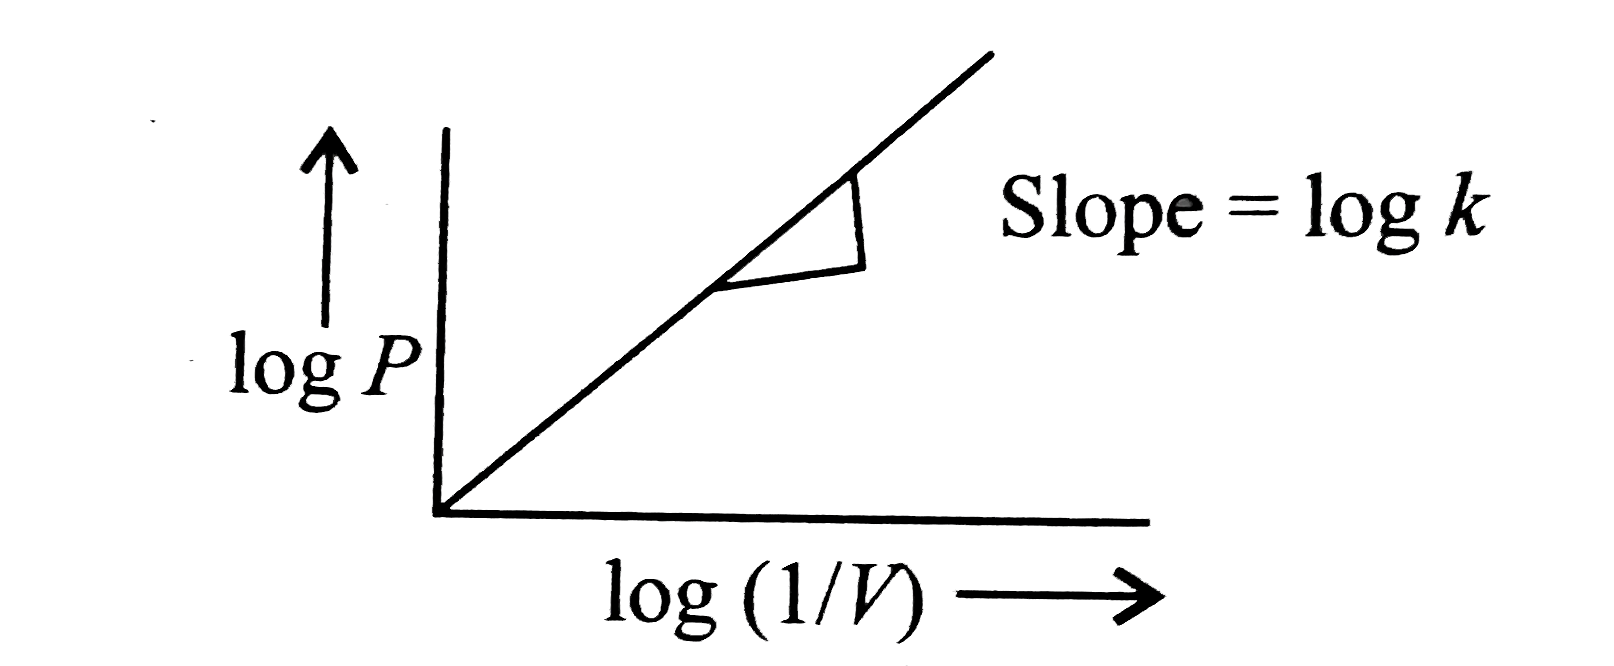
Draw a graph of and for a fixed amount of gas at constant temperature.
Video Solution
Text Solution
According to Boyle's law,
Comparing it to , we find that the graph of should be a straight line with slope equal to , i.e.

|
Topper's Solved these Questions
- STATES OF MATTERBOOK - CENGAGE CHEMISTRYCHAPTER - STATES OF MATTEREXERCISE - Exercises
21 Videos
- STATES OF MATTERBOOK - CENGAGE CHEMISTRYCHAPTER - STATES OF MATTEREXERCISE - Exercises (Linked Comprehensive)
48 Videos
- SOME BASIC CONCEPTS AND MOLE CONCEPTBOOK - CENGAGE CHEMISTRYCHAPTER - SOME BASIC CONCEPTS AND MOLE CONCEPTEXERCISE - Archives Subjective
11 Videos
- STOICHIOMETRYBOOK - CENGAGE CHEMISTRYCHAPTER - STOICHIOMETRYEXERCISE - Archives Subjective
33 Videos
Similar Questions
Knowledge Check
What is the nature of graph of PV versus P for a given mass of a gas at constant temperature?
AParallel to X-axisBParallel to Y-axisCLinear with positive slopeDLinear with negative slopeAt low pressure, the graph of PVvs1V for a given amount at a constant temperature for a real gas is:
Astraight line parallel to x-axisBstraight line having positive intercept and negative slopeCstraight line passing through origin having positive slopeDnone of the aboveGraph between p and V at constant temperature is
AstraightBcurved increasingCstraight line with slopeDnone of these
Draw the graph between P and 1/V (reciprocal of volume) for a perfect gas at constant temperature.
View SolutionDraw the graph for y=|logx|
View SolutionGraph between p and V at constant temperature is
View SolutionWhich of following graphs correctly represent variation of α=−(dV/dP)TV with P for fixed amount of an ideal gas at constant temperature ?
View SolutionConsider the following statements -
(i) At same P, if V vs T graph is draw for sam e mass of the two idea gaes, then the heavier has will have a heighter slope.
(ii) Intercept of log V vs T graph should always be posiive.
(iii) Graph of V2 vs 1T2 for fixes amount of an ideal gas at constant pressure will be a parabola.
View Solution
