Which of following graphs correctly represent variation of α=−(dV/dP)TV with P for fixed amount of an ideal gas at constant temperature ?
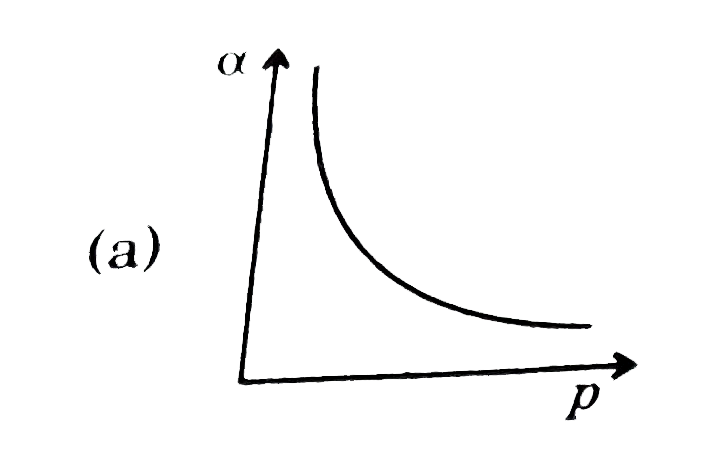

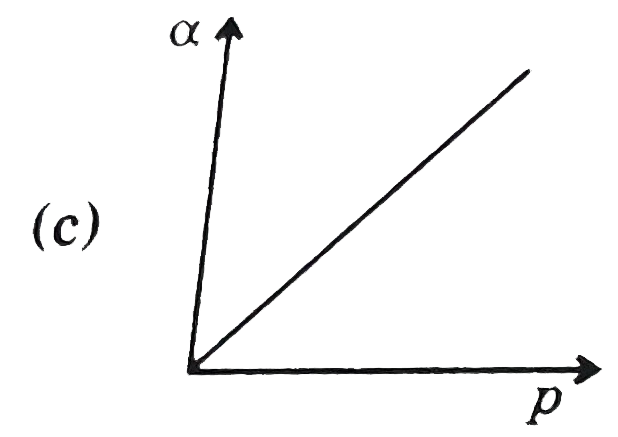
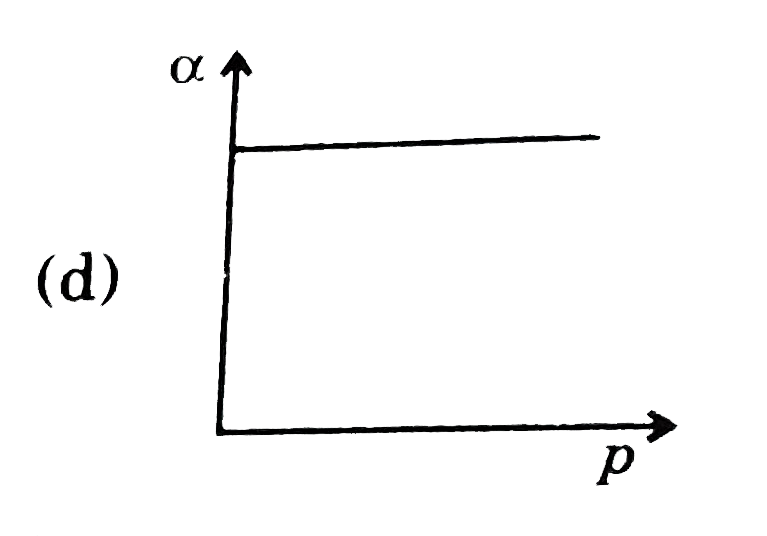
The correct Answer is:A
Step by step video, text & image solution for Which of following graphs correctly represent variation of alpha = (-(dV//dP)_(T))/(V) with P for fixed amount of an ideal gas at constant temperature ? by Chemistry experts to help you in doubts & scoring excellent marks in Class 12 exams.
Topper's Solved these Questions
- BOOK - GRB PUBLICATIONCHAPTER - GRAPHICAL INTERPRETATIONEXERCISE - C. Atomic Sturcture1videos
GRAPHICAL INTERPRETATION
- BOOK - GRB PUBLICATIONCHAPTER - GRAPHICAL INTERPRETATIONEXERCISE - Atomic Sturcture9videos
GRAPHICAL INTERPRETATION
- BOOK - GRB PUBLICATIONCHAPTER - GRAPHICAL INTERPRETATIONEXERCISE - B. Gaseous State1videos
GRAPHICAL INTERPRETATION
- BOOK - GRB PUBLICATIONCHAPTER - F-BLOCK ELEMENTSEXERCISE - Subjective type7videos
F-BLOCK ELEMENTS
- BOOK - GRB PUBLICATIONCHAPTER - HYDROCARBON (ALIPHATIC)EXERCISE - Previous years jee questions28videos
HYDROCARBON (ALIPHATIC)
Similar Questions
Knowledge Check
- Question 1 - Select One
Which of the following graphs correctly represents the variation of β=−(dVdP)1V with P for an ideal gas at constant temperature ?
A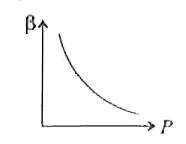 B
B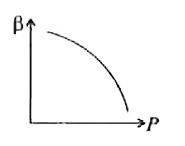 C
C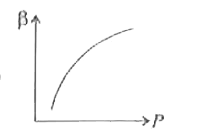 D
D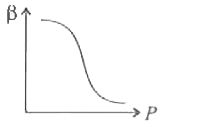
- Question 2 - Select One
For fixed amount of an ideal gas taken at constnat temperature V vs 1p2 is :
A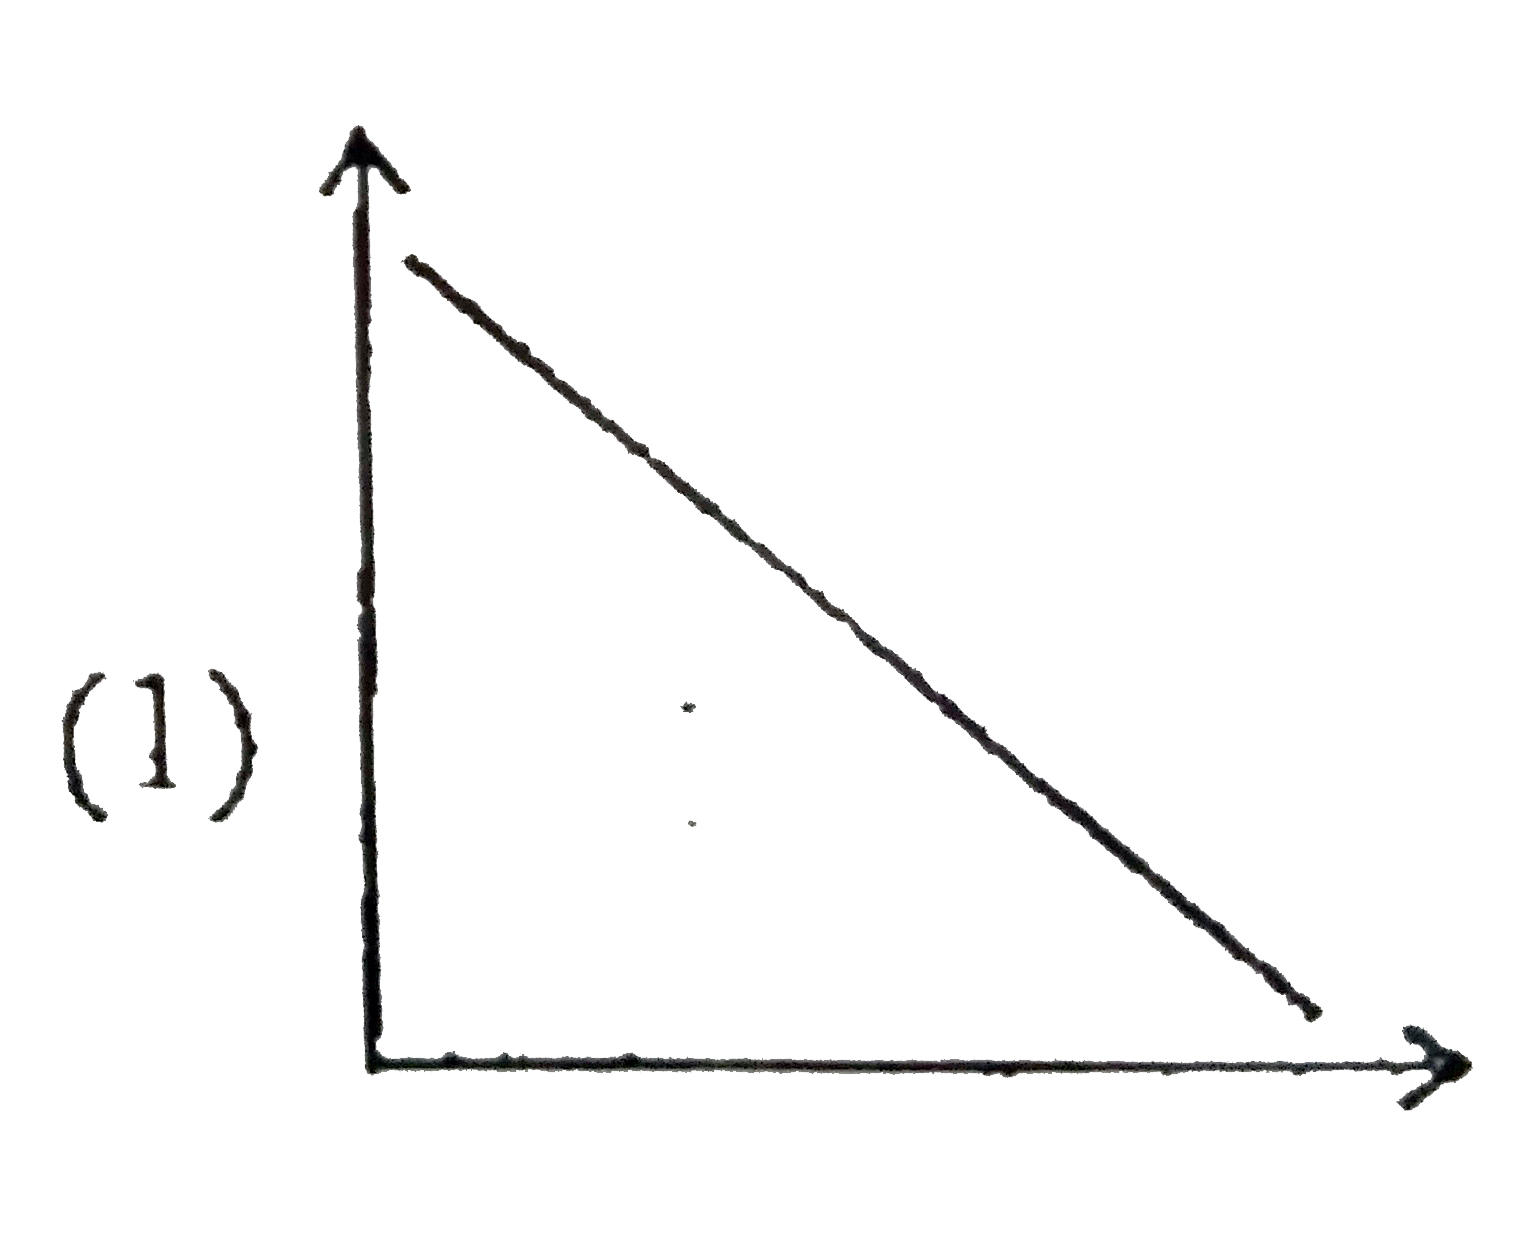 B
B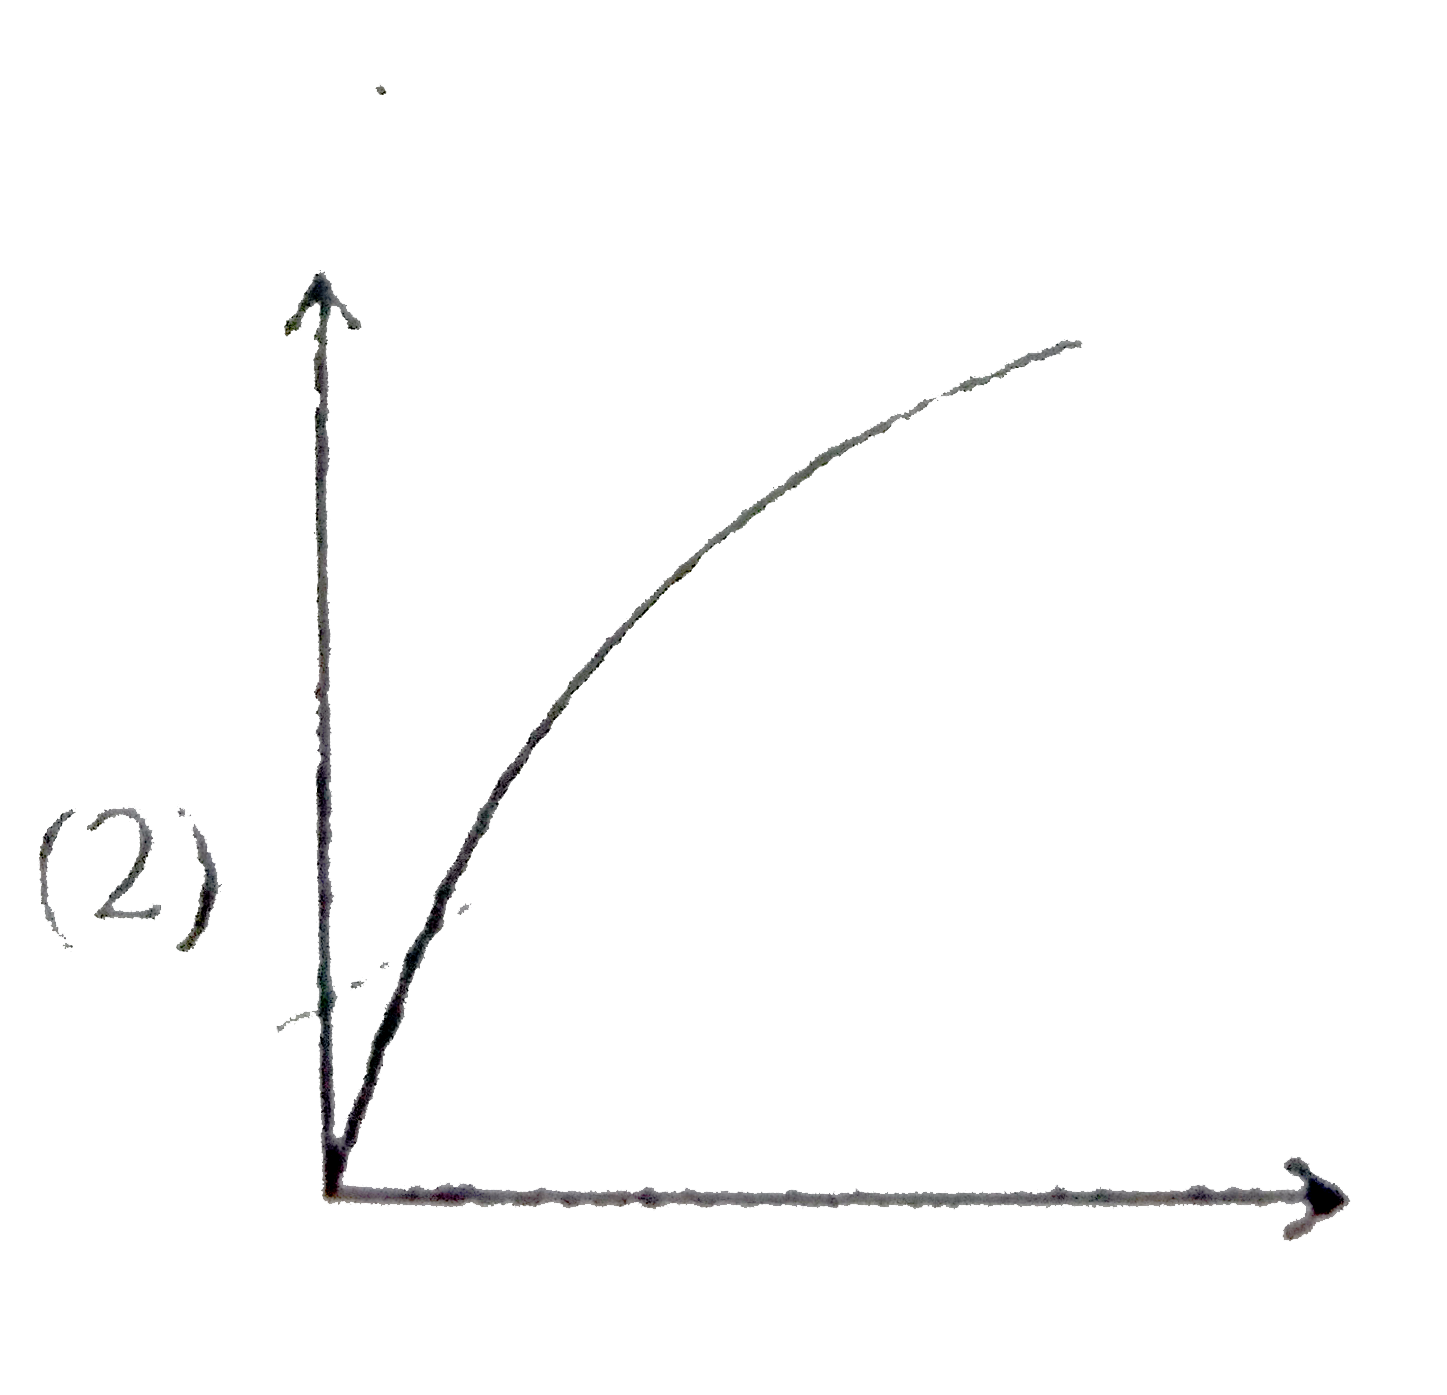 CE01_218_O03.png" width="30%">DE01_218_O04.png" width="30%">
 - Question 3 - Select One
Which of the following graphs correctly represents the variation of β=−(dVdP)/V with P for an ideal gas at constant temperature
A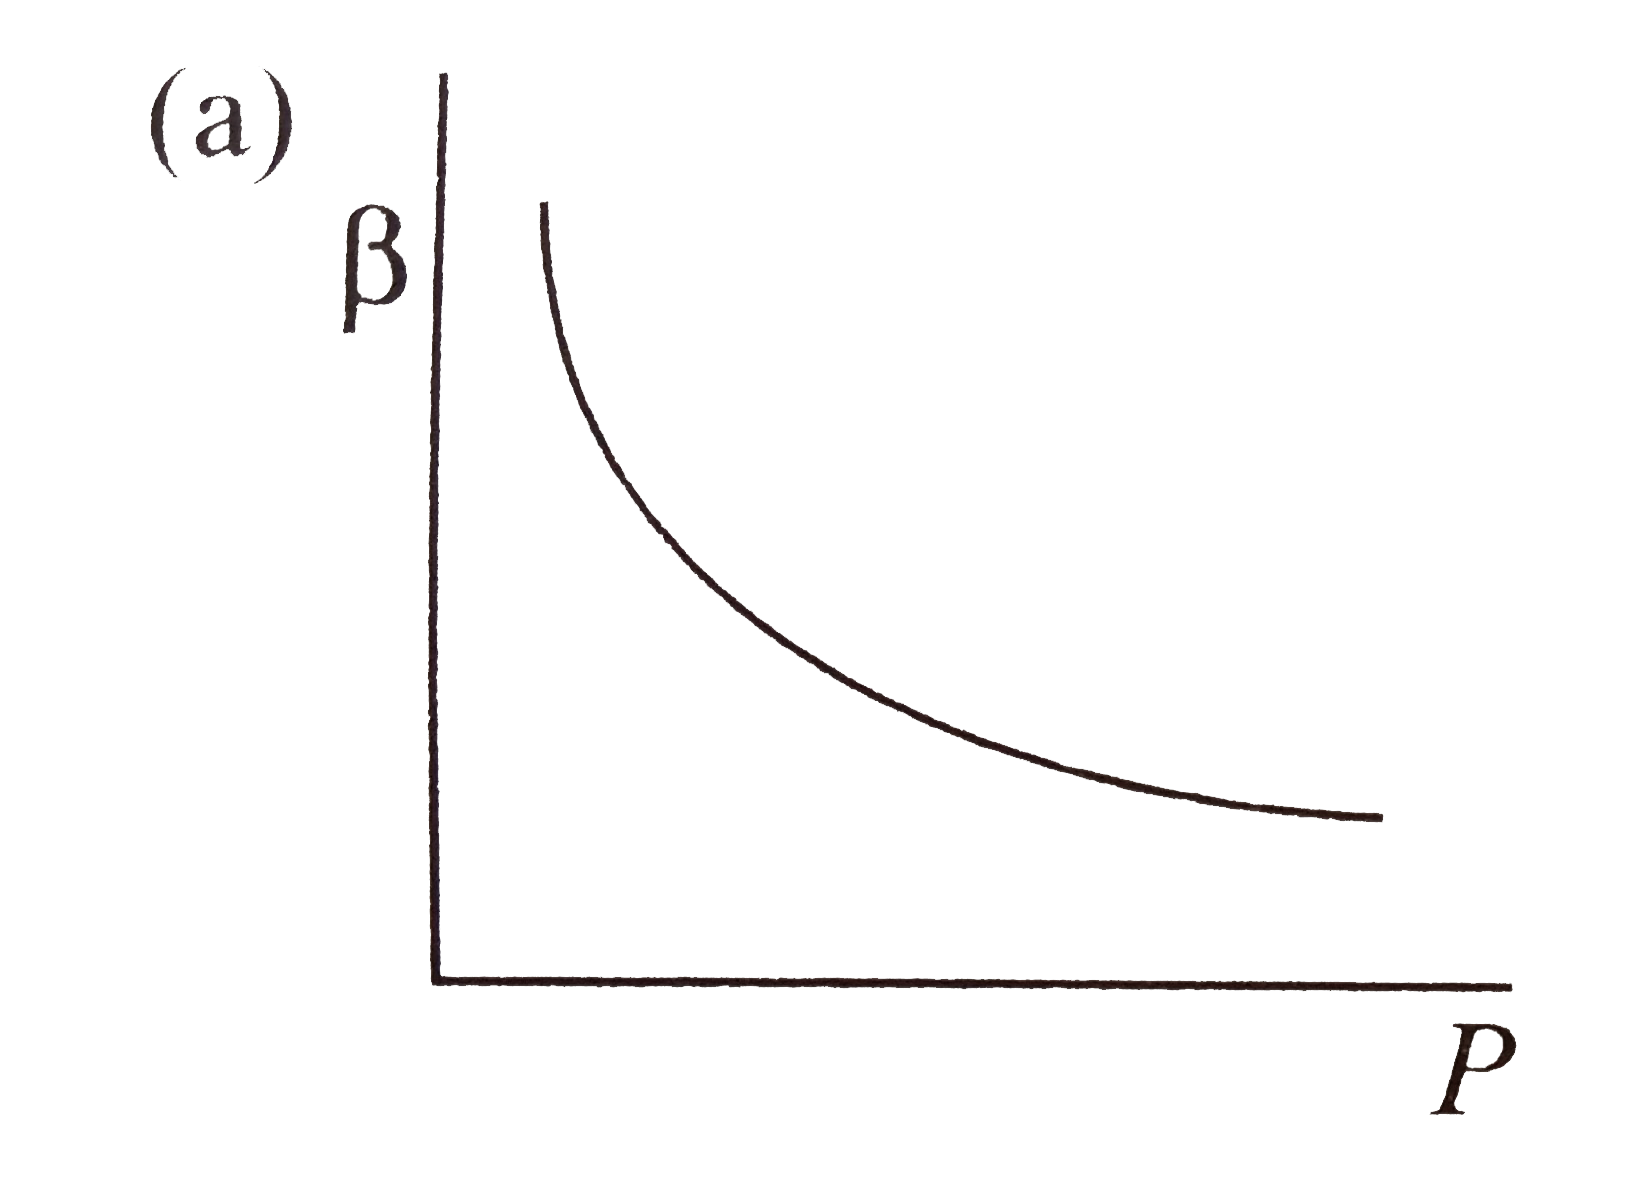 B
B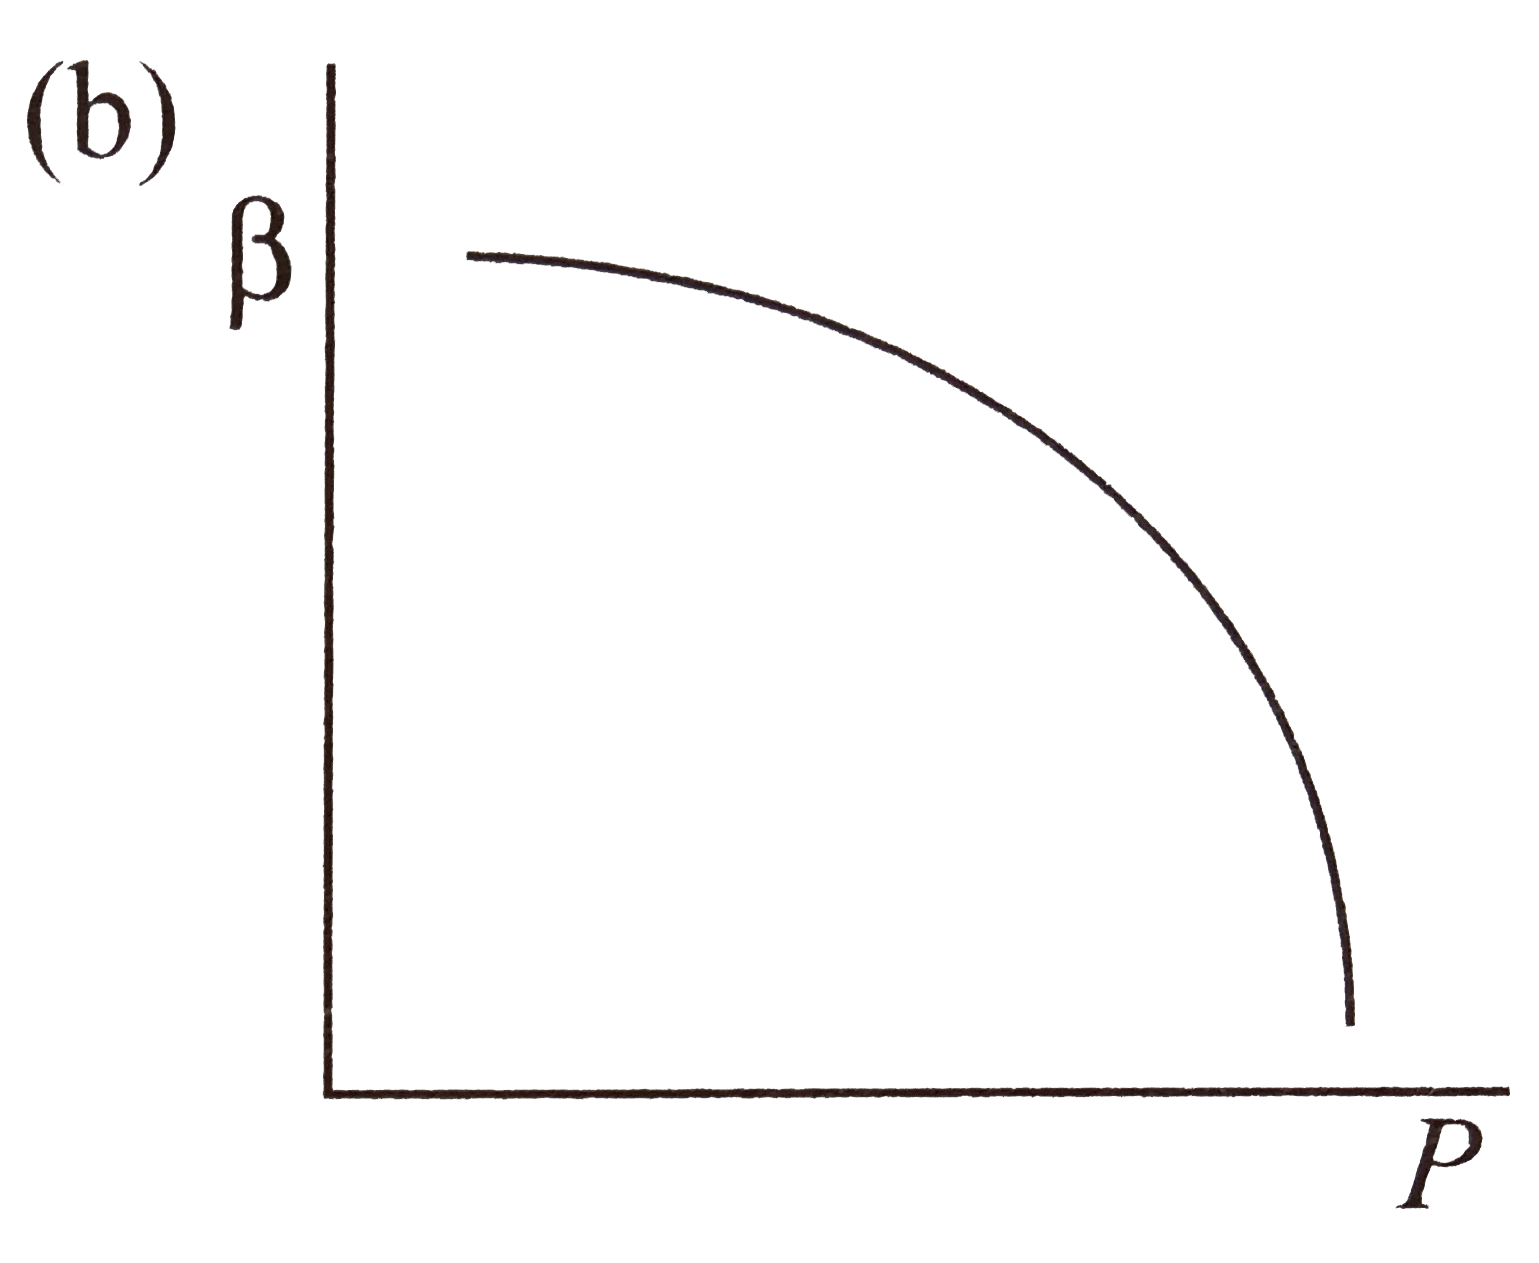 C
C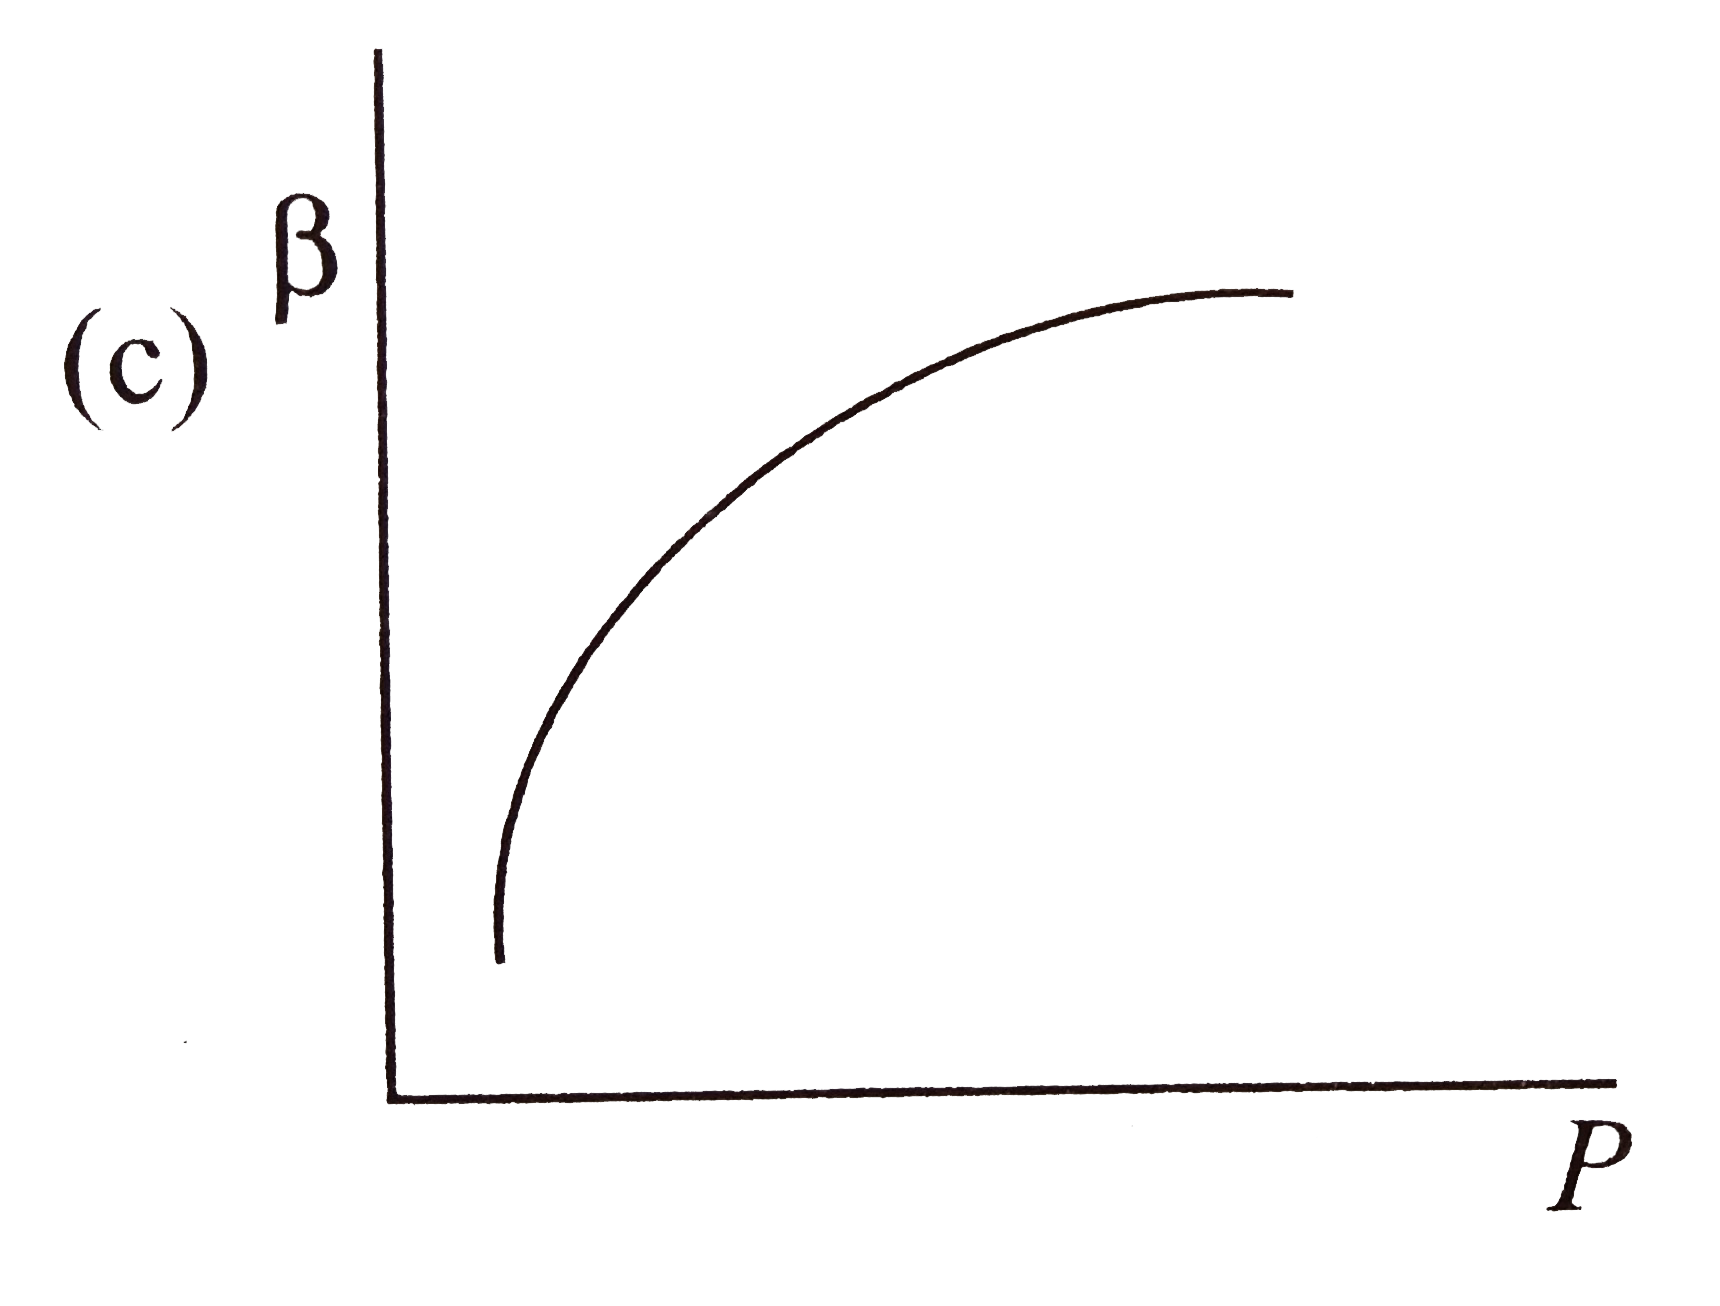 D
D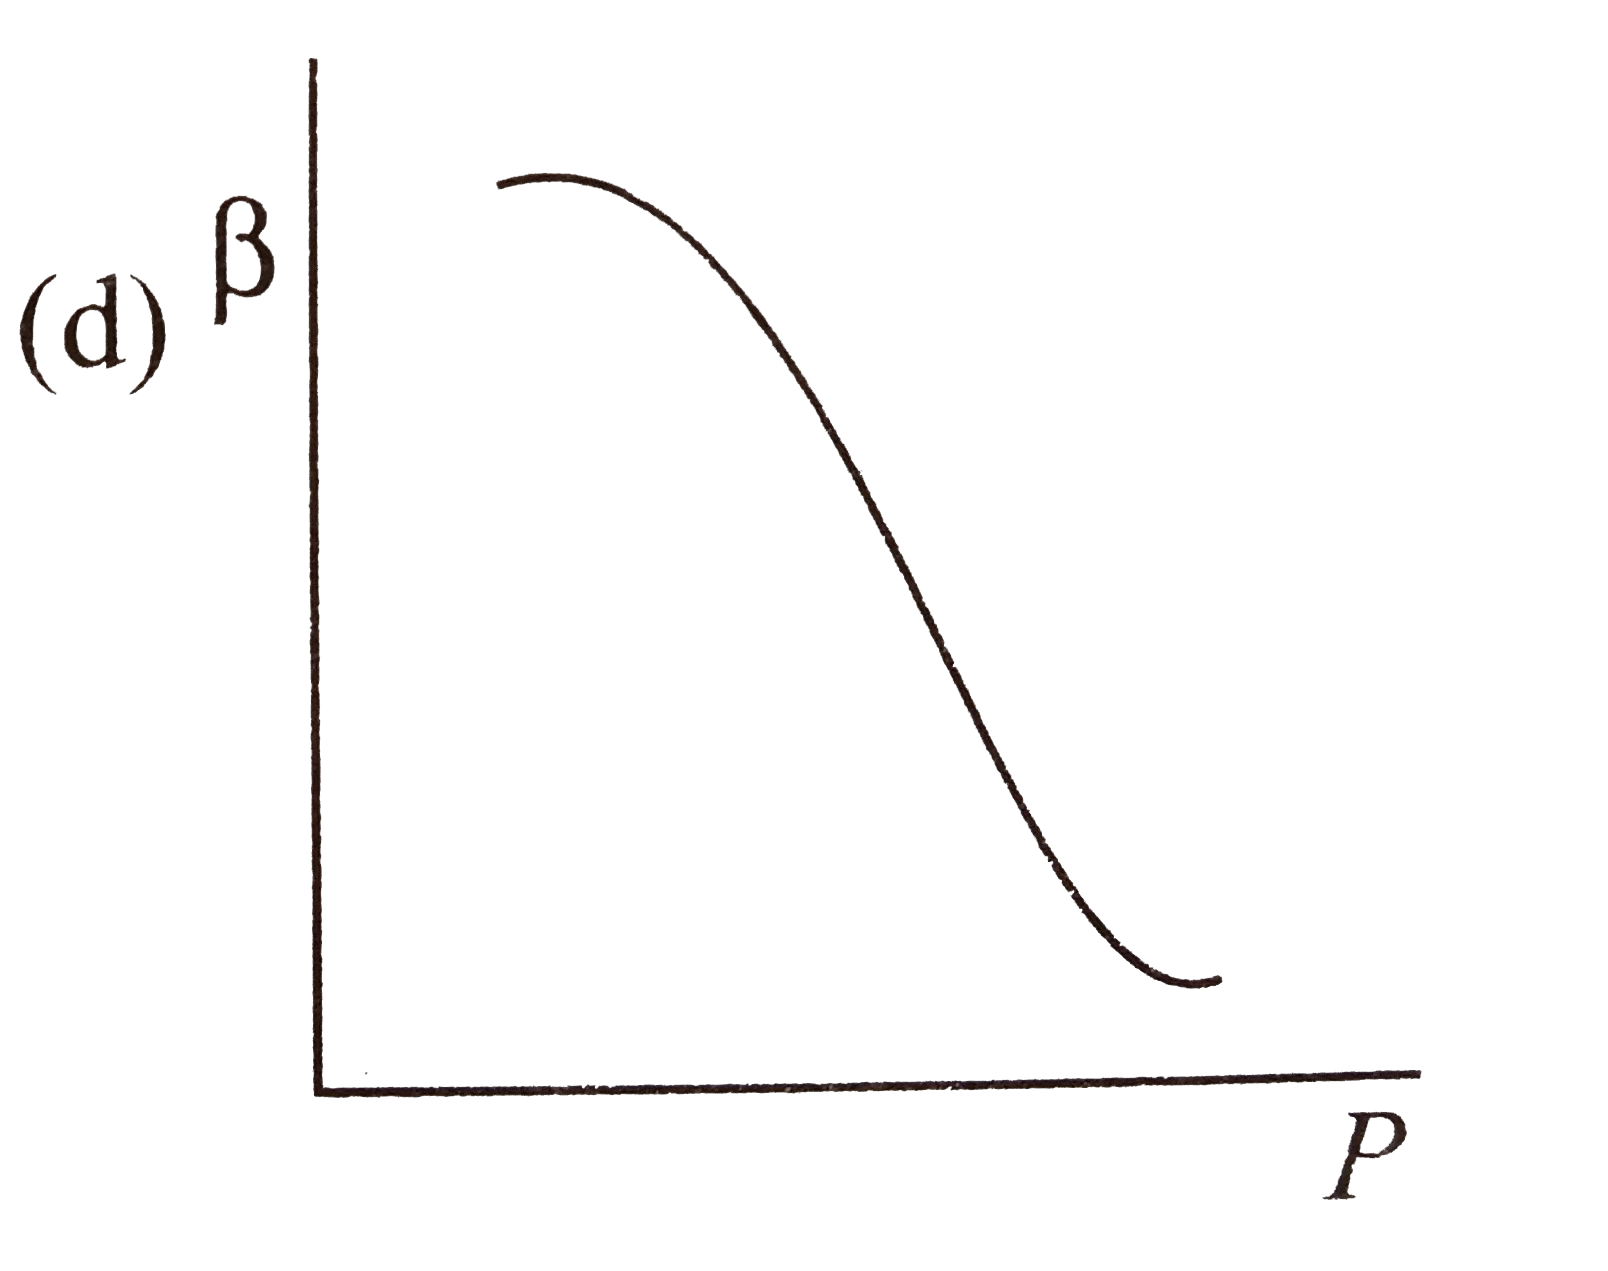
Which of the following graphs correctly represents the variation of β=−dV/dPV
with P for an ideal gas at constant temperature?View Solutionwhich of the following graphs correctly represents the vatiation β=−(dVdP)T/V with P for an ideal gas at constant temperature ? .
View SolutionFor a certain amount of an ideal gas at constant temperature, __________________.
View SolutionFor fixed amount of an ideal gas identify the incorrect graph :
View SolutionFor fixed mass of an ideal gas a constant temperature. Which is correct graph ?
View Solution

