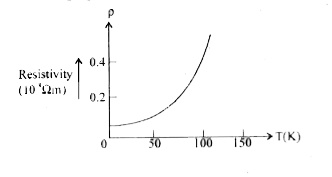
Show variation of resistivity of copper as a function of temperature in a graph. Solution in Kannada
Topper's Solved these Questions
- CURRENT ELECTRICITYBOOK - SUBHASH PUBLICATIONCHAPTER - CURRENT ELECTRICITYEXERCISE - TWO MARK QUESTIONS AND ANSWERS
19 Videos
- CURRENT ELECTRICITYBOOK - SUBHASH PUBLICATIONCHAPTER - CURRENT ELECTRICITYEXERCISE - THREE MARK QUESTIONS AND ANSWERS
11 Videos
- COMMUNICATION SYSTEMS BOOK - SUBHASH PUBLICATIONCHAPTER - COMMUNICATION SYSTEMS EXERCISE - THREE MARKS QUESTIONS WITH ANSWERS
4 Videos
- DUAL NATURE OF RADIATION AND MATTERBOOK - SUBHASH PUBLICATIONCHAPTER - DUAL NATURE OF RADIATION AND MATTEREXERCISE - NUMERICALS WITH SOLUTIONS
21 Videos
Similar Questions
Mention any two effects of current.
View SolutionA uniform wire of resistance 9Ω is bent to form an equilateral triangle. What is the effective resistance between any two corners of the triangle.
View SolutionOutline the production of an Amplitude Modulated Wave.
View SolutionA photo has a wavelength of 5000 Å. Calculate its momentum.
View SolutionDefine the term 'temperature coefficient of resistivity' . Write its S.I. unit. Plot a graph showing the variation of resistivity of copper with temperature.
View SolutionShow on a graph, the variation of resistivity with temperature for a typical semiconductor.
View SolutionShow variation of resistivity of copper as a function of temperature in a graph.
View SolutionShow variation of resistivity of copper as a function of temperature in a graph.
View SolutionShow variation of resistivity of SI with temperature in a graph.
View SolutionSketch a graph showing variation of resistivity with temperature of (i) Copper (ii) Carbon.
View Solutionwhich of the following graph represents the variation of resistivity (ρ) with temperature (T) for copper?
View SolutionShow variation of resistivity of copper as a function of temperature in a graph.
View SolutionShow on a graph the variation of resistivity with temperature for a typical semiconductor
View SolutionShow variation of resistivity of copper as a function of temperature in a graph.
View SolutionShow on a graph, the variation of resistivity with temperature for a typical semiconductor.
View Solution

