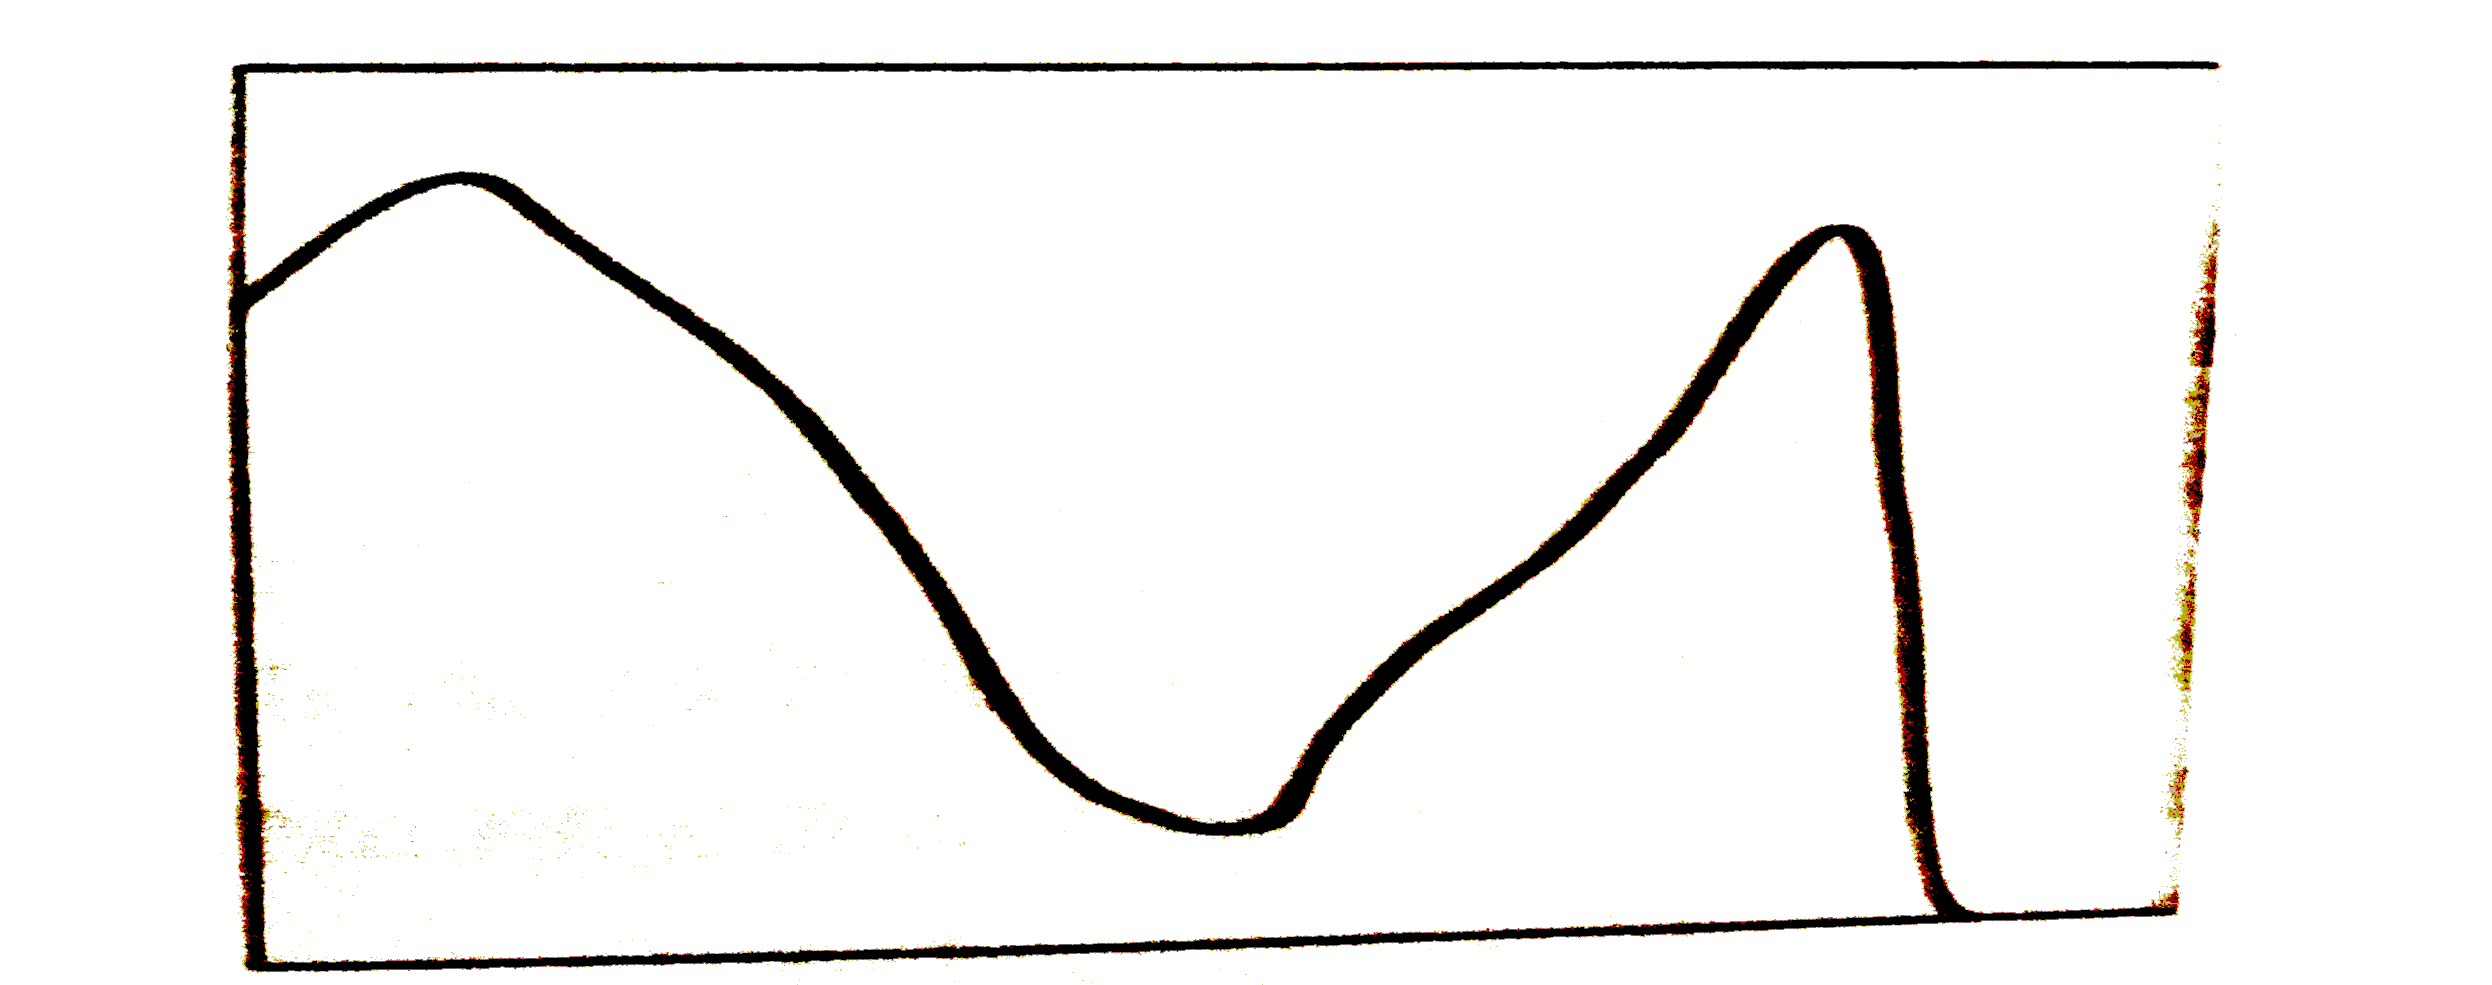
The following graph shows the

Absorption spectrum of chlorophyll a
Absorption spectrum of chlorophyll b
Action spectrum of photosynthesis
Both A and B
The correct Answer is:C
Step by step video, text & image solution for The following graph shows the by Biology experts to help you in doubts & scoring excellent marks in Class 11 exams.
Updated on:21/07/2023Topper's Solved these Questions
- PHOTOSYNTHESIS IN HIGHER PLANTSBOOK - A2ZCHAPTER - PHOTOSYNTHESIS IN HIGHER PLANTSEXERCISE - Section A : Topicwise Questions Topic 2 : Light Reaction (the Electron Transport , Cyclic And Non-cy
61 Videos
- PHOTOSYNTHESIS IN HIGHER PLANTSBOOK - A2ZCHAPTER - PHOTOSYNTHESIS IN HIGHER PLANTSEXERCISE - Section A : Topicwise Questions Topic 3 : Dark Reaction (the Calvin Cycle)
27 Videos
- NEURAL CONTROL AND COORDINATIONBOOK - A2ZCHAPTER - NEURAL CONTROL AND COORDINATIONEXERCISE - Section D : Chapter-end Test
50 Videos
- PLANT GROWTH AND DEVELOPMENTBOOK - A2ZCHAPTER - PLANT GROWTH AND DEVELOPMENTEXERCISE - Section D : Chapter-end Test
50 Videos
Similar Questions
Knowledge Check
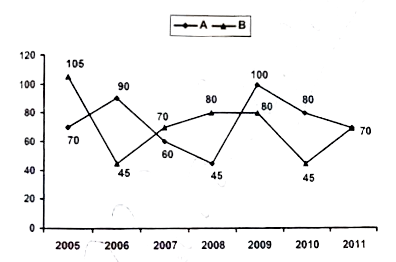
Study the following graph carefully and answer the given questions :-
The following graph shows the % profit of two companies over the years :-

In which of the following years was the total income more than double the total expenditure in that year for company A ?A2010B2009C2006Dnone of theseStudy the following graph carefully and answer the given questions :-
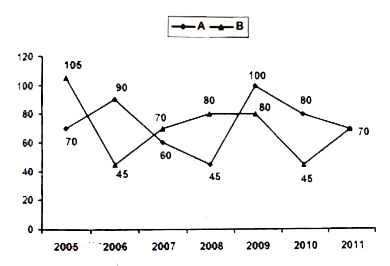
The following graph shows the % profit of two companies over the years :-

In which of the following years the ratio of expenditure to income was the least for company B?A2006B2009C2008D2005Study the following graph carefully and answer the given questions :-
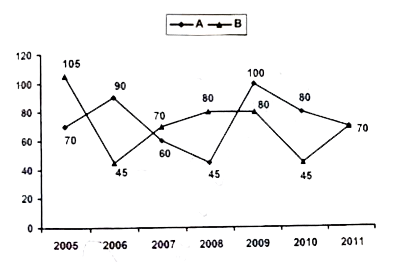
The following graph shows the % profit of two companies over the years :-

If the total expenditure of company A in 2007 was Rs 150 lakhs what was the total income ?AA) Rs 240 lakhsBB) Rs 250 lakhsCC) Rs 260 lakhsDD) Data inadequate
The temperature of a particular place is continuously decreasing. Which of the following graphs shows the condition?
View SolutionThe temperature of a particular place is continuously decreasing. Which of the following graphs shows the condition?
View SolutionThe temperature of a particular place is continuously decreasing, Which of the following graphs shows the condition?
View SolutionWhich of the following graphs shows the correct description of effect of pH on enzyme activity?
View SolutionWhich of the following graphs shows the change in pH when zinc carbonate is added to hydrochloric acid until it is excess ?
View Solution
