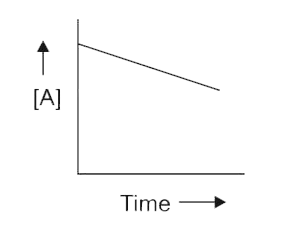
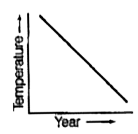
The temperature of a particular place is continuously decreasing. Which of the following graphs shows the condition?
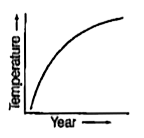
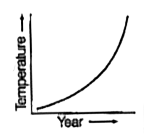
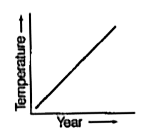
The correct Answer is:D
To determine which graph shows a continuously decreasing temperature, we will analyze each of the four options provided.
1. Understand the Concept of Decreasing Temperature:
- A graph representing decreasing temperature will show a downward trend as you move from left to right. This means that as the x-axis values increase, the y-axis values (temperature) should decrease.
2. Analyze Option 1:
- In Option 1, the graph shows an upward trend. As we move from left to right, the values on the y-axis are increasing.
- Conclusion: This graph does not represent decreasing temperature.
3. Analyze Option 2:
- In Option 2, similar to Option 1, the graph also shows an upward trend. The temperature values are increasing as we move along the x-axis.
- Conclusion: This graph does not represent decreasing temperature.
4. Analyze Option 3:
- In Option 3, the graph appears to show an upward trend as well. The values on the y-axis are increasing as we move from left to right.
- Conclusion: This graph does not represent decreasing temperature.
5. Analyze Option 4:
- In Option 4, the graph shows a downward trend. As we move from left to right, the values on the y-axis are decreasing.
- Conclusion: This graph represents decreasing temperature.
6. Final Decision:
- Based on the analysis, Option 4 is the correct choice as it shows a continuously decreasing temperature.
- A graph representing decreasing temperature will show a downward trend as you move from left to right. This means that as the x-axis values increase, the y-axis values (temperature) should decrease.
- In Option 1, the graph shows an upward trend. As we move from left to right, the values on the y-axis are increasing.
- Conclusion: This graph does not represent decreasing temperature.
- In Option 2, similar to Option 1, the graph also shows an upward trend. The temperature values are increasing as we move along the x-axis.
- Conclusion: This graph does not represent decreasing temperature.
- In Option 3, the graph appears to show an upward trend as well. The values on the y-axis are increasing as we move from left to right.
- Conclusion: This graph does not represent decreasing temperature.
- In Option 4, the graph shows a downward trend. As we move from left to right, the values on the y-axis are decreasing.
- Conclusion: This graph represents decreasing temperature.
- Based on the analysis, Option 4 is the correct choice as it shows a continuously decreasing temperature.
Topper's Solved these Questions
- DATA HANDLING AND PATTERNSBook:ARIHANT PUBLICATION PUNJABChapter:DATA HANDLING AND PATTERNSExercise:Chapter Exercise
Explore 50 Videos
- DATA HANDLING Book:ARIHANT PUBLICATION PUNJABChapter:DATA HANDLING Exercise:CHAPTER EXERCISE
Explore 50 Videos
- ERROR ANALYSISBook:ARIHANT PUBLICATION PUNJABChapter:ERROR ANALYSISExercise:CHAPTER EXERCISE
Explore 25 Videos
Similar Questions
Knowledge Check
The following graph shows the
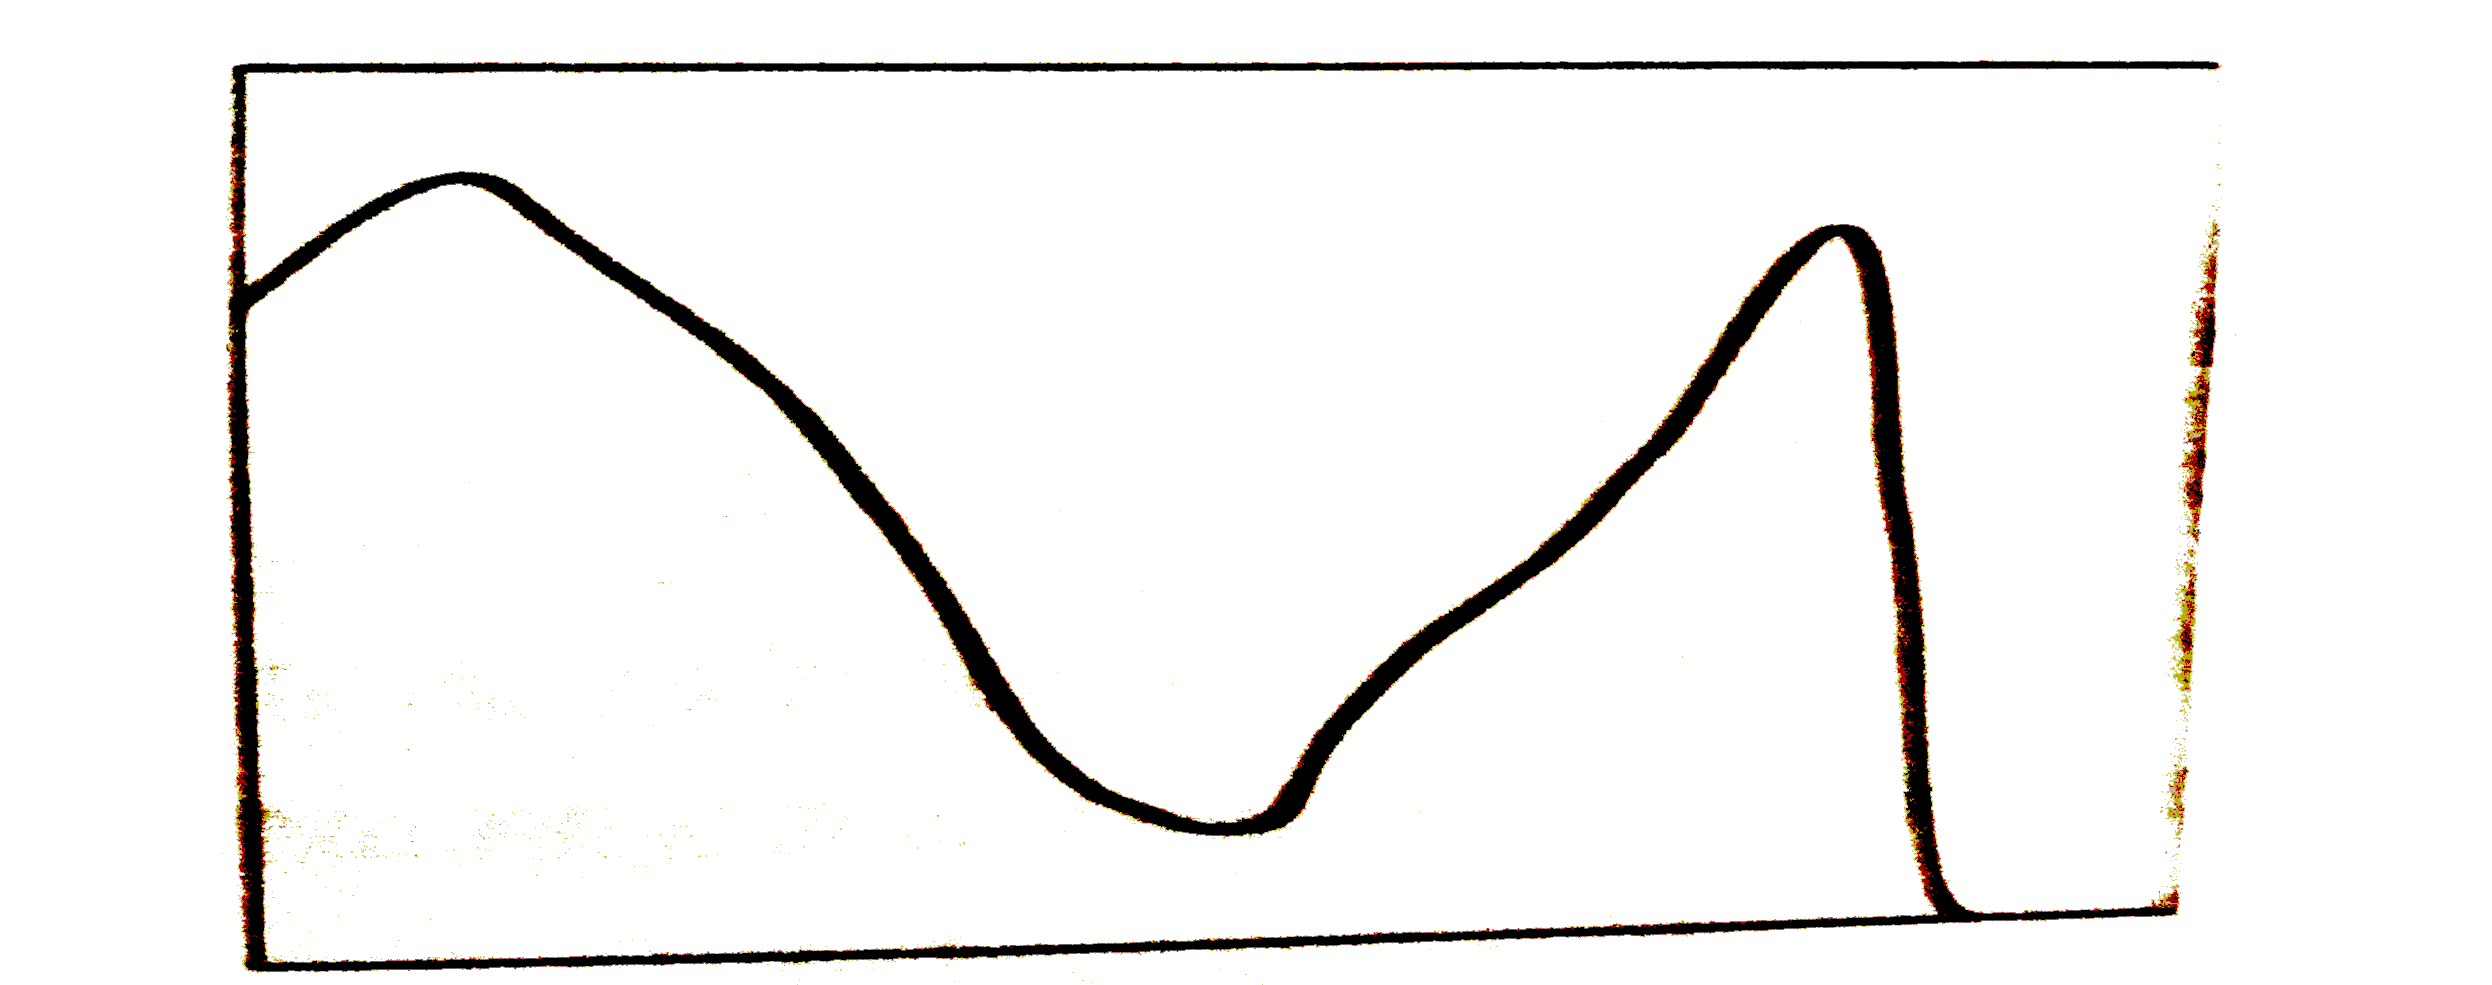 AAbsorption spectrum of chlorophyll aBAbsorption spectrum of chlorophyll bCAction spectrum of photosynthesisDBoth A and B
These days, prices are falling. Which of the following graphs shows this conditions?
A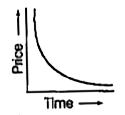 B
B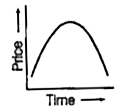 C
C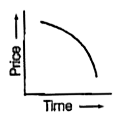 D
D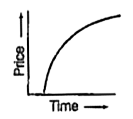
Which of the following genes show the heterozygous condition?
ARrBRRCrrDNone of these
Which of the following set of organisms shows dioecious conditions ?
View SolutionWhich of the following conditions shows the polluted enviorment ?
View SolutionWhich of the following graphs has a positive , decreasing slope ?
View SolutionWhich of the following condition show polluted environment ?
View SolutionWhich of the following conditions shows the polluted enviorment ?
View Solution

