The bar graph, given here, shows the number of tickets sold by 6 students A, B, C, D, E and F during a fair. Observe the graph and answer questions based on it.
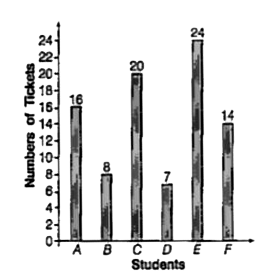
Total number of tickets sold by D, E and F is
47
46
45
44
The correct Answer is:C
Step by step video, text & image solution for The bar graph, given here, shows the number of tickets sold by 6 students A, B, C, D, E and F during a fair. Observe the graph and answer questions based on it. Total number of tickets sold by D, E and F is by Maths experts to help you in doubts & scoring excellent marks in Class 14 exams.
Updated on:21/07/2023Topper's Solved these Questions
- DATA HANDLING AND PATTERNSBOOK - ARIHANT PUBLICATION PUNJABCHAPTER - DATA HANDLING AND PATTERNSEXERCISE - Chapter Exercise
50 Videos
- DATA HANDLING BOOK - ARIHANT PUBLICATION PUNJABCHAPTER - DATA HANDLING EXERCISE - CHAPTER EXERCISE
50 Videos
- ERROR ANALYSISBOOK - ARIHANT PUBLICATION PUNJABCHAPTER - ERROR ANALYSISEXERCISE - CHAPTER EXERCISE
25 Videos
Similar Questions
Observe the bar graph and answer the following questions.
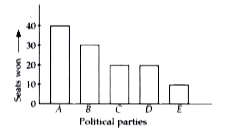
What is the total number of seats won by party A and party B?
View SolutionThe bar graph given here shows the number of jobseekers of a state in various years at different stages of education.
Study the graph carefully and answer the question based on it.
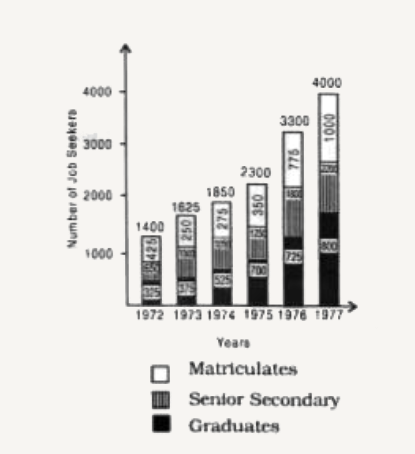
The number of job-seekers, having their qualification as Senior Secondary, in the year 1974 was :
View Solution
Knowledge Check
The bar graph, given here, shows the number of tickets sold by 6 students A, B, C, D, E and F during a fair. Observe the graph and answer questions based on it.
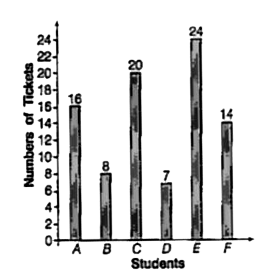
Total number of tickets sold by A, B and C isA45B44C42D40The bar graph, given here, shows the number of tickets sold by 6 students A, B, C, D, E and F during a fair. Observe the graph and answer questions based on it.
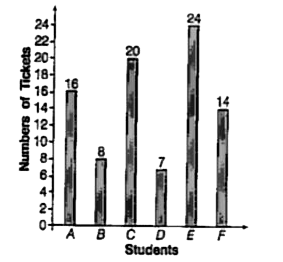
The least number of tickets were sold byABBFCADD
Given here is a bar graph showing the number of cycles produced in a factory during five consecutive weeks.
Observe the graph and answer the questions based on this graph.
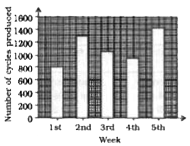
The number of cycles produced in the 5th week is
View SolutionThe bar graph given here shows the number of jobseekers of a state in various years at different stages of education.
Study the graph carefully and answer the question based on it.
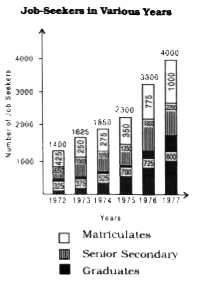
In which year, was the number of Matriculate job-seekers maximum ?
View SolutionDirections: The following bar graph shows the number of pages in five different books (viz. A, B, C, D and E). Study the graph carefully and answer the following questions.
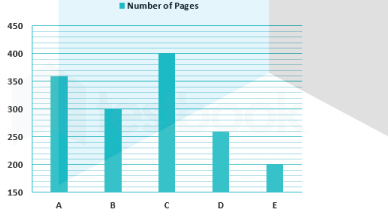
What is the ratio of total number of pages in book B and E together to the total number of pages in book C and D together?
View SolutionRead the bar graph which shows the number of books sold by a bookstore during five consecutive years and answer the following questions
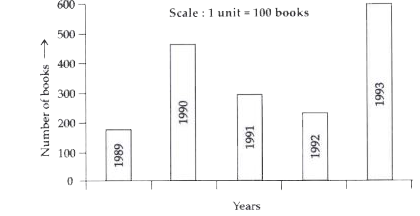
Can you give an appropriate name to the bar graph shown above ?
View SolutionDirections: Refer to the following graph and answer the given questions. Data related to the number of shoes sold by two stores (A and B )during five years:
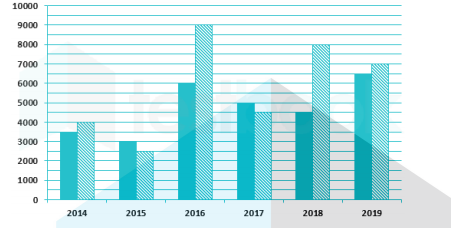
Find the ratio between the total number of shoes sold by stores A and B together in 2016 to the total number of shoes sold by stores A and B together in 2018?
View SolutionDirection: The given bar graph shows the number of pens sold by two shops A & B in four consecutive months. Study the following data and answer the following questions:
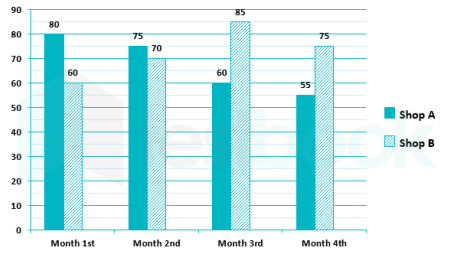
Find the ratio of the number of pens sold by shop A in 1st month to the number of pens sold by B in 3rd month.
View Solution
