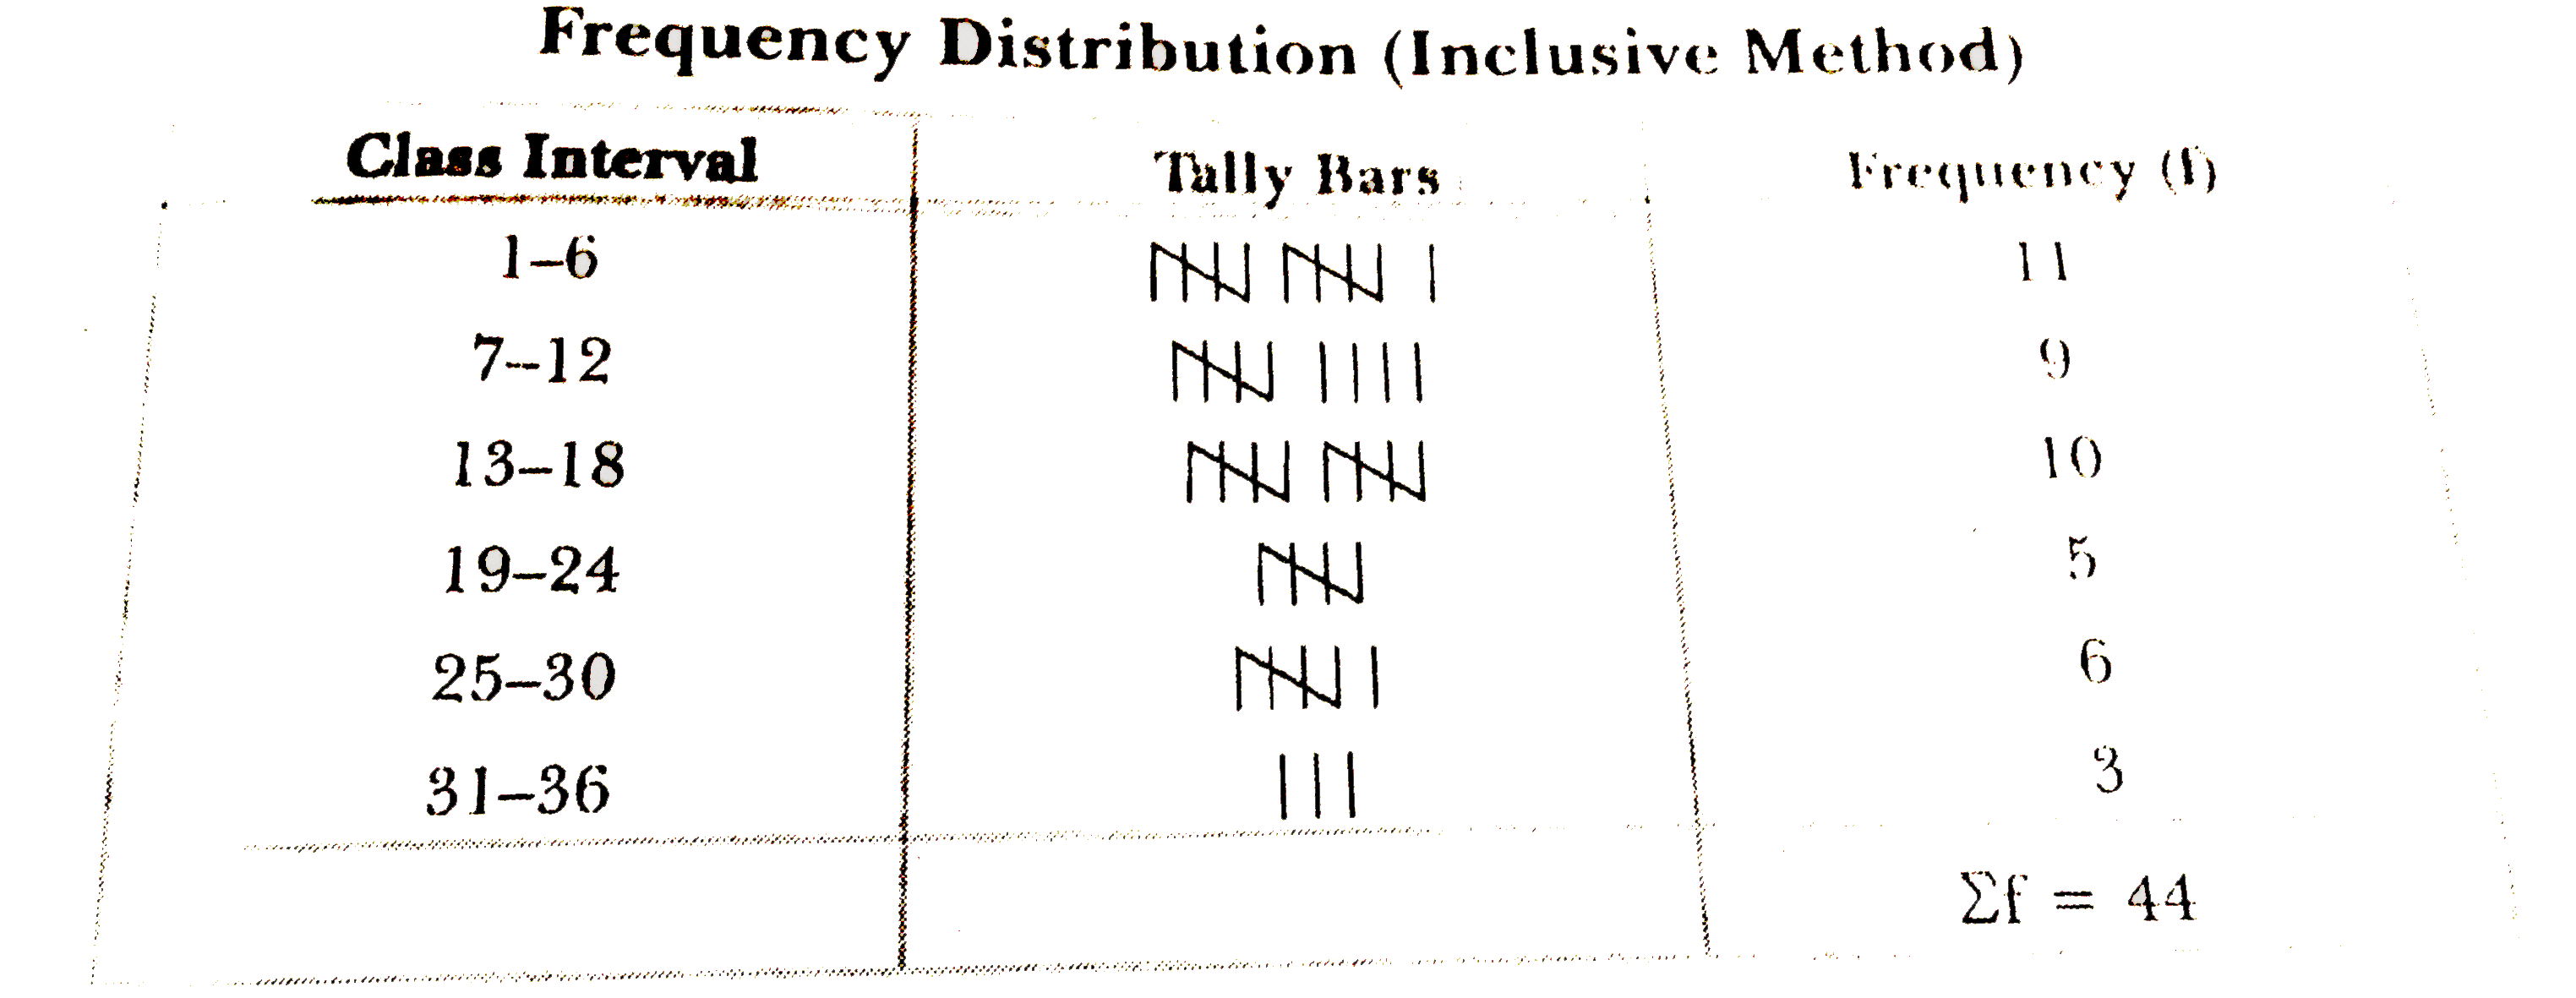
Make a frequency distribution (inclusive ) series of the following data. The class interval is to be taken as 6.

The lowest value is 1 and the highest value is 36. Accordingly, we take 1-6 as the initial class interval.
Topper's Solved these Questions
- ORGANISATION OF DATABOOK - TARUN JAIN & VK OHRICHAPTER - ORGANISATION OF DATAEXERCISE - EXERCISE M.C.Q
10 Videos
- ORGANISATION OF DATABOOK - TARUN JAIN & VK OHRICHAPTER - ORGANISATION OF DATAEXERCISE - EXERCISE FILL IN THE BLANK
7 Videos
- ORGANISATION OF DATABOOK - TARUN JAIN & VK OHRICHAPTER - ORGANISATION OF DATAEXERCISE - EXERCISE NCERT
13 Videos
- MEASURES OF DISPERSIONBOOK - TARUN JAIN & VK OHRICHAPTER - MEASURES OF DISPERSIONEXERCISE - Learning by doing
30 Videos
- PRESENTATION OF DATA - TEXTUAL AND TABULAR PRESENTATIONBOOK - TARUN JAIN & VK OHRICHAPTER - PRESENTATION OF DATA - TEXTUAL AND TABULAR PRESENTATIONEXERCISE - ESSENTIAL PRATICALS
8 Videos
Similar Questions
Frequency Distribution Series
View SolutionFrom the frequency distribution table from the following data
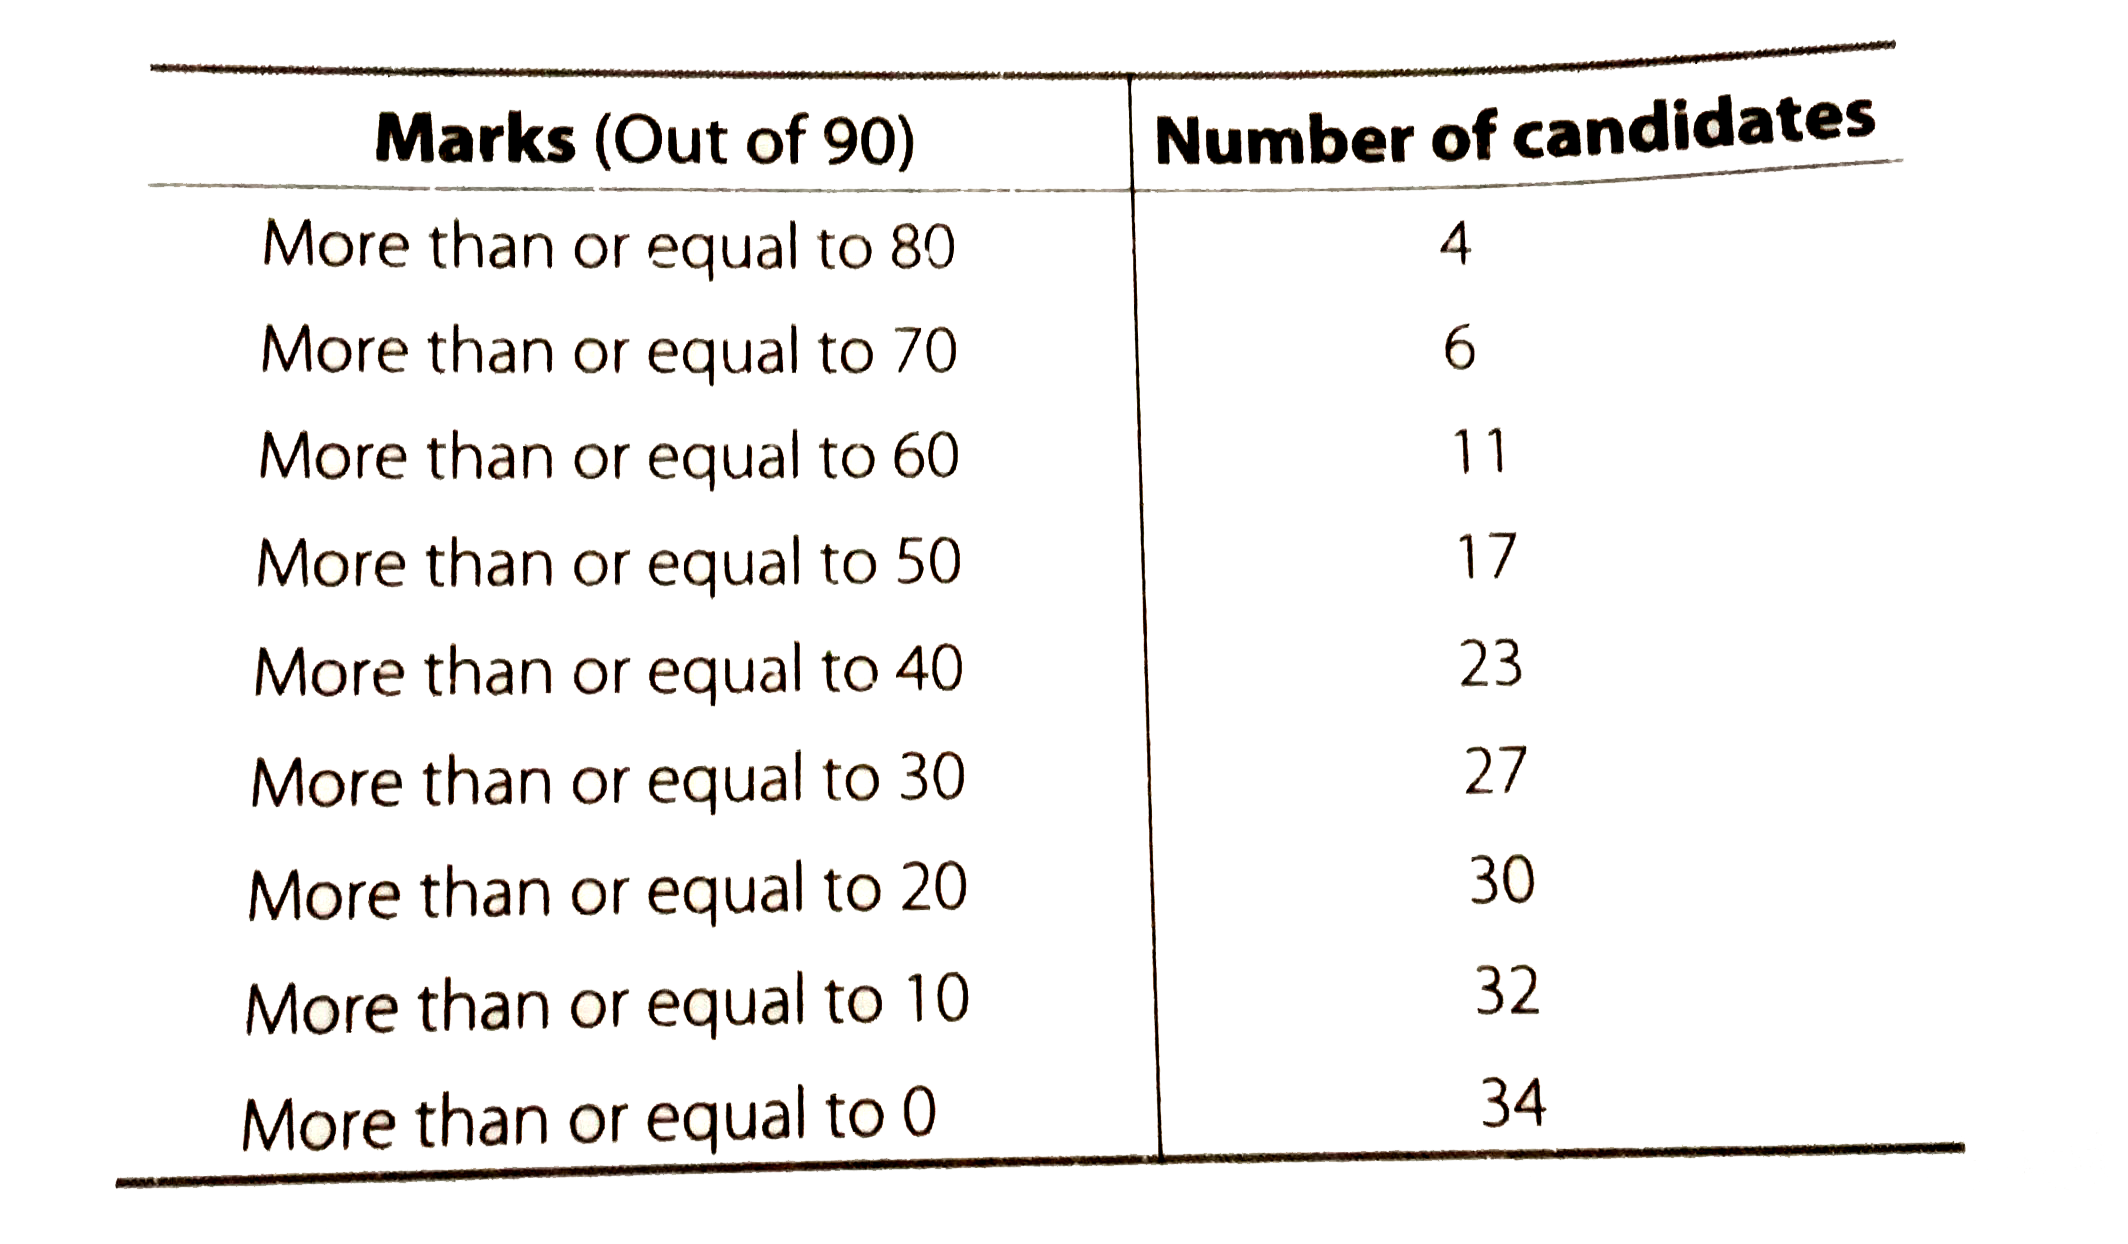
View SolutionDraw a histogram for the frequency distribution of the following data:

View SolutionDraw a histogram for the frequency distribution of the following data:

View SolutionPrapare a frequency distribution by inclusive method taking class interval of 7 from the following data :

View SolutionPrepare a continuous grouped frequency distribution from the following data
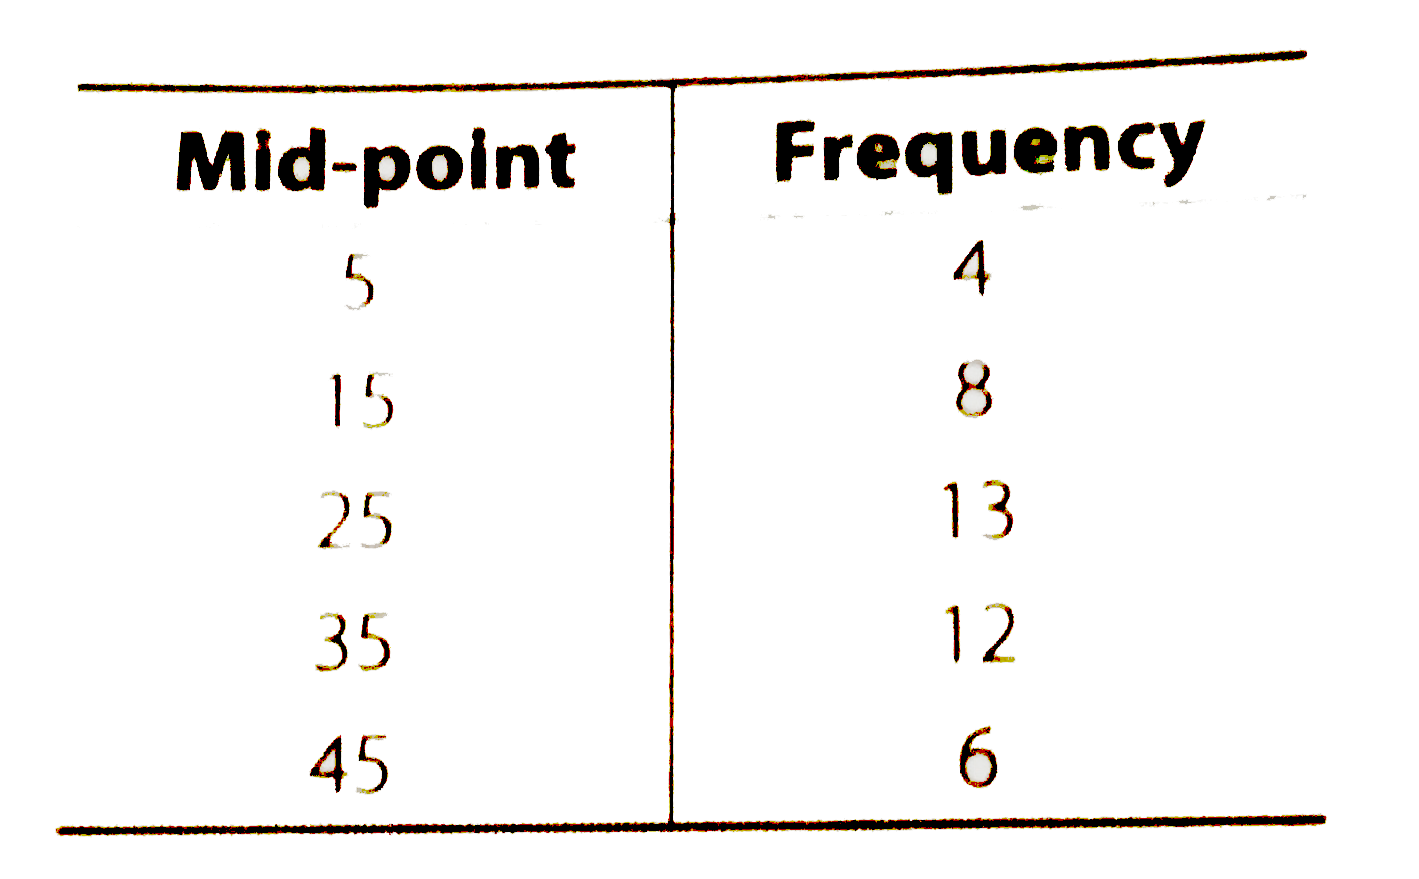
Also, find the size of class intervals.
View SolutionMake a frequency curve of the following data :

View SolutionRead the frequency distribution table given below and answer the questions that follow:
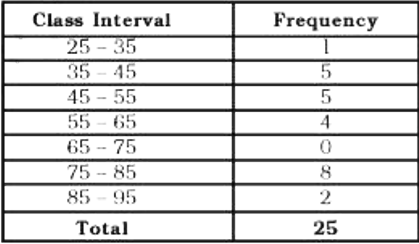
Class interval which has the lowest frequency.
View SolutionIn a frequency distribution with classes 0-10, 10-20 etc., the size of the class intervals is 10. The lower limit of fourth class is
View SolutionForm the frequency distribution table from the following data:
Construct the frequency distribution table for the above data.
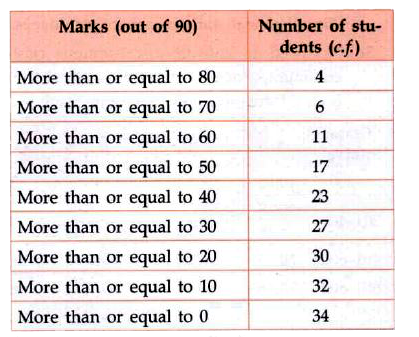
View Solution
