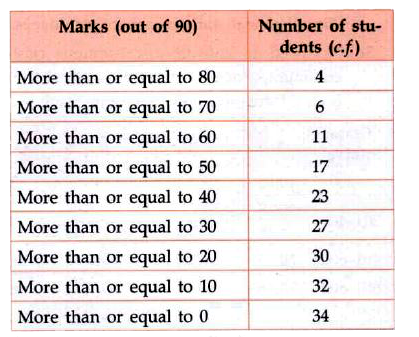
From the frequency distribution table from the following data
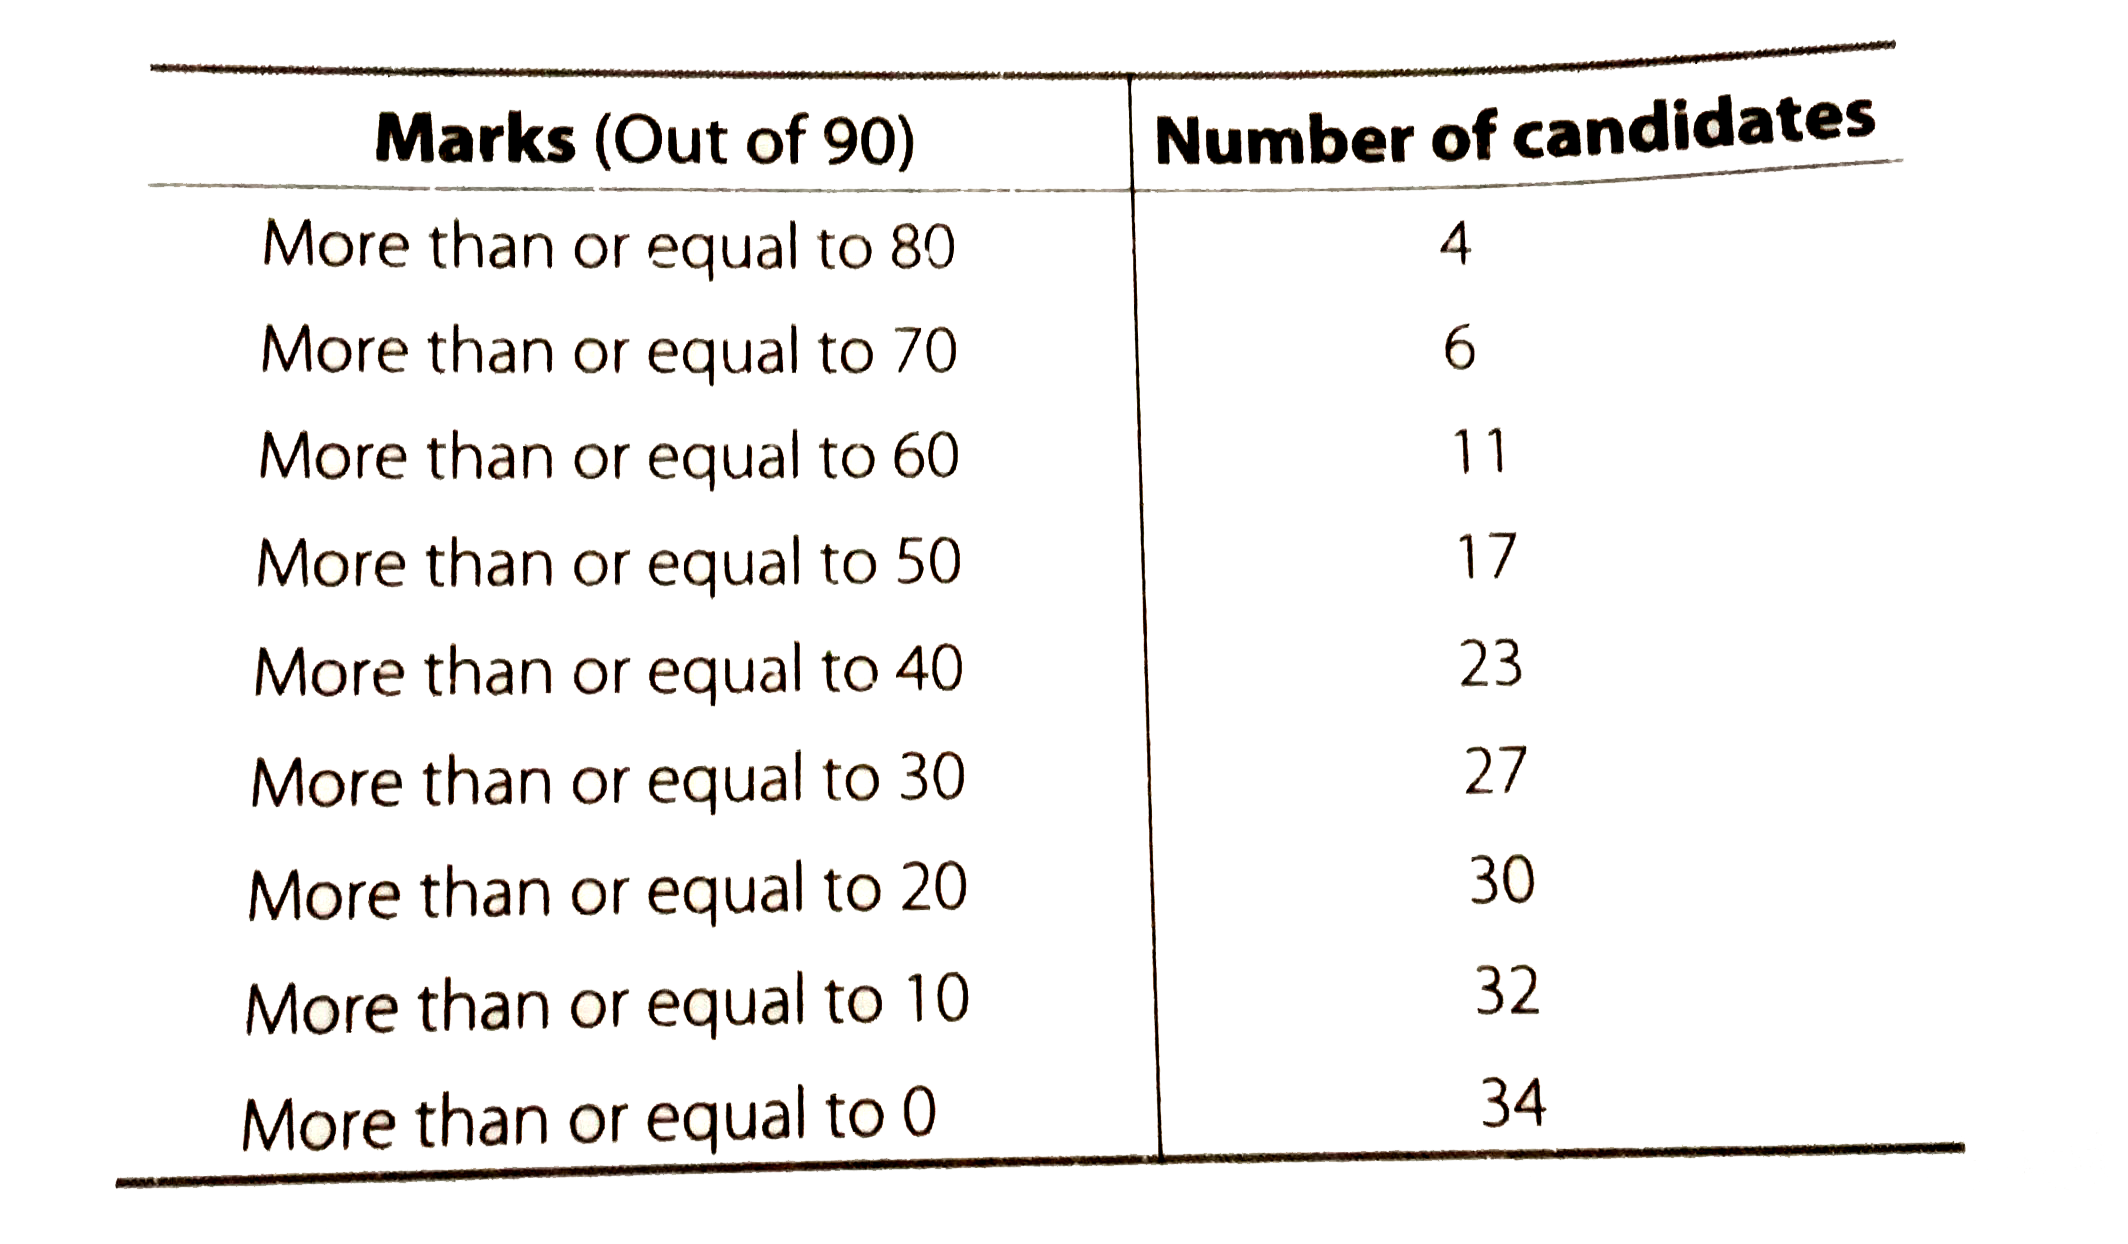
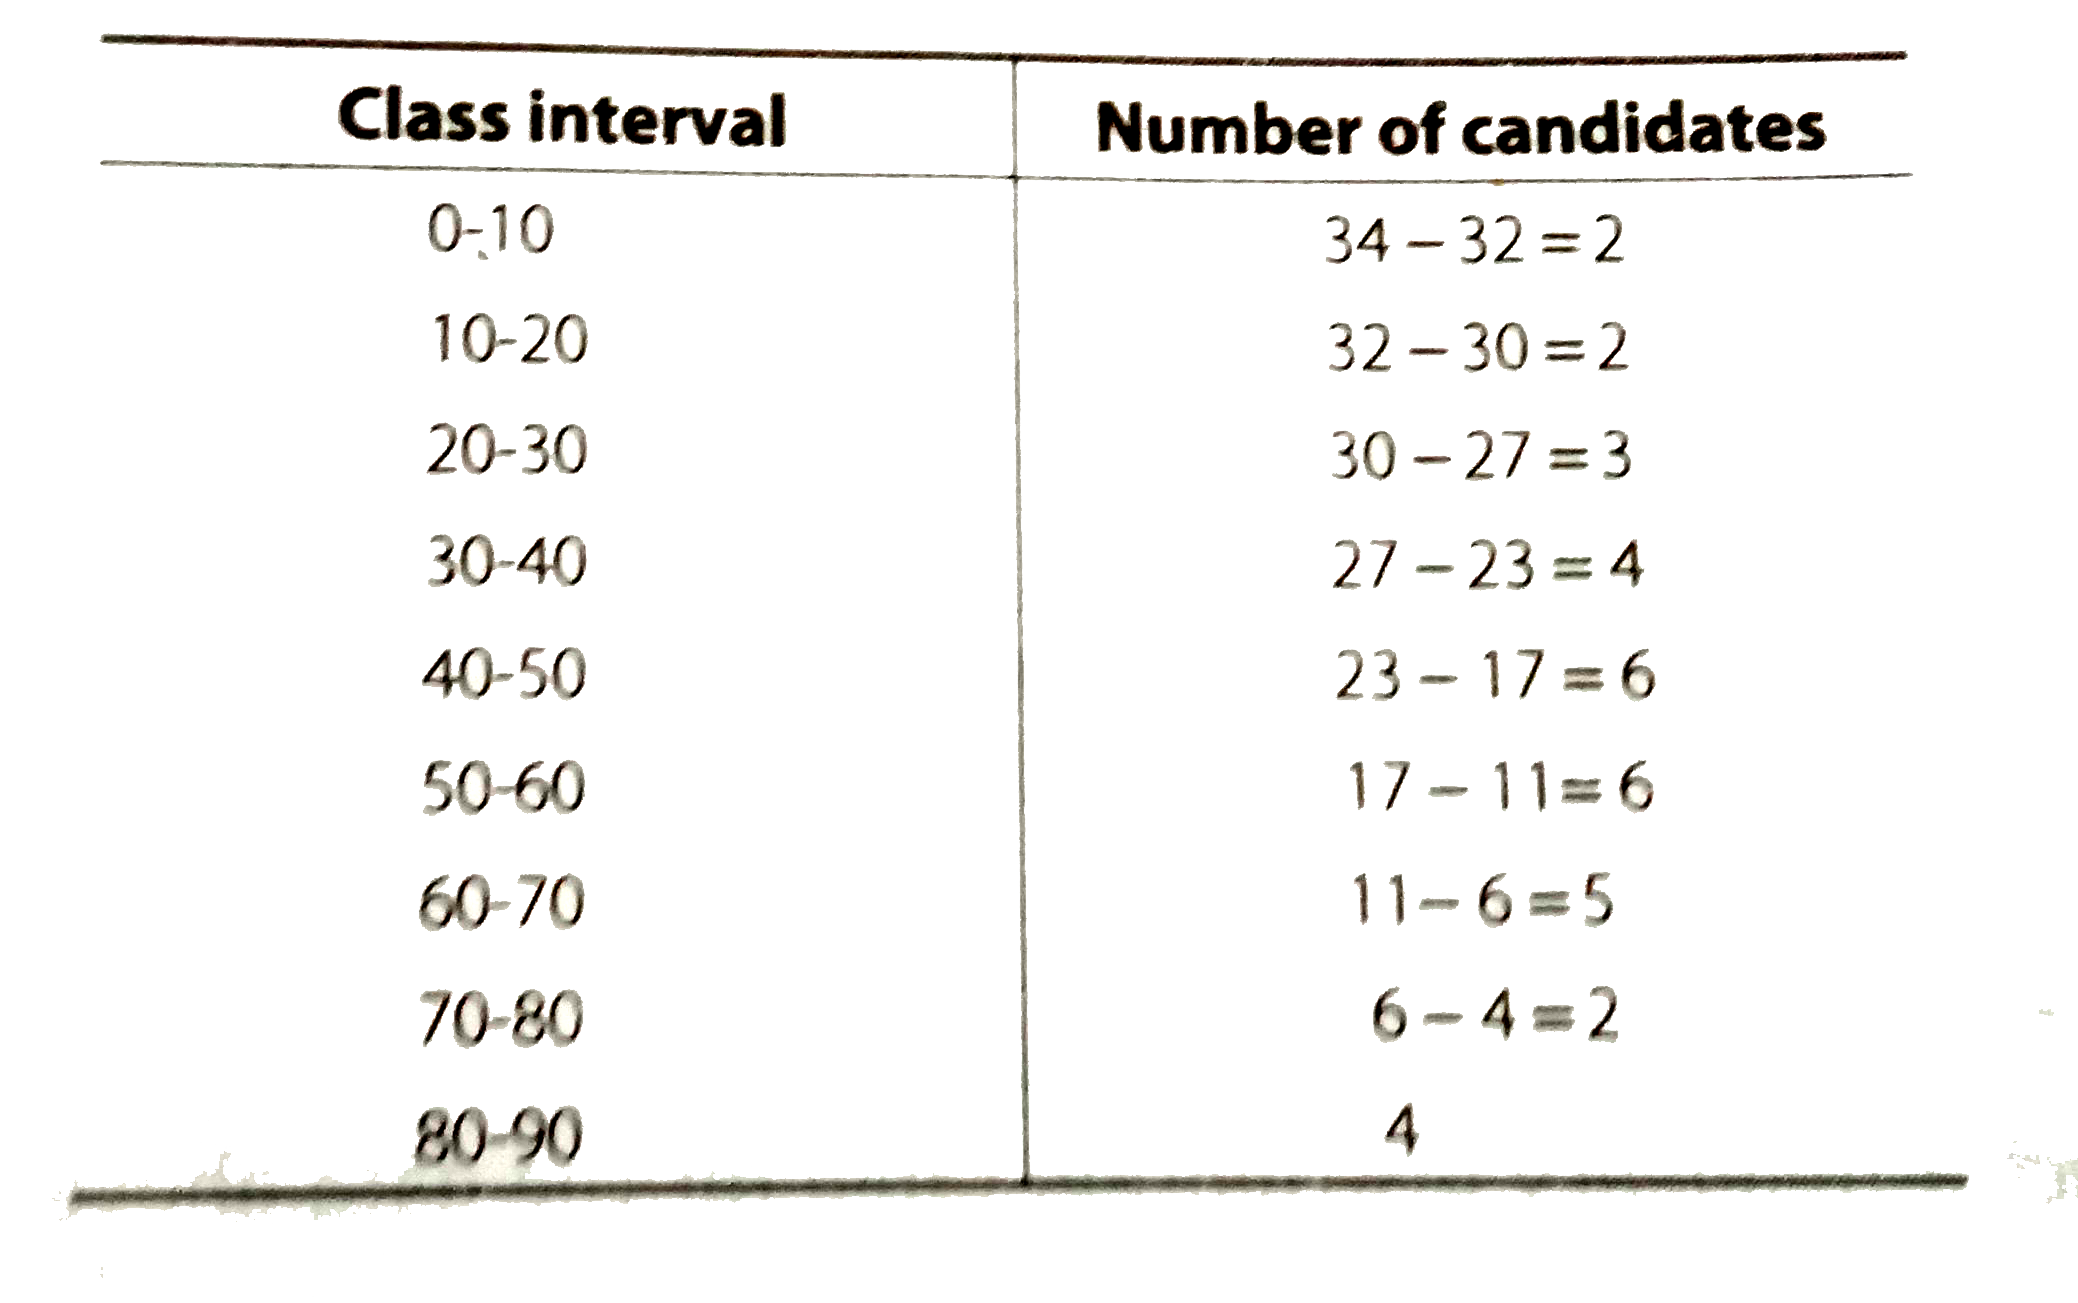
Herem we observe that, all 34 students have scored marks more than or equal to 0. Since, 32 students have scored marks more than or equal to 10. So, 34-32=2 students lies in the interval 0-10 and so on. Now, we construct the frequency distribution table.
Topper's Solved these Questions
- STATISTICS AND PROBABILITYBook:NCERT EXEMPLARChapter:STATISTICS AND PROBABILITYExercise:VERY SHORT ANSWERS QUESTIONS
Explore 2 Videos
- STATISTICS AND PROBABILITYBook:NCERT EXEMPLARChapter:STATISTICS AND PROBABILITYExercise:LONG ASWERS QUESTIONS
Explore 5 Videos
- REAL NUMBERSBook:NCERT EXEMPLARChapter:REAL NUMBERSExercise:Real Numbers
Explore 39 Videos
- SURFACE AREAS AND VOLUMESBook:NCERT EXEMPLARChapter:SURFACE AREAS AND VOLUMESExercise:Surface Areas And Volumes
Explore 62 Videos
Similar Questions
Knowledge Check
The median from the following data
 A83.17B84.08C82.17D85.67
Draw a histogram for the frequency distribution of the following data:

View SolutionPrepare a continuous grouped frequency distribution from the following data
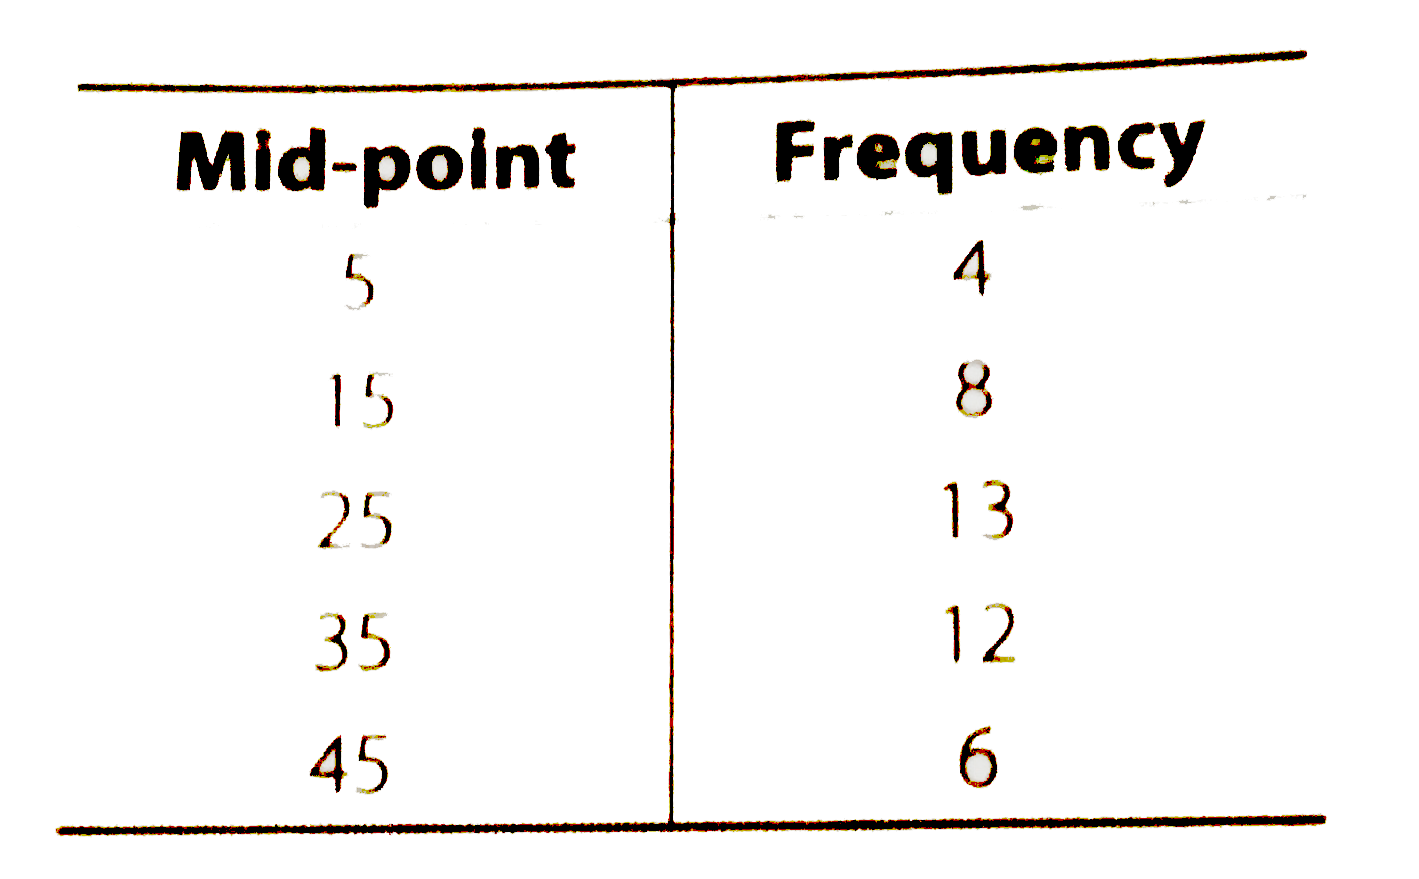
Also, find the size of class intervals.
View SolutionGiven below is a cumulative frequency distribution showing the mars secured by 50 students of a class

From the frequency distribution table for the data.
View Solutionusing class intervals 1−5,6−10,11−15,........ construct the frequency distribution following data:
View SolutionMake a frequency distribution (inclusive ) series of the following data. The class interval is to be taken as 6.

View SolutionThree coins were tossed 30 times simultaneously. Each time the number of heads occurring was noted down as follows: 0 1 2 2 1 2 3 1 3 0 1 3 1 1 2 2 0 1 2 1 3 0 0 1 1 2 3 2 2 0 Prepare a frequency distribution table for the data given above.
View SolutionThe following table show tha cumulative frequency distribution of marks of 800 students in an examination.
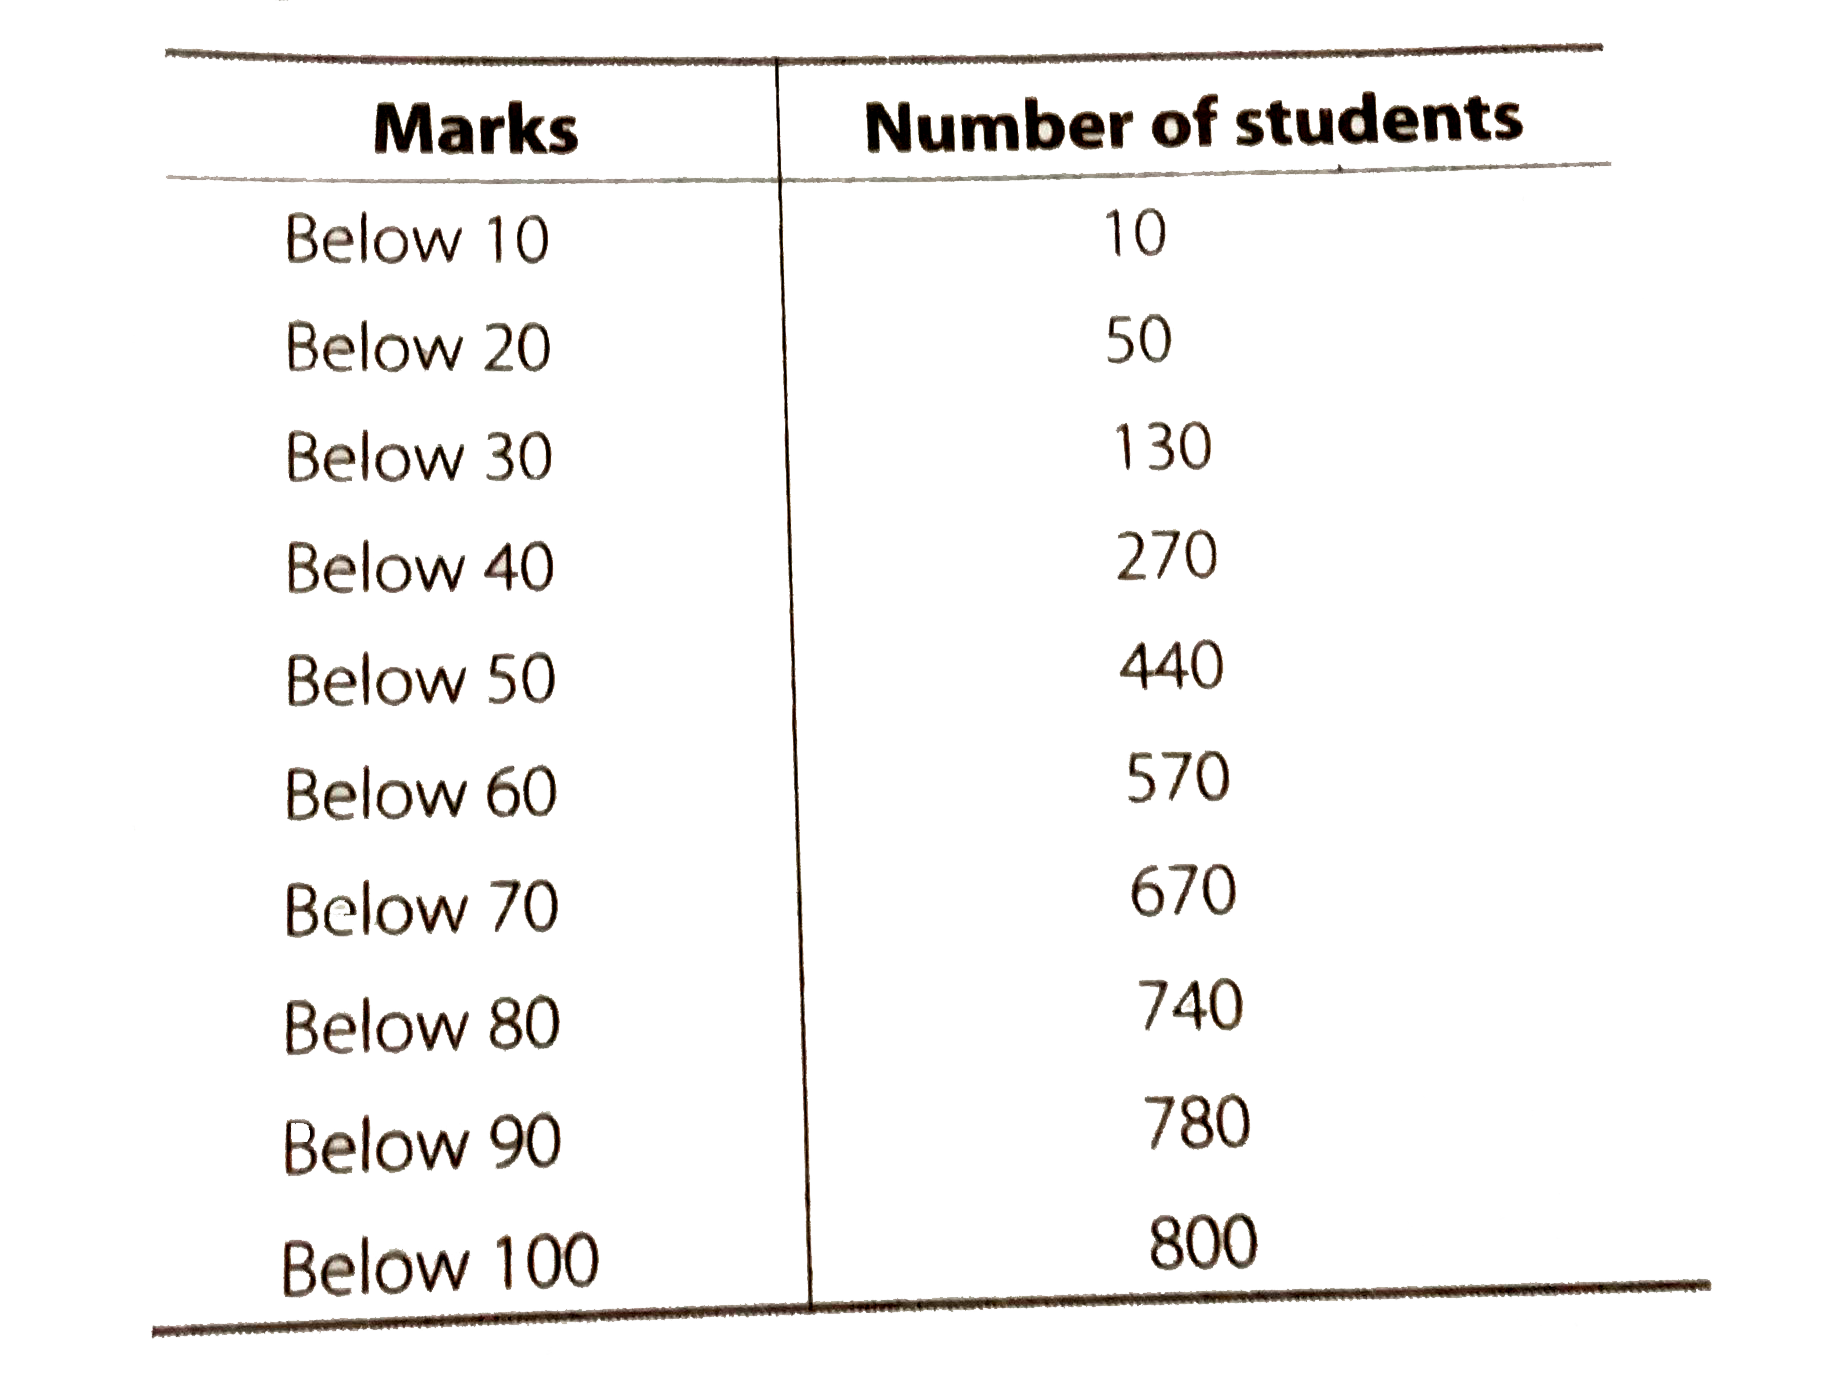
Construct a frequency distribution table for the data above.
View Solution


