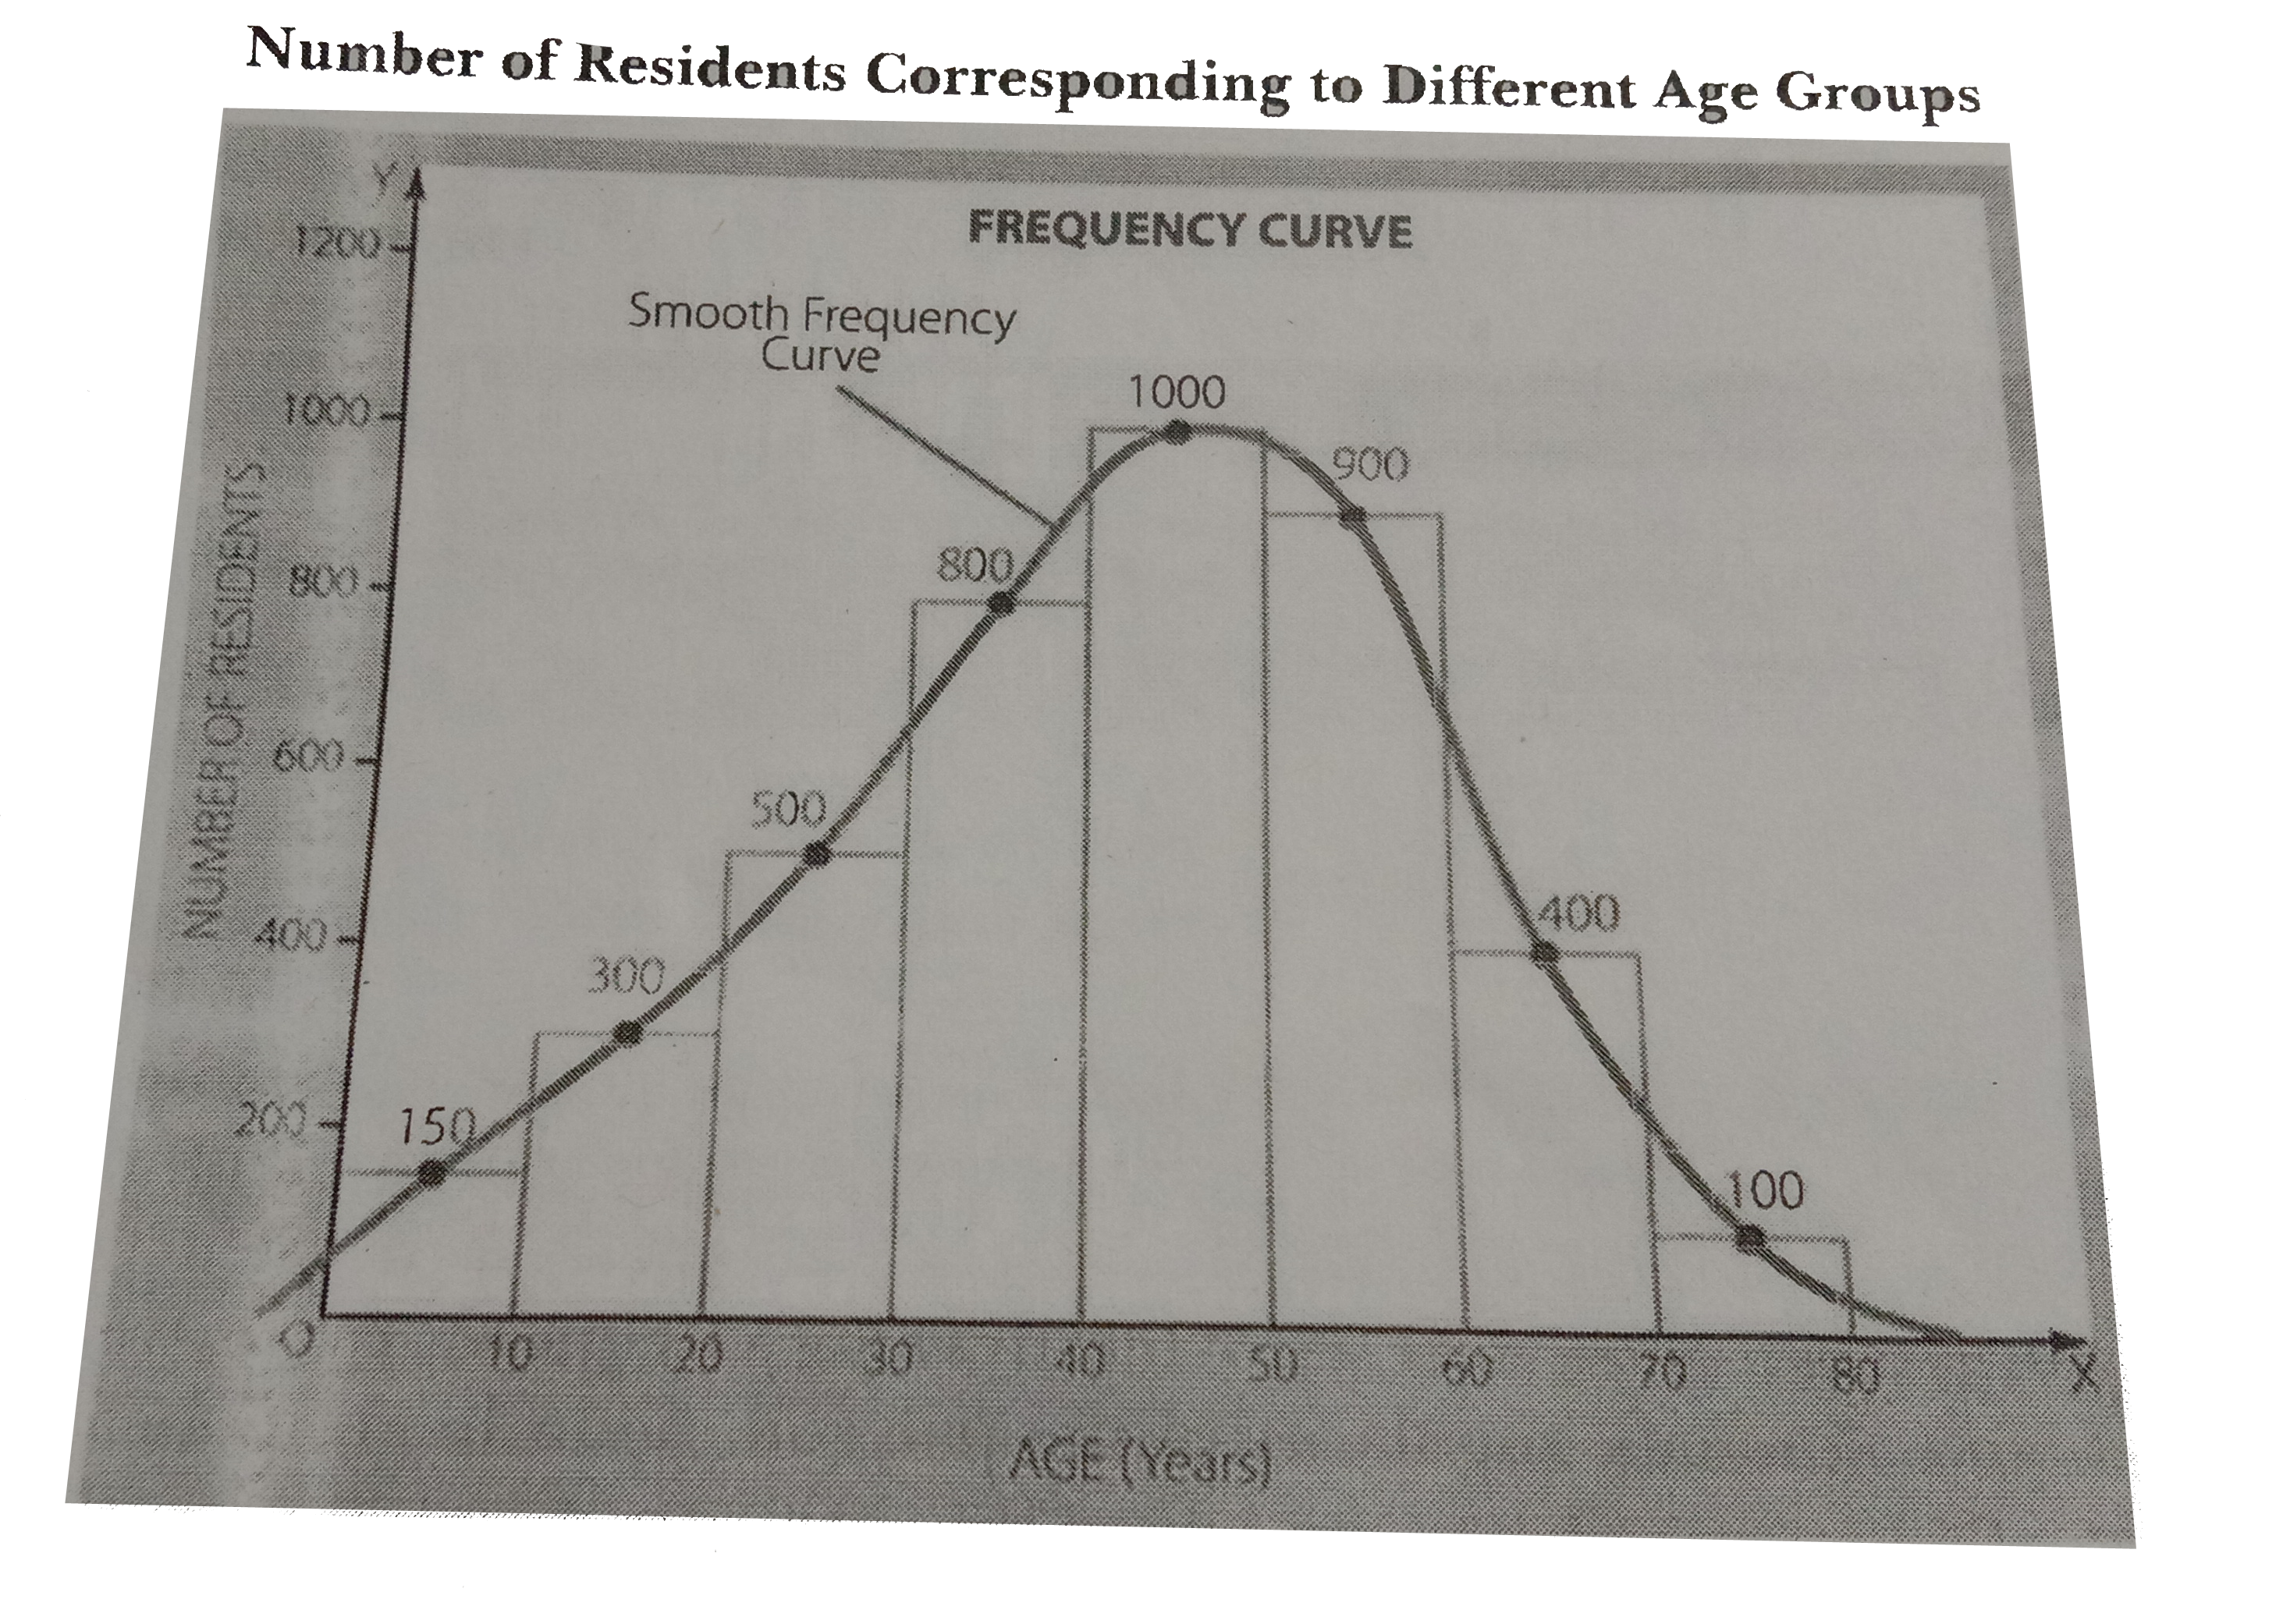
Make a frequency curve of the following data :

Video Solution
Text Solution
The given data set is first converted into a histogram. Midpoints of the top of the rectangles of the histogram are marked. These points are joined through a freehand smooth curve, as given below:

|
Topper's Solved these Questions
- FREQUENCY DIAGRAMS - HISTOGRAM, POLYGON AND OGIVEBOOK - TARUN JAIN & VK OHRICHAPTER - FREQUENCY DIAGRAMS - HISTOGRAM, POLYGON AND OGIVEEXERCISE - Miscellaneous Illustration
8 Videos
- FREQUENCY DIAGRAMS - HISTOGRAM, POLYGON AND OGIVEBOOK - TARUN JAIN & VK OHRICHAPTER - FREQUENCY DIAGRAMS - HISTOGRAM, POLYGON AND OGIVEEXERCISE - EXERCISE M.C.Q
6 Videos
- DIAGRAMMATIC PRESENTATION OF DATA BAR DIAGRAMS AND PIE DIAGRAMSBOOK - TARUN JAIN & VK OHRICHAPTER - DIAGRAMMATIC PRESENTATION OF DATA BAR DIAGRAMS AND PIE DIAGRAMSEXERCISE - NCERT Question (With Hints to Answers)
3 Videos
- INDEX NUMBERSBOOK - TARUN JAIN & VK OHRICHAPTER - INDEX NUMBERSEXERCISE - NCERT Questions (With Hints to Answers)
12 Videos
Similar Questions
Knowledge Check
Represent the following data by frequency curve :
 ASymmetricalBPositive skenCNegative skewDall of these
Make the frequency table and the cumulative frequency curve for following data
View SolutionPrepare histogram and frequency polygon from the following data :

View SolutionDraw a histogram for the frequency distribution of the following data:

View SolutionDraw a histogram for the frequency distribution of the following data:

View SolutionDraw a less than cumuative frequency curve (ogive) for the following distribution :

View SolutionDraw a frequency polygon from the following data by using (i) histogram , and (ii) without using histogram :

View SolutionDraw a frequency polygon from the following data, giving the age of doctors working in C.G.H.S. in a city.

View Solution

