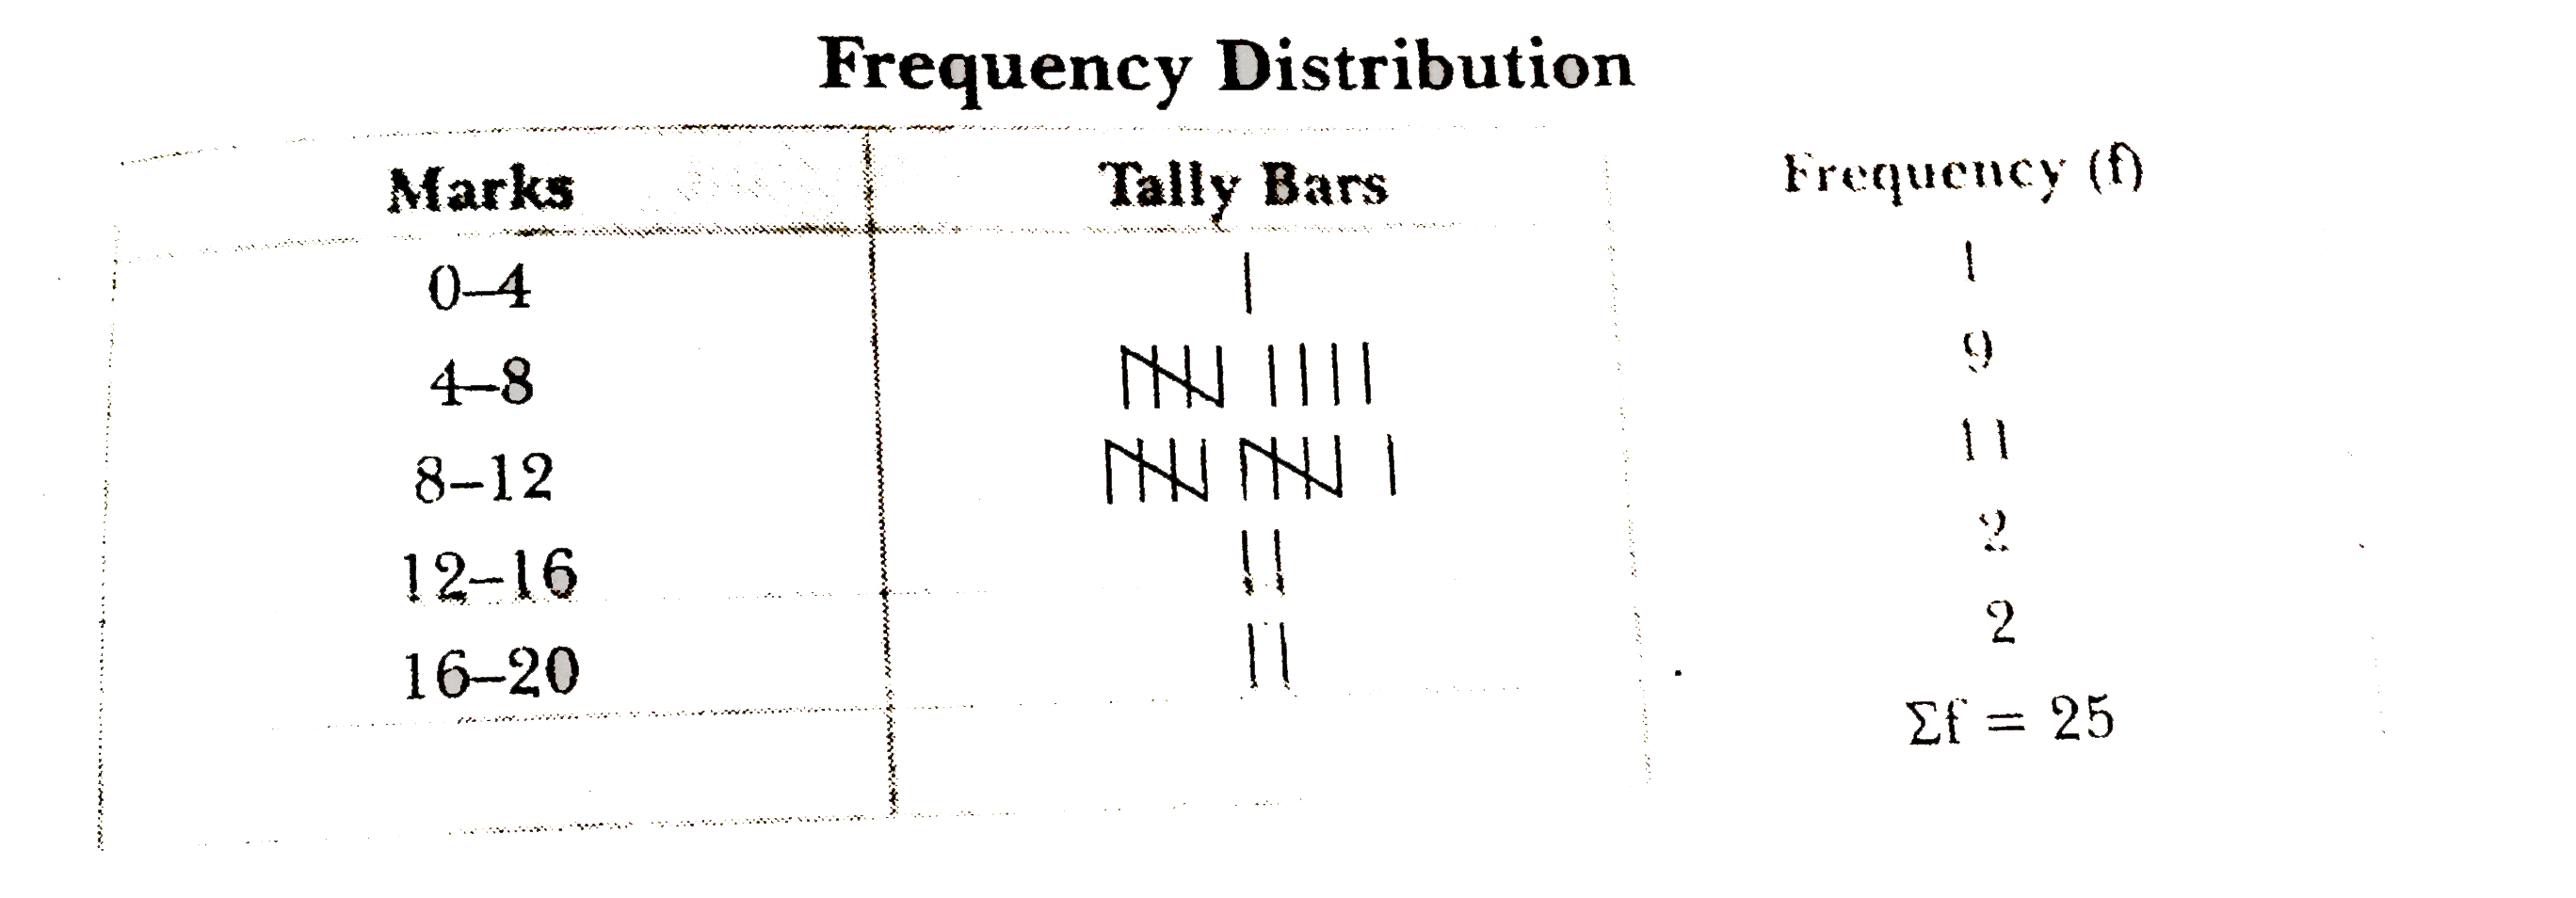
Following are the marks obtained by 25 students in Statistics . Prepare a frequency distribution by taking a class interval of 4 on exclusive basis.

Video Solution
Text Solution
The lowest value is 3 and highest value is 18. We have to take a class interval of 4. The various classes will be 0-4,4-8 and so on up to 16-20.

|
Topper's Solved these Questions
- ORGANISATION OF DATABOOK - TARUN JAIN & VK OHRICHAPTER - ORGANISATION OF DATAEXERCISE - EXERCISE M.C.Q
10 Videos
- ORGANISATION OF DATABOOK - TARUN JAIN & VK OHRICHAPTER - ORGANISATION OF DATAEXERCISE - EXERCISE FILL IN THE BLANK
7 Videos
- ORGANISATION OF DATABOOK - TARUN JAIN & VK OHRICHAPTER - ORGANISATION OF DATAEXERCISE - EXERCISE NCERT
13 Videos
- MEASURES OF DISPERSIONBOOK - TARUN JAIN & VK OHRICHAPTER - MEASURES OF DISPERSIONEXERCISE - Learning by doing
30 Videos
- PRESENTATION OF DATA - TEXTUAL AND TABULAR PRESENTATIONBOOK - TARUN JAIN & VK OHRICHAPTER - PRESENTATION OF DATA - TEXTUAL AND TABULAR PRESENTATIONEXERCISE - ESSENTIAL PRATICALS
8 Videos
Similar Questions
Knowledge Check
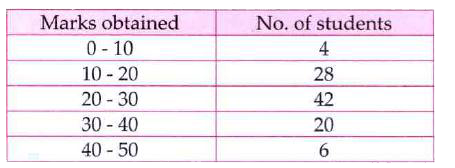
The table shows the marks obtained by 25 students in a class test. Find the mean of the marks obtained
 A7.72B7.65C7.4D7
Consider the following statements in respect of class intervals of grouped frequency distribution:
1. Class intervals need out be mutually exclusive.
2. Class intervals should be exhaustive.
3. Class intervals need not be of equal width.
Which of the above statements are correct?A1 and 2 onlyB2 and 3 onlyC1 and 3 onlyD1, 2 and 3Consider the following statements in respect of class intervals of grouped frequency distribution.
1 Class intervals need not be mutually exclusive.
2.Class intervals should be exhaustive
3.Class intervals need not be of equal width Which of the above statements are correctABoth 1 and 2BBoth 2 and 3CBoth 1 and 3D1, 2 and 3
Following are the marks obtained by 20 students in statistics. Find out coefficient of variation of the marks.

View SolutionPrapare a frequency distribution by inclusive method taking class interval of 7 from the following data :

View SolutionThe marks obtained by 32 students of a class are given below. Prepare a frequency table with class intervals 31−40,41−50,….. etc.

View SolutionFollowing are the marks obtained by 30 students in a examination

Taking class intervals 0−10,10−20,…..40−50 construct a frequency table.
View SolutionThe marks of students of a class are given in following frequency distribution. Find the mean.

View Solution


