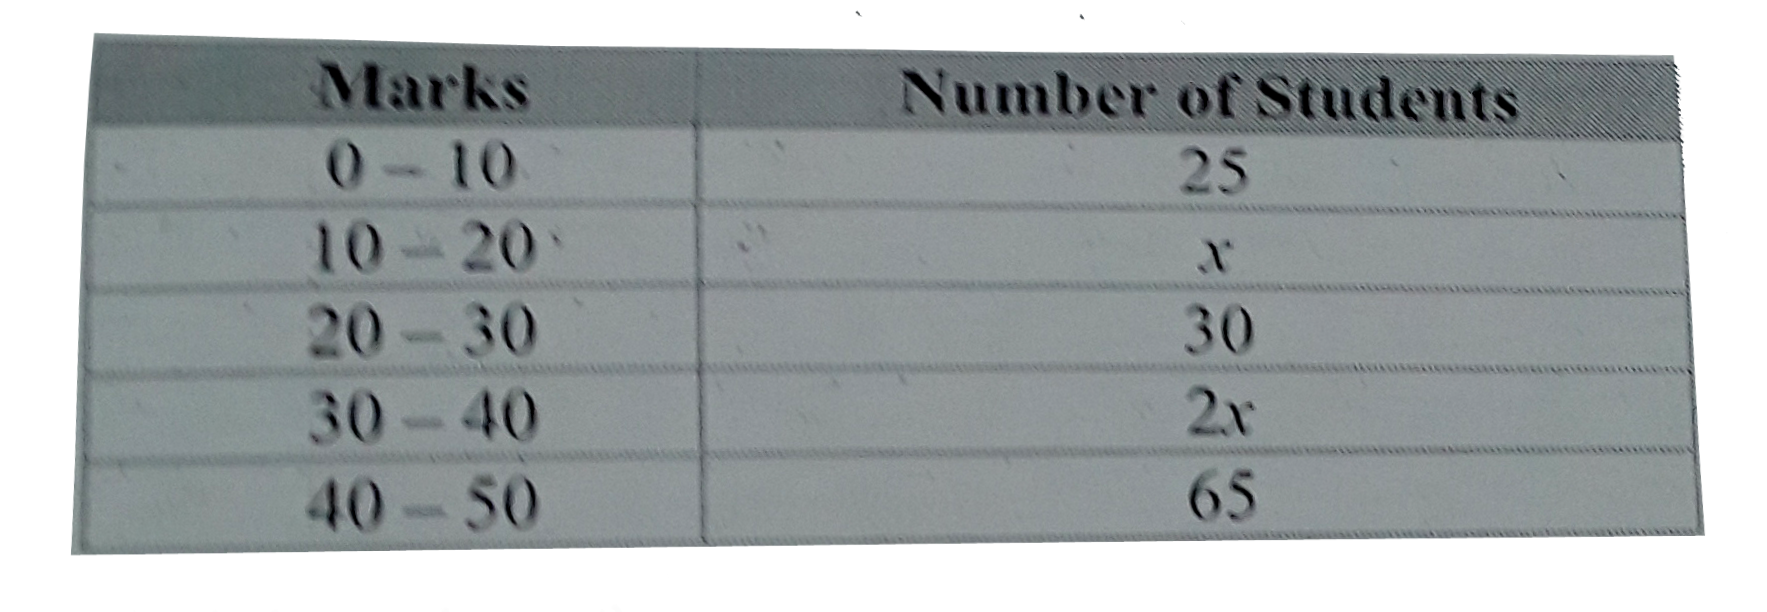
Following are the marks obtained by 30 students in a examination

Taking class intervals 0−10,10−20,…..40−50 construct a frequency table.
The correct Answer is:(##NTNMATHIXC14E01004_A01##)
Step by step video, text & image solution for Following are the marks obtained by 30 students in a examination Taking class intervals 0-10, 10-20,….. 40-50 construct a frequency table. by Maths experts to help you in doubts & scoring excellent marks in Class 9 exams.
Updated on:21/07/2023Topper's Solved these Questions
- STATISTICSBOOK - NAGEEN PRAKASHANCHAPTER - STATISTICSEXERCISE - Exercise 14c
20 Videos
- STATISTICSBOOK - NAGEEN PRAKASHANCHAPTER - STATISTICSEXERCISE - Revision Exercise
10 Videos
- STATISTICSBOOK - NAGEEN PRAKASHANCHAPTER - STATISTICSEXERCISE - Problems From NCERT/exemplar
22 Videos
- QUADRILATERALSBOOK - NAGEEN PRAKASHANCHAPTER - QUADRILATERALSEXERCISE - Revision Exercise (long Answer Questions)
5 Videos
- SURFACE AREA AND VOLUMEBOOK - NAGEEN PRAKASHANCHAPTER - SURFACE AREA AND VOLUMEEXERCISE - Revision Exercise (long Answer Questions)
10 Videos
Similar Questions
Following are the marks obtained by 25 students in Statistics . Prepare a frequency distribution by taking a class interval of 4 on exclusive basis.

View SolutionThe following are the marks obtained by 30 students of Class XI in Statistics.

Prepare a frequency distribution by taking a class interval of 5 on exclusive basis.
View Solution
Knowledge Check
Given data shows marks of 32 students in an examination. Mean of the marks will be
Class interval0−1010−2020−3030−4040−50Frequency126842A18.125B21.875C22.425D22.545
The marks obtained by 32 students of a class are given below. Prepare a frequency table with class intervals 31−40,41−50,….. etc.

View SolutionThe following table gives the marks scored by 100 students in an entrance examination.

View SolutionGiven below are the marks obtained by 30 students of a class, Using the class intervals of equal class size in which one class interval is 30-40 (excluding 40), construct a frequency table.
427439484280353852813172655877827965473064563948606372504635
View SolutionThe following frequency distbution table shows marks obtained by 180 students in Mathematics examination

Find the value of x .
View SolutionThe following table shows marks secured by the students of a class in an examination in English:
Marks0−1010−2020−3030−4040−50Number of Students 20 24 40 36 20
Calculte mean marks using Short-cut Method.
View SolutionThe following table shows marks secured by the students of a class in an examination in English:
Marks0−1010−2020−3030−4040−50Number of Students 20 24 40 36 20
Calculte mean marks using Short-cut Method.
View SolutionThe following table shows marks obtained by the students of a class in their test in English:
Marks0−1010−2020−3030−4040−50Number of Students 20 24 40 36 20
Calculate arithmetic mean using Step-deviation method.
View Solution
