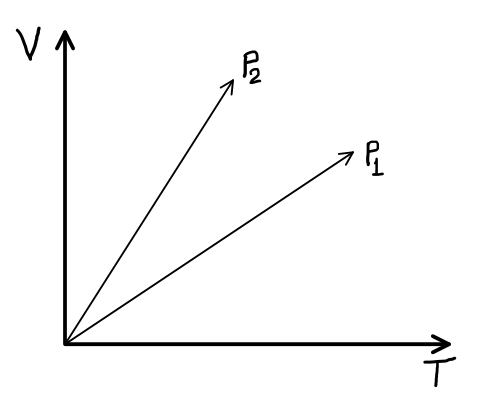
Volume versus temperature graphs for a given mass of an ideal gas are shown in figure. At two different values of constant pressure. What can be inferred about relation between P1 and P2 ?
A
P1>P2
B
P1=P2
C
P1<P2
D
Data is insufficient
Video Solution
Text Solution
We Know for an ideal gas
pV=nRT⇒V=(nRp)T
Slope of the V - T graph m=dvdT=nRp [m=slopel of V−tgraph]
⇒ m∝1p [∴nR= constant]
⇒ p∝1m
hence (p1))P2=M2M1<1 (##ARHNCERTEXEPHYXIC12S01005_S01.png width=80%><br>WhereM_(1)isslopeofthegraphcorrespo∈d∈g→p_(1)andsimilarlym_(2)isslopecorrespo∈d∈g→p_(2)<br>rArr " " p_(2) lt p_(2) " or " p_(1) gt p_(2)
|
Updated on:21/07/2023
Topper's Solved these Questions
Similar Questions
Knowledge Check
- Question 1 - Select One
Volume versus temperature graphs for a given mass of an ideal gas are shown in Fig. at two different values of constant pressure. What can be inferred about relation between P1andP2?
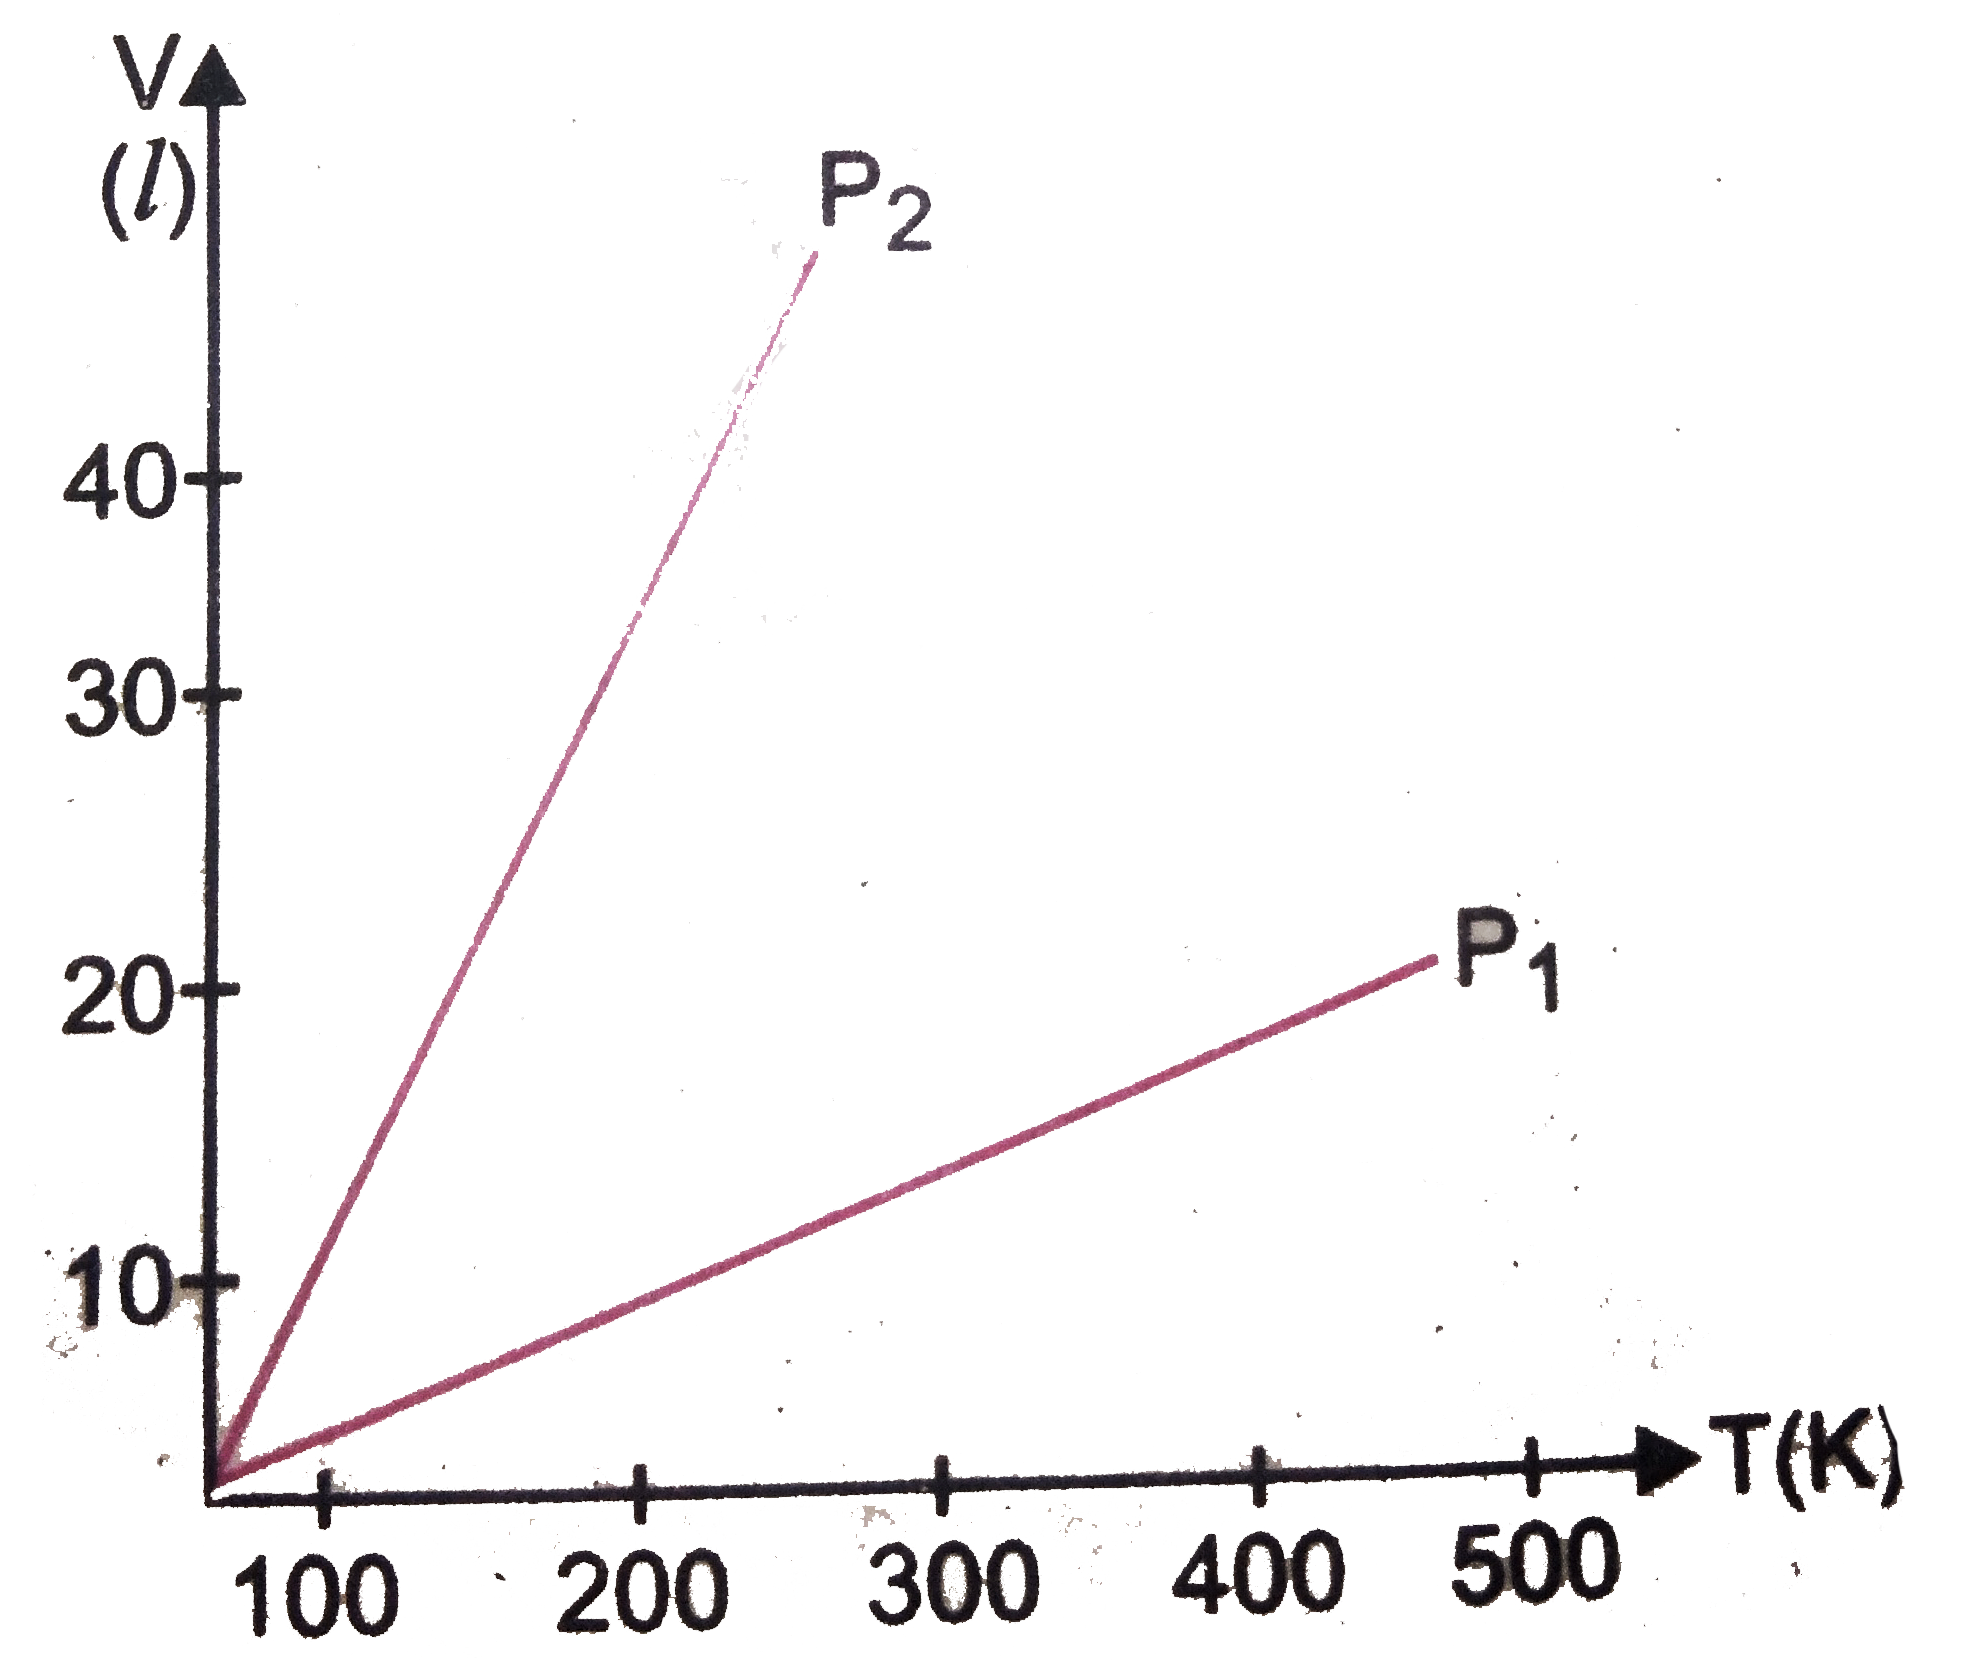 AP1>P2BP1=P2CP1<P2Ddata is insufficient.
 - Question 2 - Select One
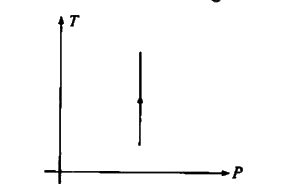
The P−T graph for the given mass of an ideal gas is shown in figure. Then the volume
_E01_022_Q01.png) AincreasesBdecreasesCremains constantDdata insuficient
AincreasesBdecreasesCremains constantDdata insuficient - Question 3 - Select One
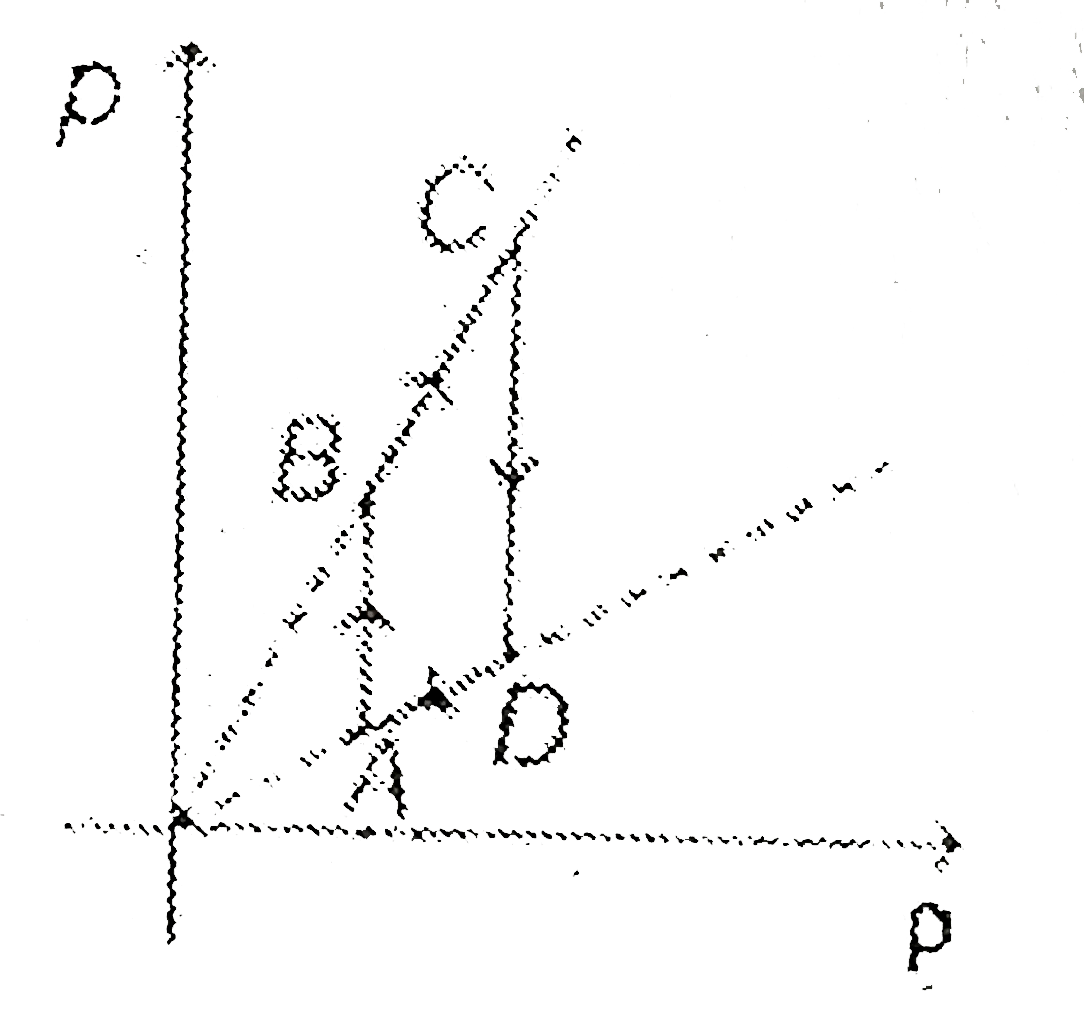
Pressure versus temperature graphs of an ideal gas are as shown in figure. Choose the wrong statement
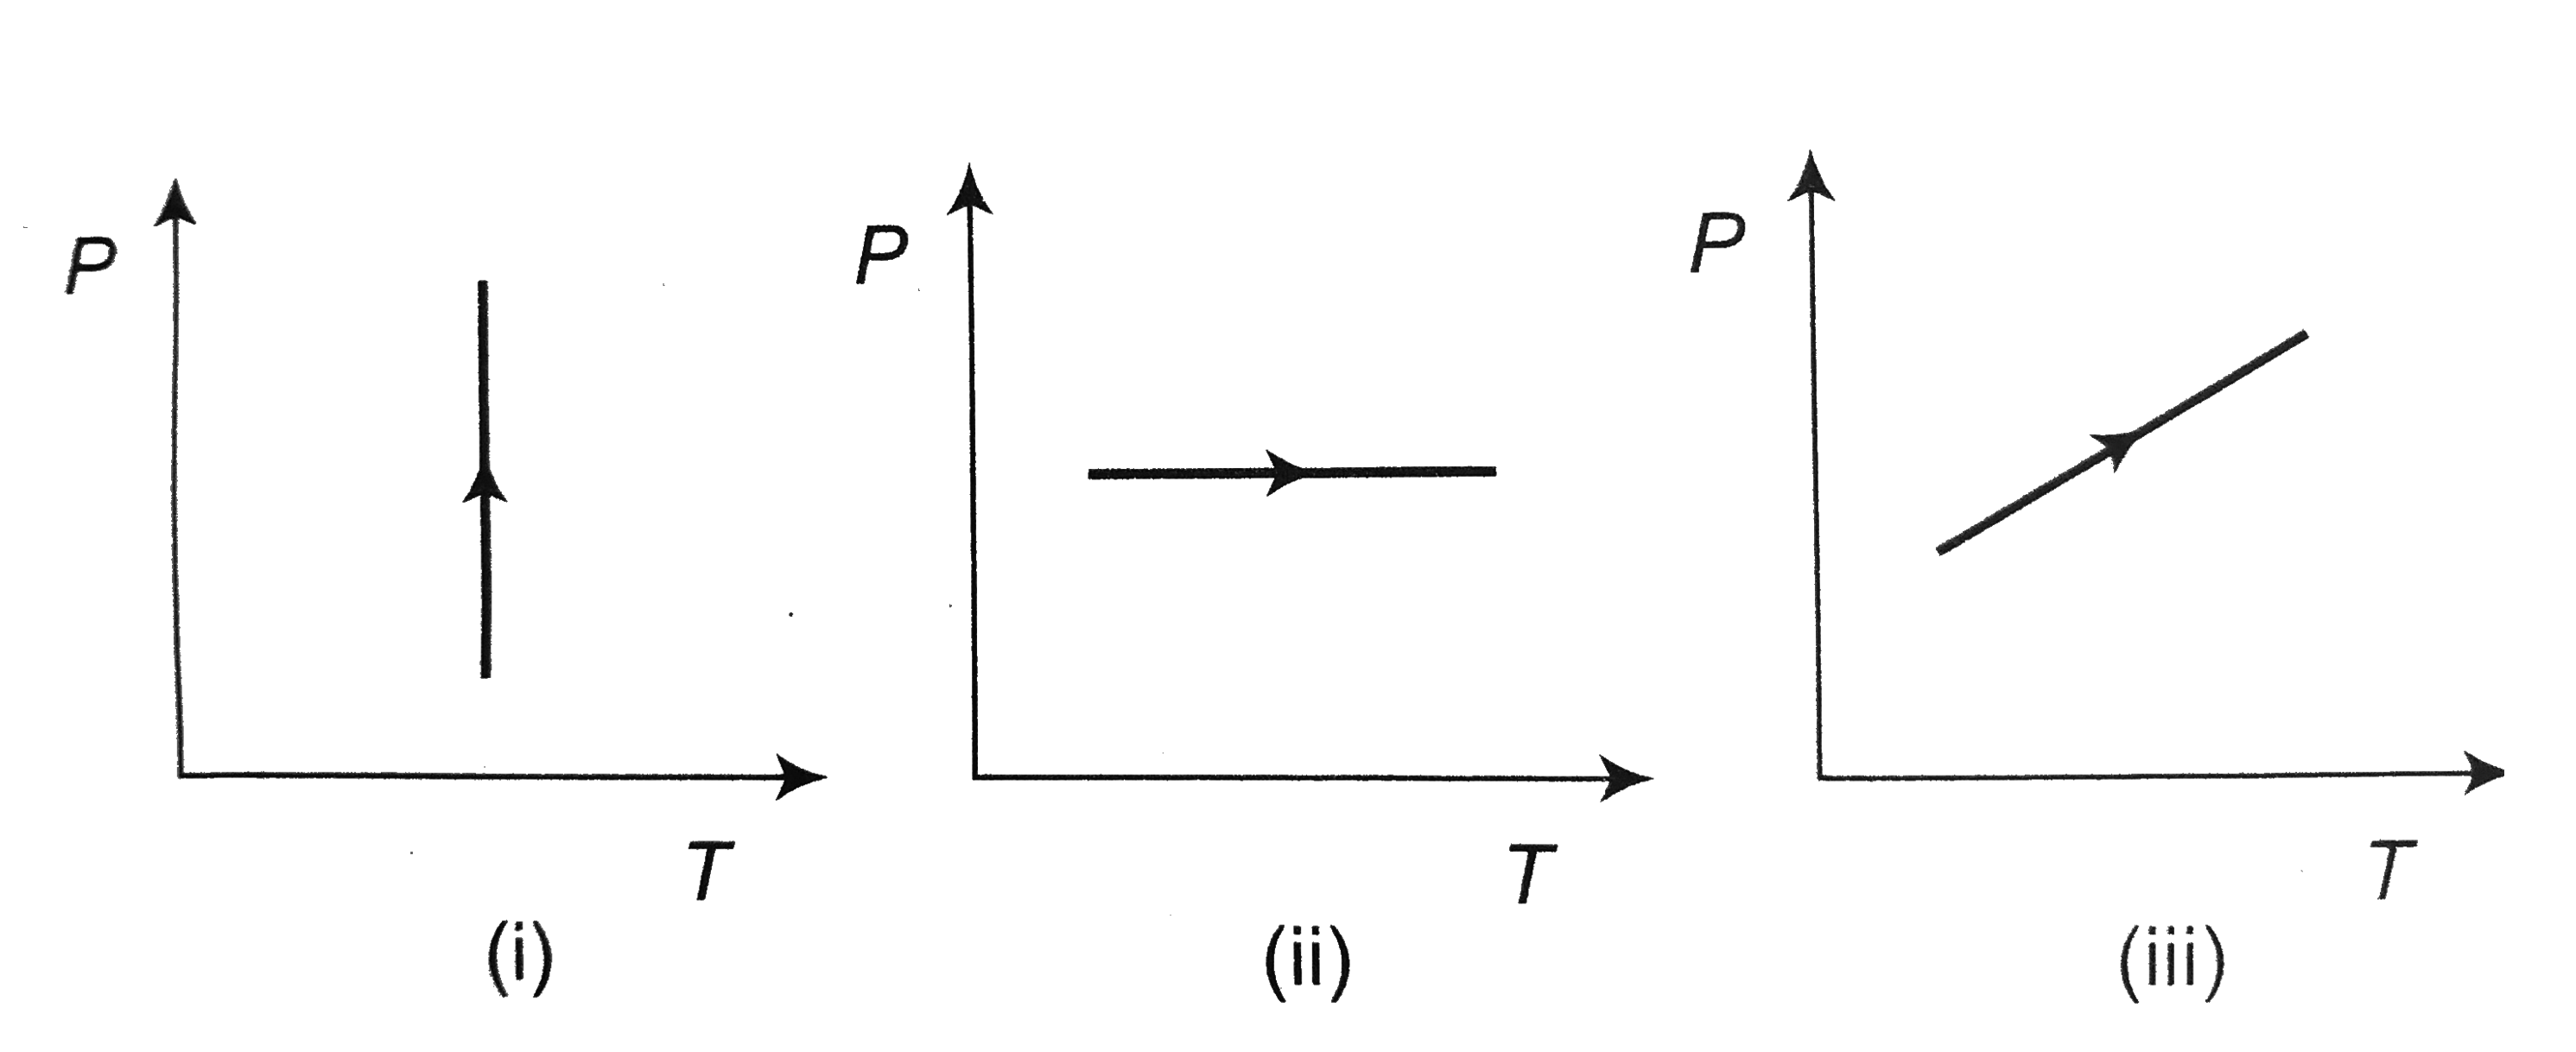 ADensity of gas is increased in graph (i)BDensity of gas is decrease in graph (ii)CDensity of gas is constant in graph (iii)DNone of these
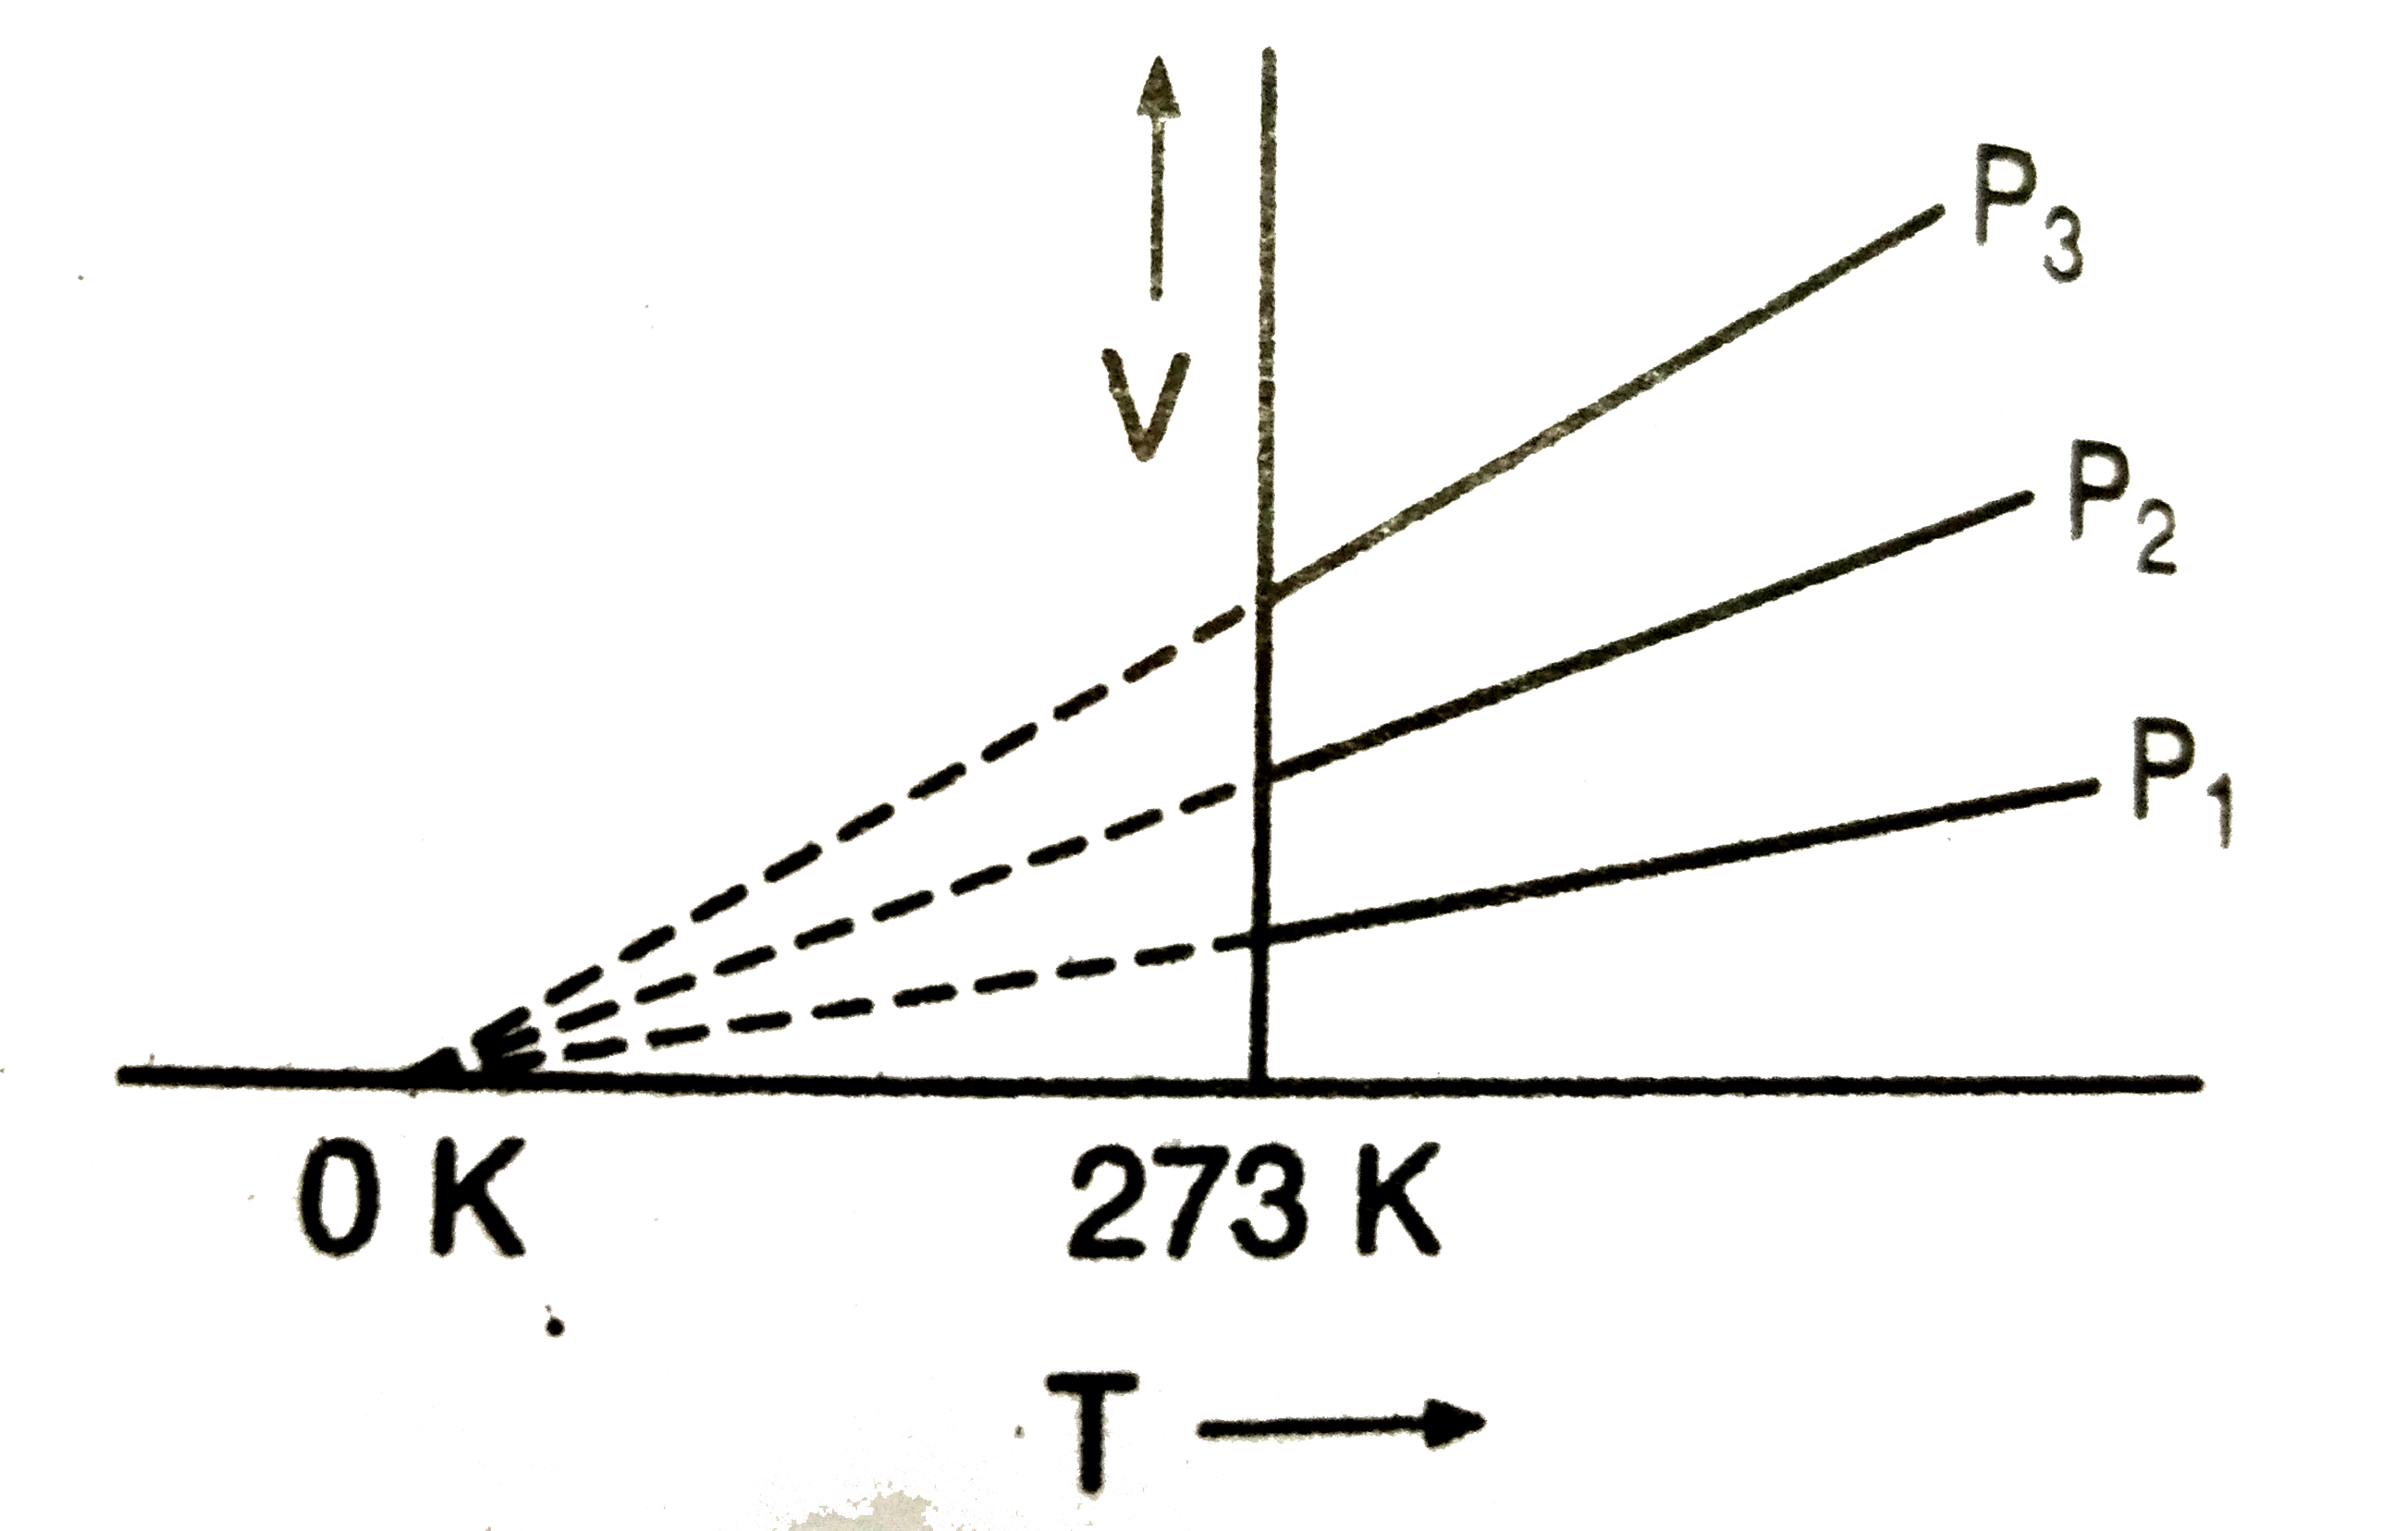
The volume-temperature graphs of a given mass of an ideal gas at constant pressure are shown below. What is the correct order of pressure ?
 View Solution
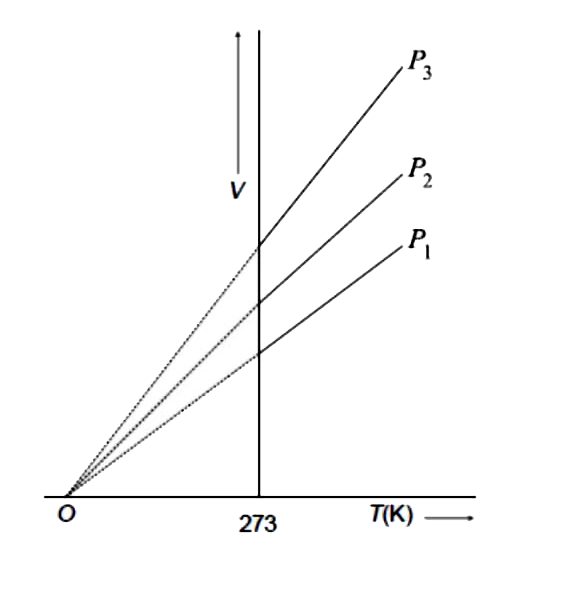
The volume-temperature graphs of a given mass of an ideal gas at constant pressures are shown below. What is the correct order of pressures ?
 View Solution
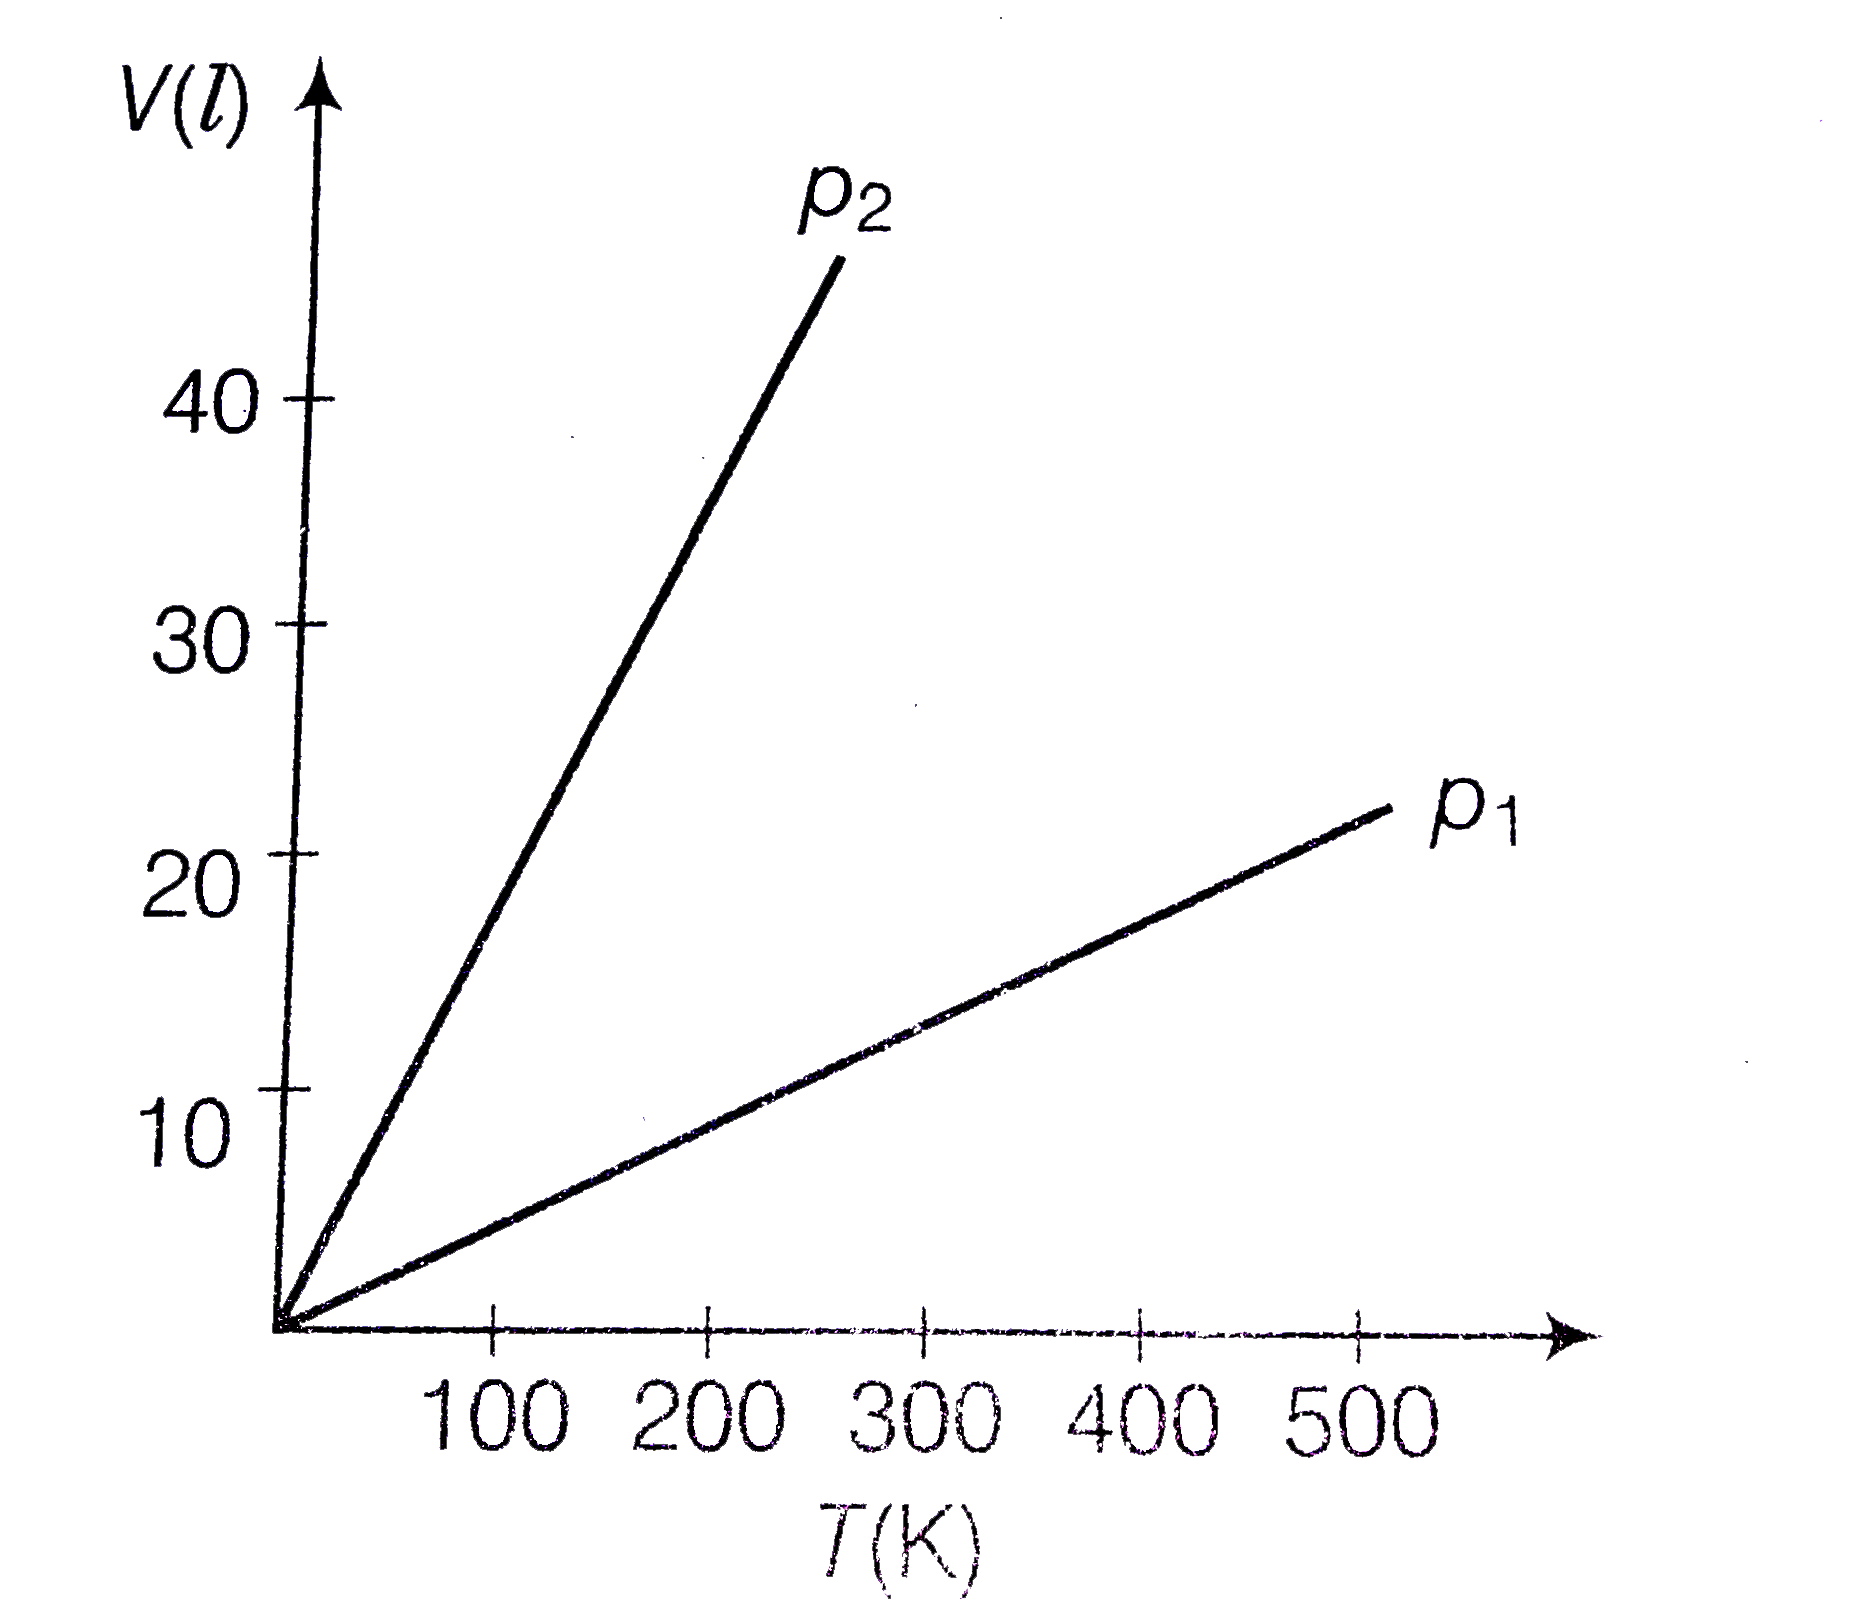
Figure shows the volume versus temperature graph for the same mass of a gas (assumed ideal) corresponding to two different pressure P1andP2. Then
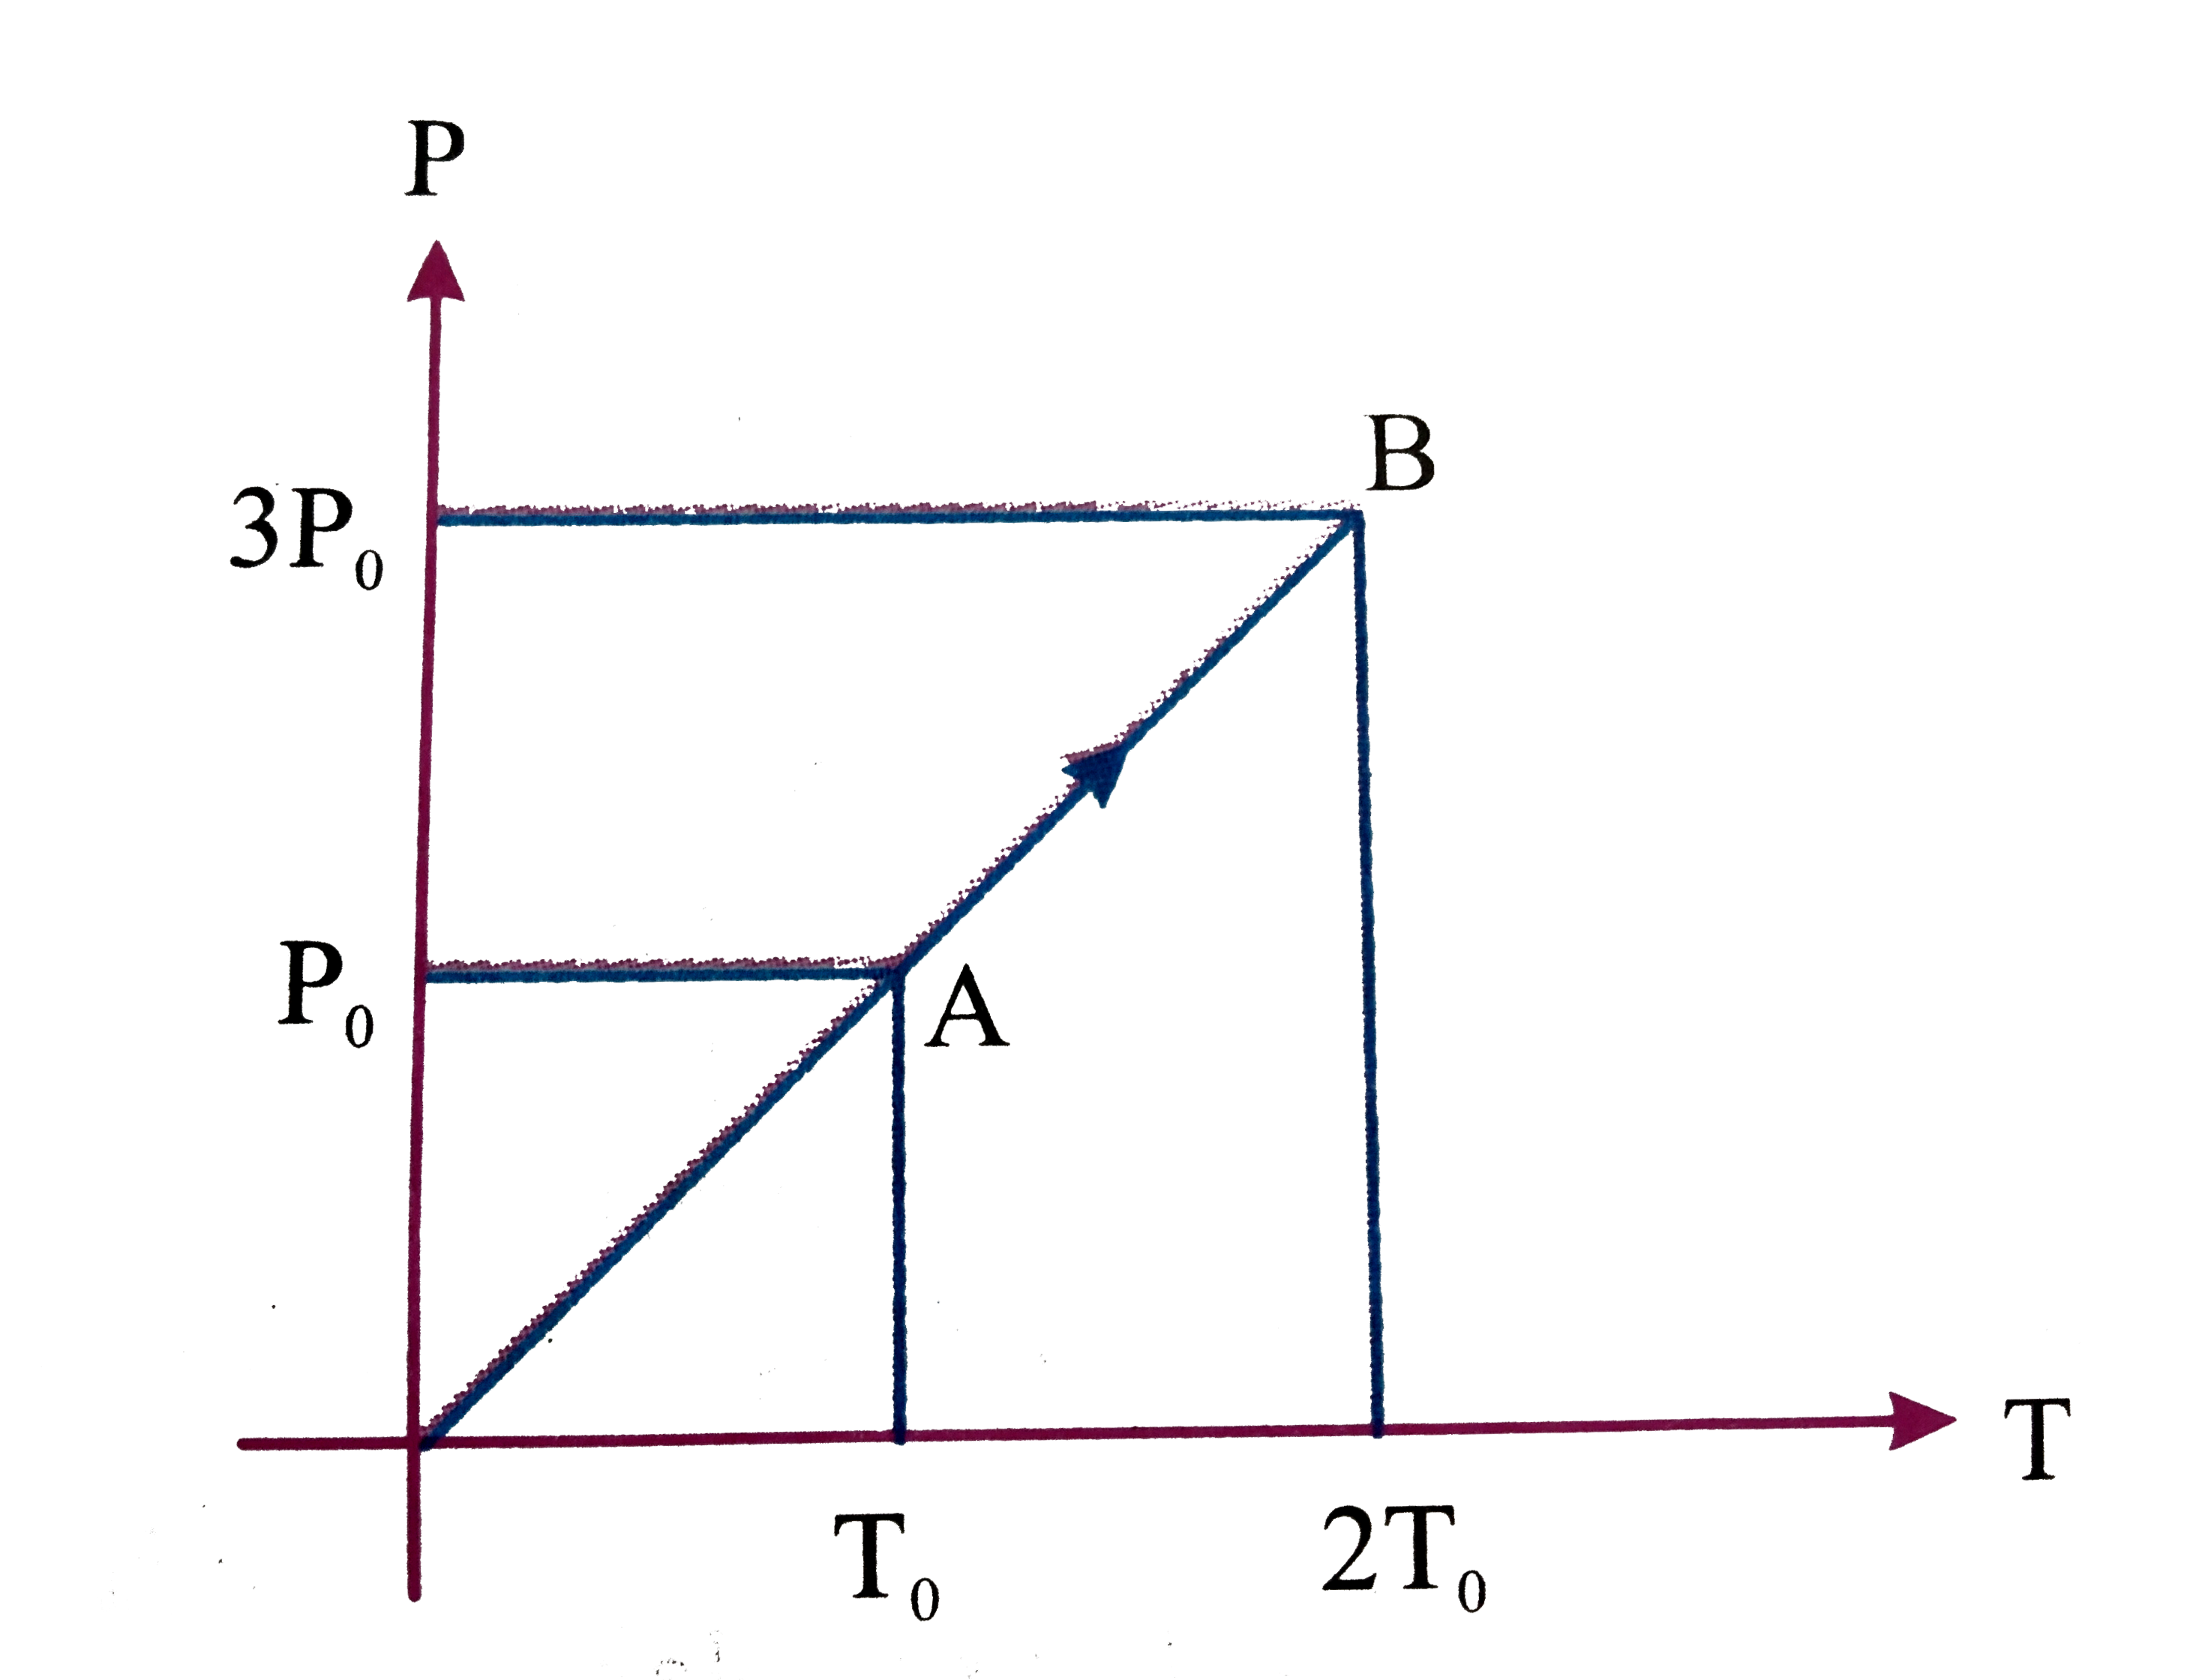
View SolutionPressure versus temperature graph of an ideal gas is shown in figure. Density of the gas at point A is P0. Density at B will be
 View Solution
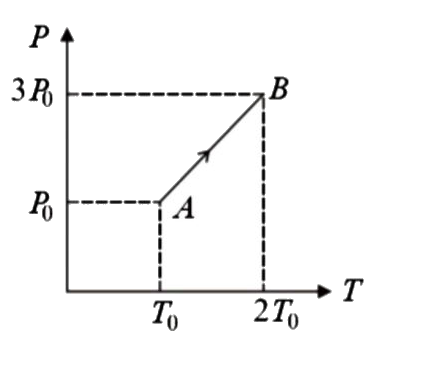
Pressure versus temperature graph of an ideal gas is as shown in figure. Density of the gas at point A is ρ0. Density at point B will be :-
 View Solution


