The following data gives the number of students of Delhi state who went abroad for study during some years: year: 1995 1996 1997 1998 1999 2000 No. of Students 1400 1600 1250 1000 2000 2200 Represent the above data with the help of a bar graph.
Topper's Solved these Questions
Similar Questions
The following data shows the number of students who attended the school on weekdays. Draw a bar graph to represent information by using appropriate scale.

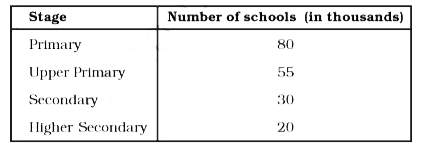
View SolutionThe following table gives the data of number of schools (stage-wise) of a country in the year 2002.

Draw a bar graph to represent the above data:
View Solution
Knowledge Check
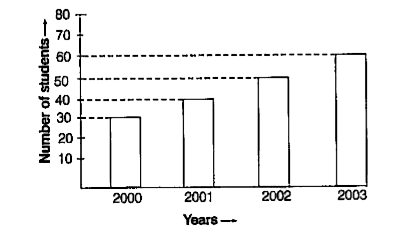
The following bar graph shows the number of students in a particular class of school. Then, answer the following questions.

Is the number of students in the year 2002 is twice that in the year 2000?AYesBNoCCannot sayDNone of these
The following data shows the number of students born in different months of a particular year of class VI. Make the bar graph based on the given information.

View SolutionThe following data gives the number (in thousands) of applicants registered with an Employment Exchange during, 1995-2000: year, 1995, 1996, 1997, 1998, 1999, 2000 No. of application (Registered (in Thousand), 18, 20, 24, 28, 30, 34 Construct a bar graph to represent the above data.
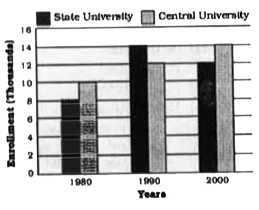
View SolutionStudy then following bar graph carefully and answer the questions.

Total enrollments in both State University and Central University during the year 1980,1990 and 2000 is
View SolutionThe following data gives the production of food grains (in thousand tonnes) for some years: Year 1995 1996 1997 1998 1999 2000 Production (in thousand tonnes) 120 150 140 180 170 190 Represent the above data with the help of a bar graph.
View SolutionThe following data gives the amount of manure (in thousand tonnes) manufactured by a company during some years: Year, 1992, 1993, 1994, 1995, 1996, 1997 Manure (In thousand tonnes), 15, 35, 45, 30, 40, 20 Represent the above data with the help of a bar graph. Indicate with the help of the bar graph the year in which the amount of manure manufactured by the company was maximum. Choose the correct alternative: The consecutive years during which there was maximum decrease in manure production are: 1994 to 1995 (b) 1992 and 1993 1996-1997 (d) 1995 and 1996
View SolutionThe following data gives the amount of loans (in crores of rupees) disbursed by a bank during some years: Year, 1992, 1993, 1994, 1995, 1996 Loan (in crores of rupees), 28, 33, 55, 55, 80 Represent the above data with the help of a bar graph. With the help of the bar graph, indicate the year in which amount of loan is not increased over that of the preceding year.
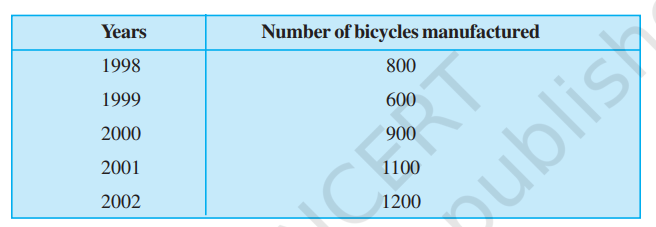
View SolutionFollowing table shows the number of bicycles manufactured in a factory during the years 1998 to 2002. Illustrate this data using a bar graph. Choose a scale of your choice

View Solution
