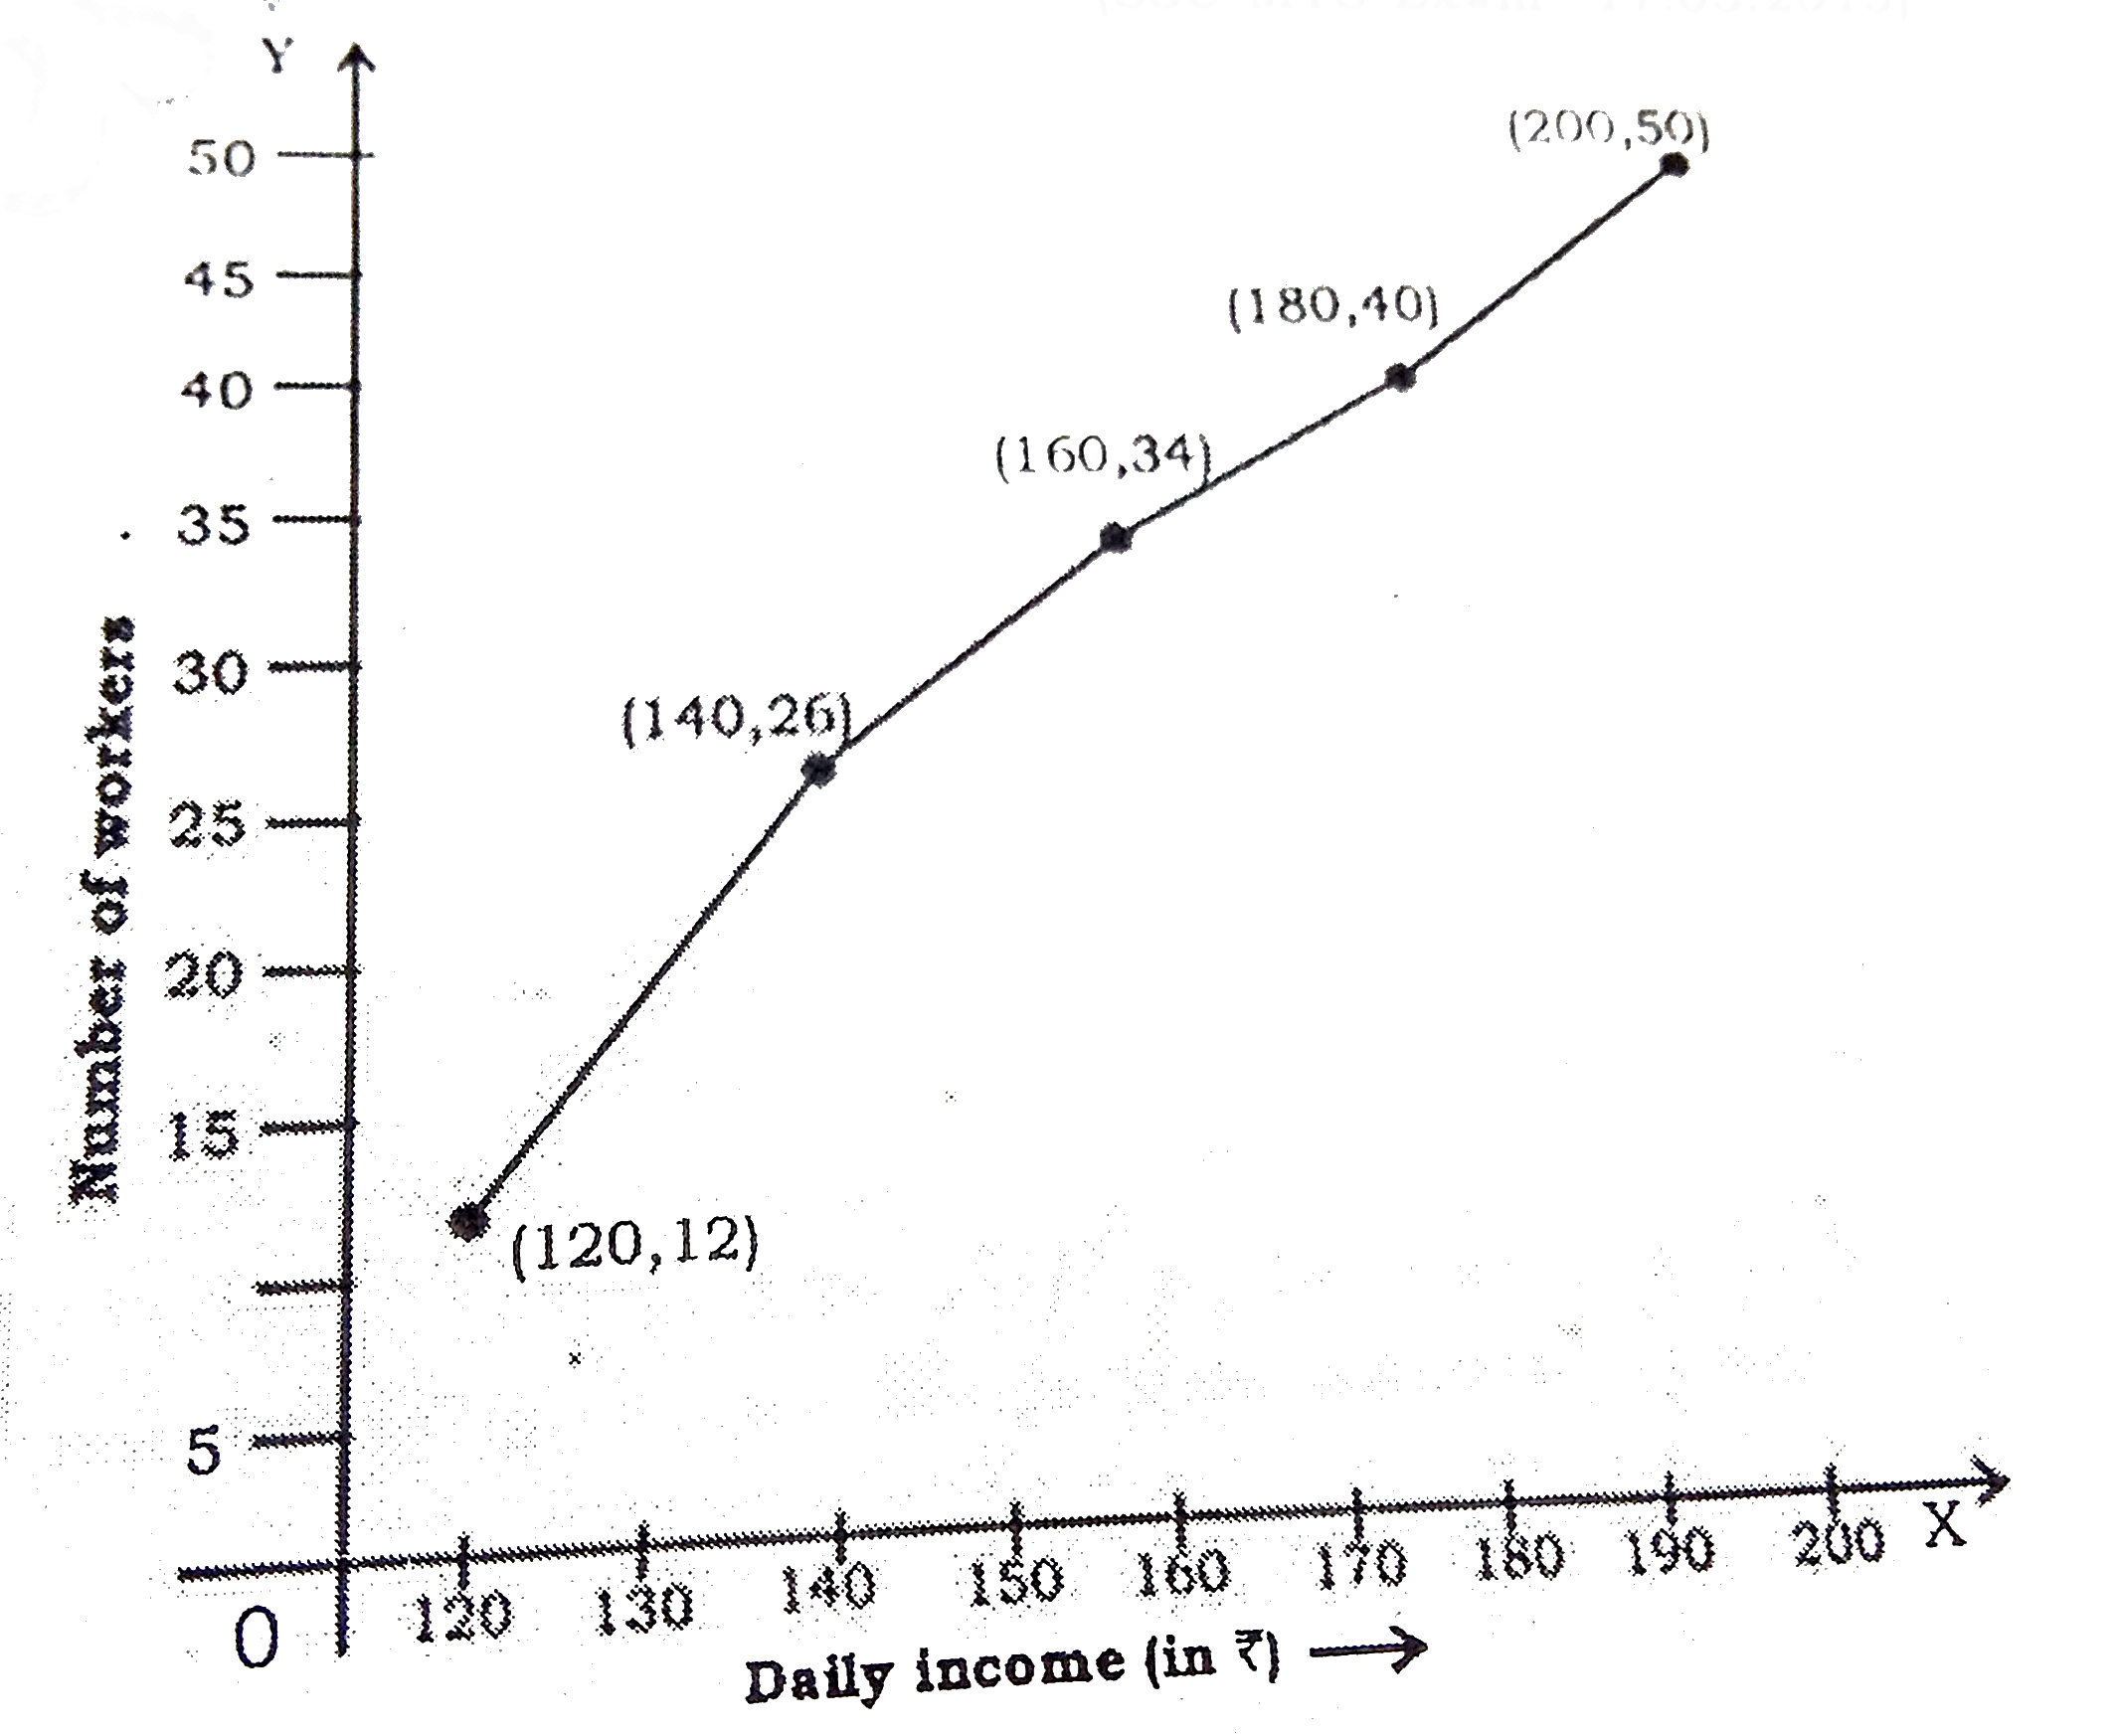
The graph given below shows the daily income of 50 workers in a factory Study the graph and answer the questions

कितने कर्मचारी रू 150 तथा रू 180 के बीच कमाते है ।
Wages Numbers of workers
120 12
140 26-12 =14
160 34-26=8
180 40-34= 6
200 50-40=10
rquired percentage
Topper's Solved these Questions
Similar Questions
सरल करें: 1+11+22+31+45
View SolutionA एक काम को 6 दिनों में तथा B उसी काम को 9 दिनों में कर सकता है दोनों मिलकर उस काम को कितने दिन में पूरा करेंगे ?
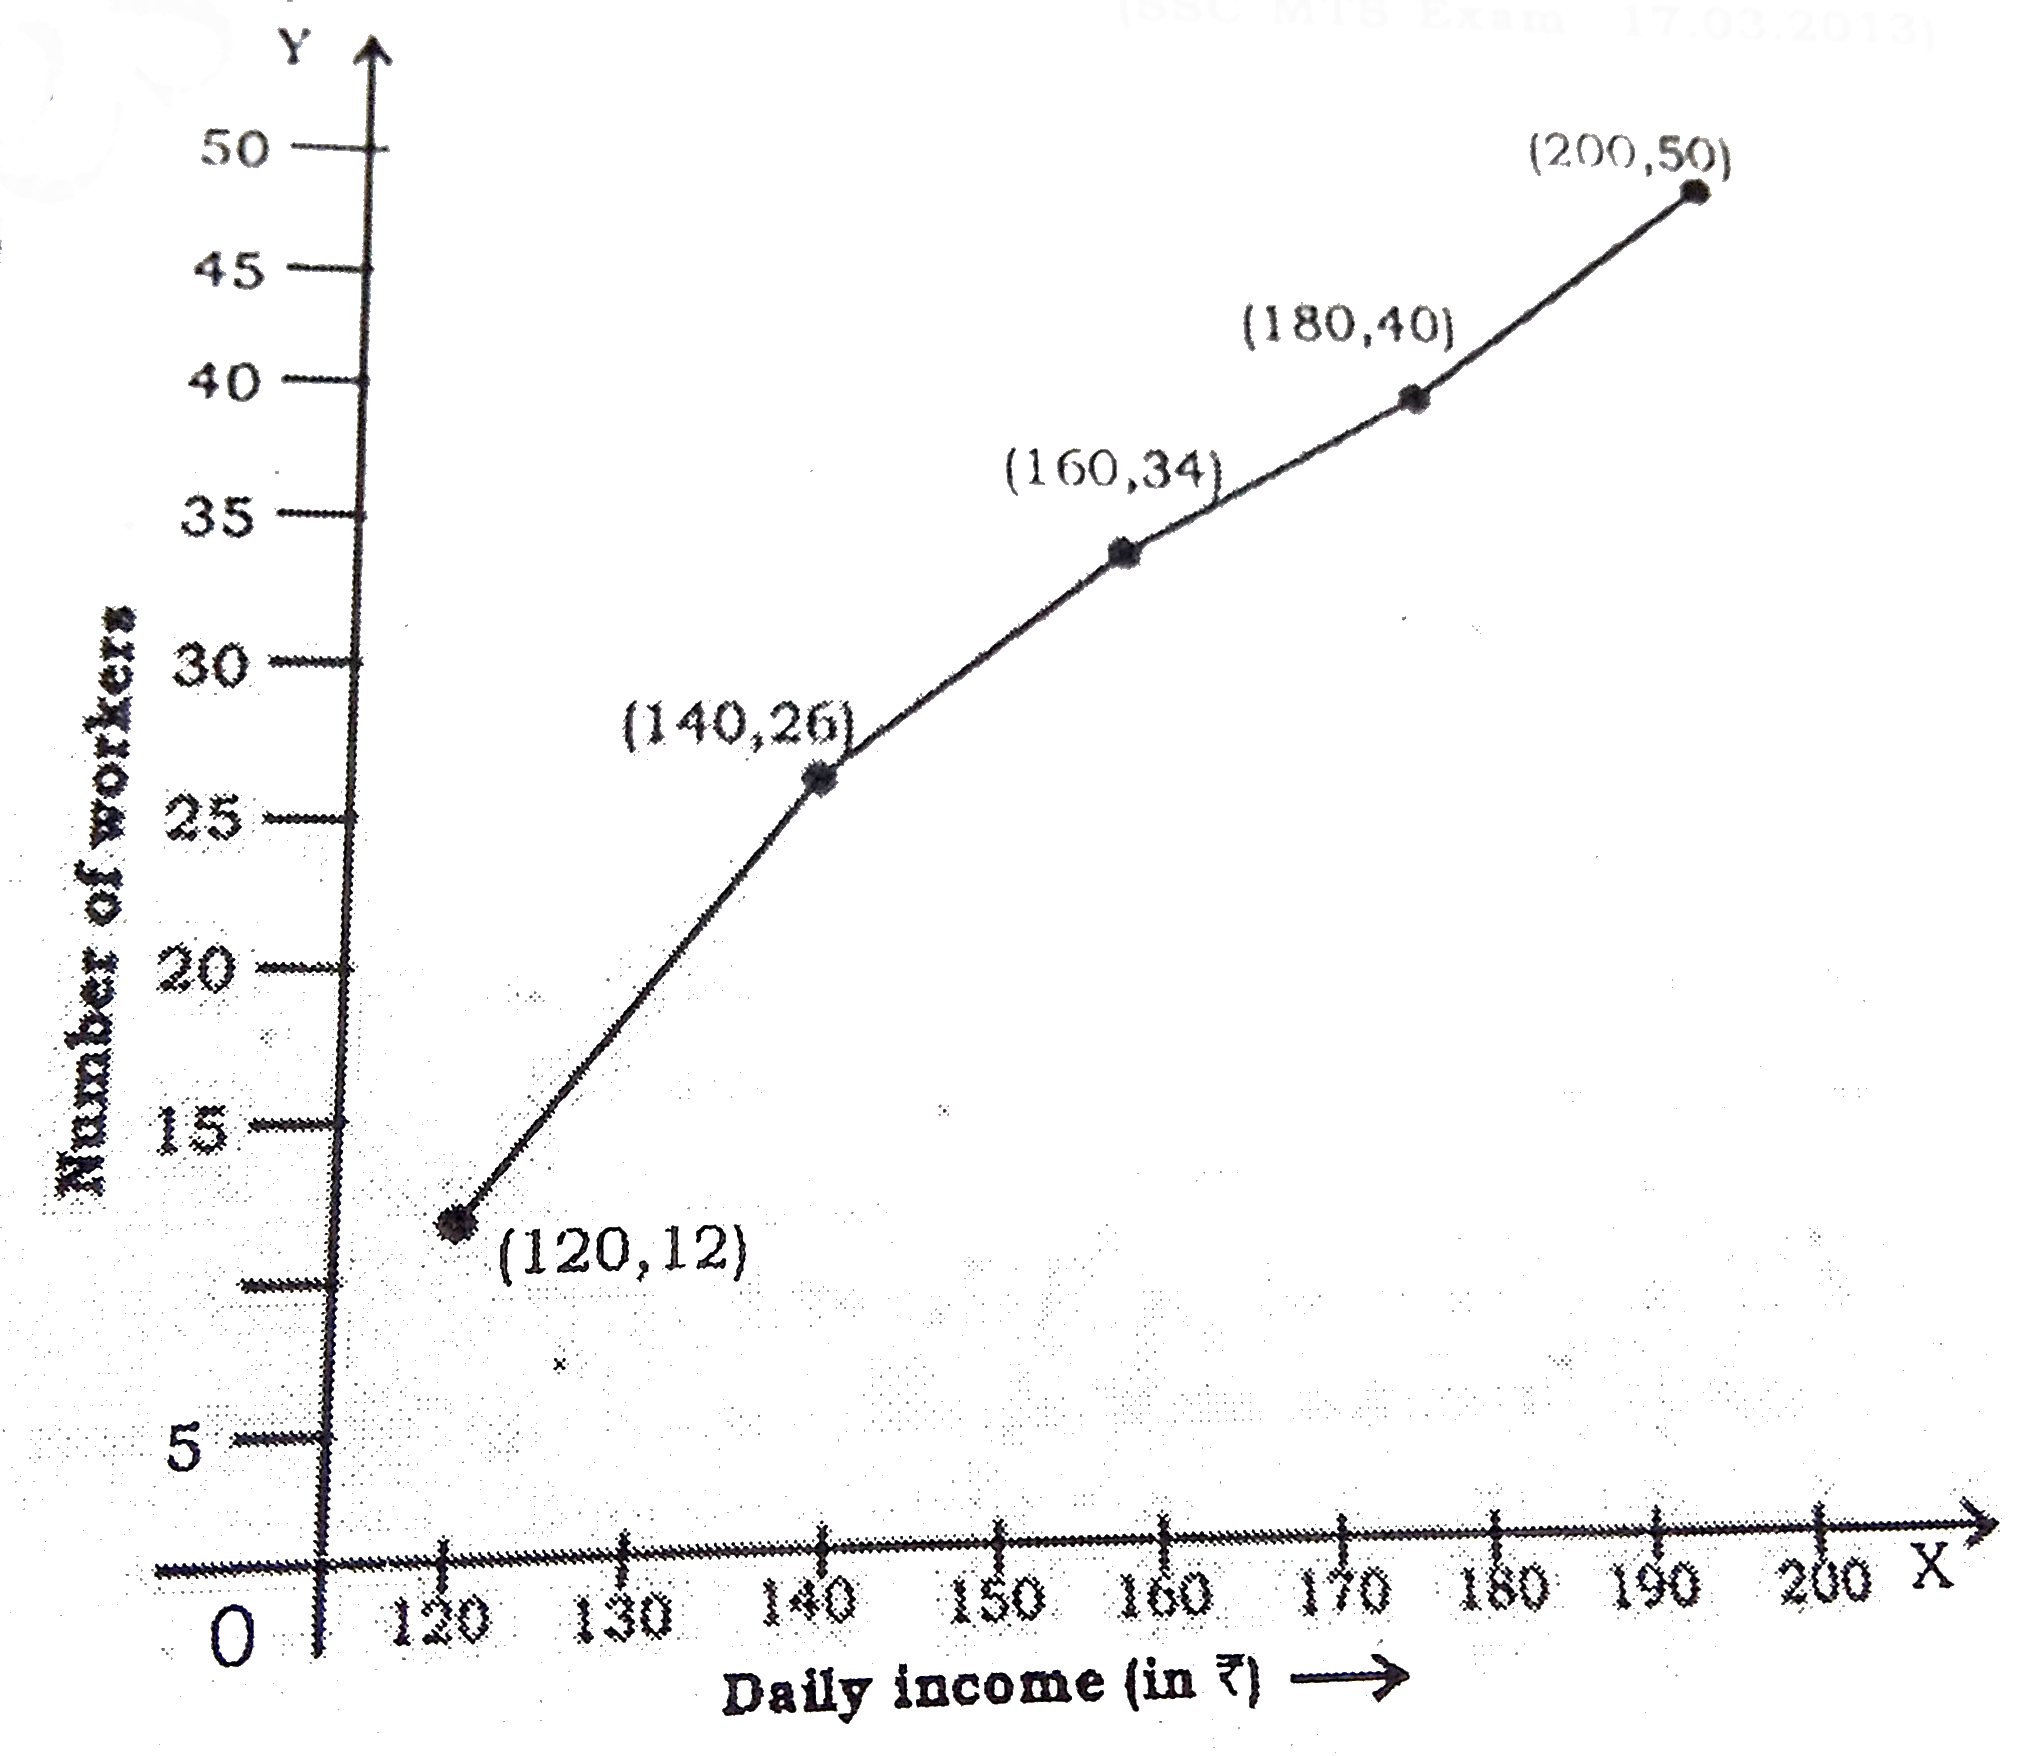
View SolutionThe graph given below shows the daily income of 50 workers in a factory Study the graph and answer the questions

कारखाने में मजदूरी का औसत माध्य कितना है ।
View SolutionDetermine the point of symmetry of a regular hexagon.
View SolutionDtermine the images of the following figure about the given line :
View SolutionMatch the following Column A to Column B

View SolutionMatch the following Column A to Column B

View SolutionMatch the following Column A to Column B

View SolutionFind the area of figure given below.

View SolutionFind the perimeter of the figure given below.

View SolutionFind the area of the figure given below.

View SolutionThe area of the shaded part in the figure given below is ______.

View SolutionThe inequation represented by the graph given below is :
View SolutionThe inequation that best describes the graph given below is _________
View SolutionThe inequation that best describes the following graph is _________
View Solution
