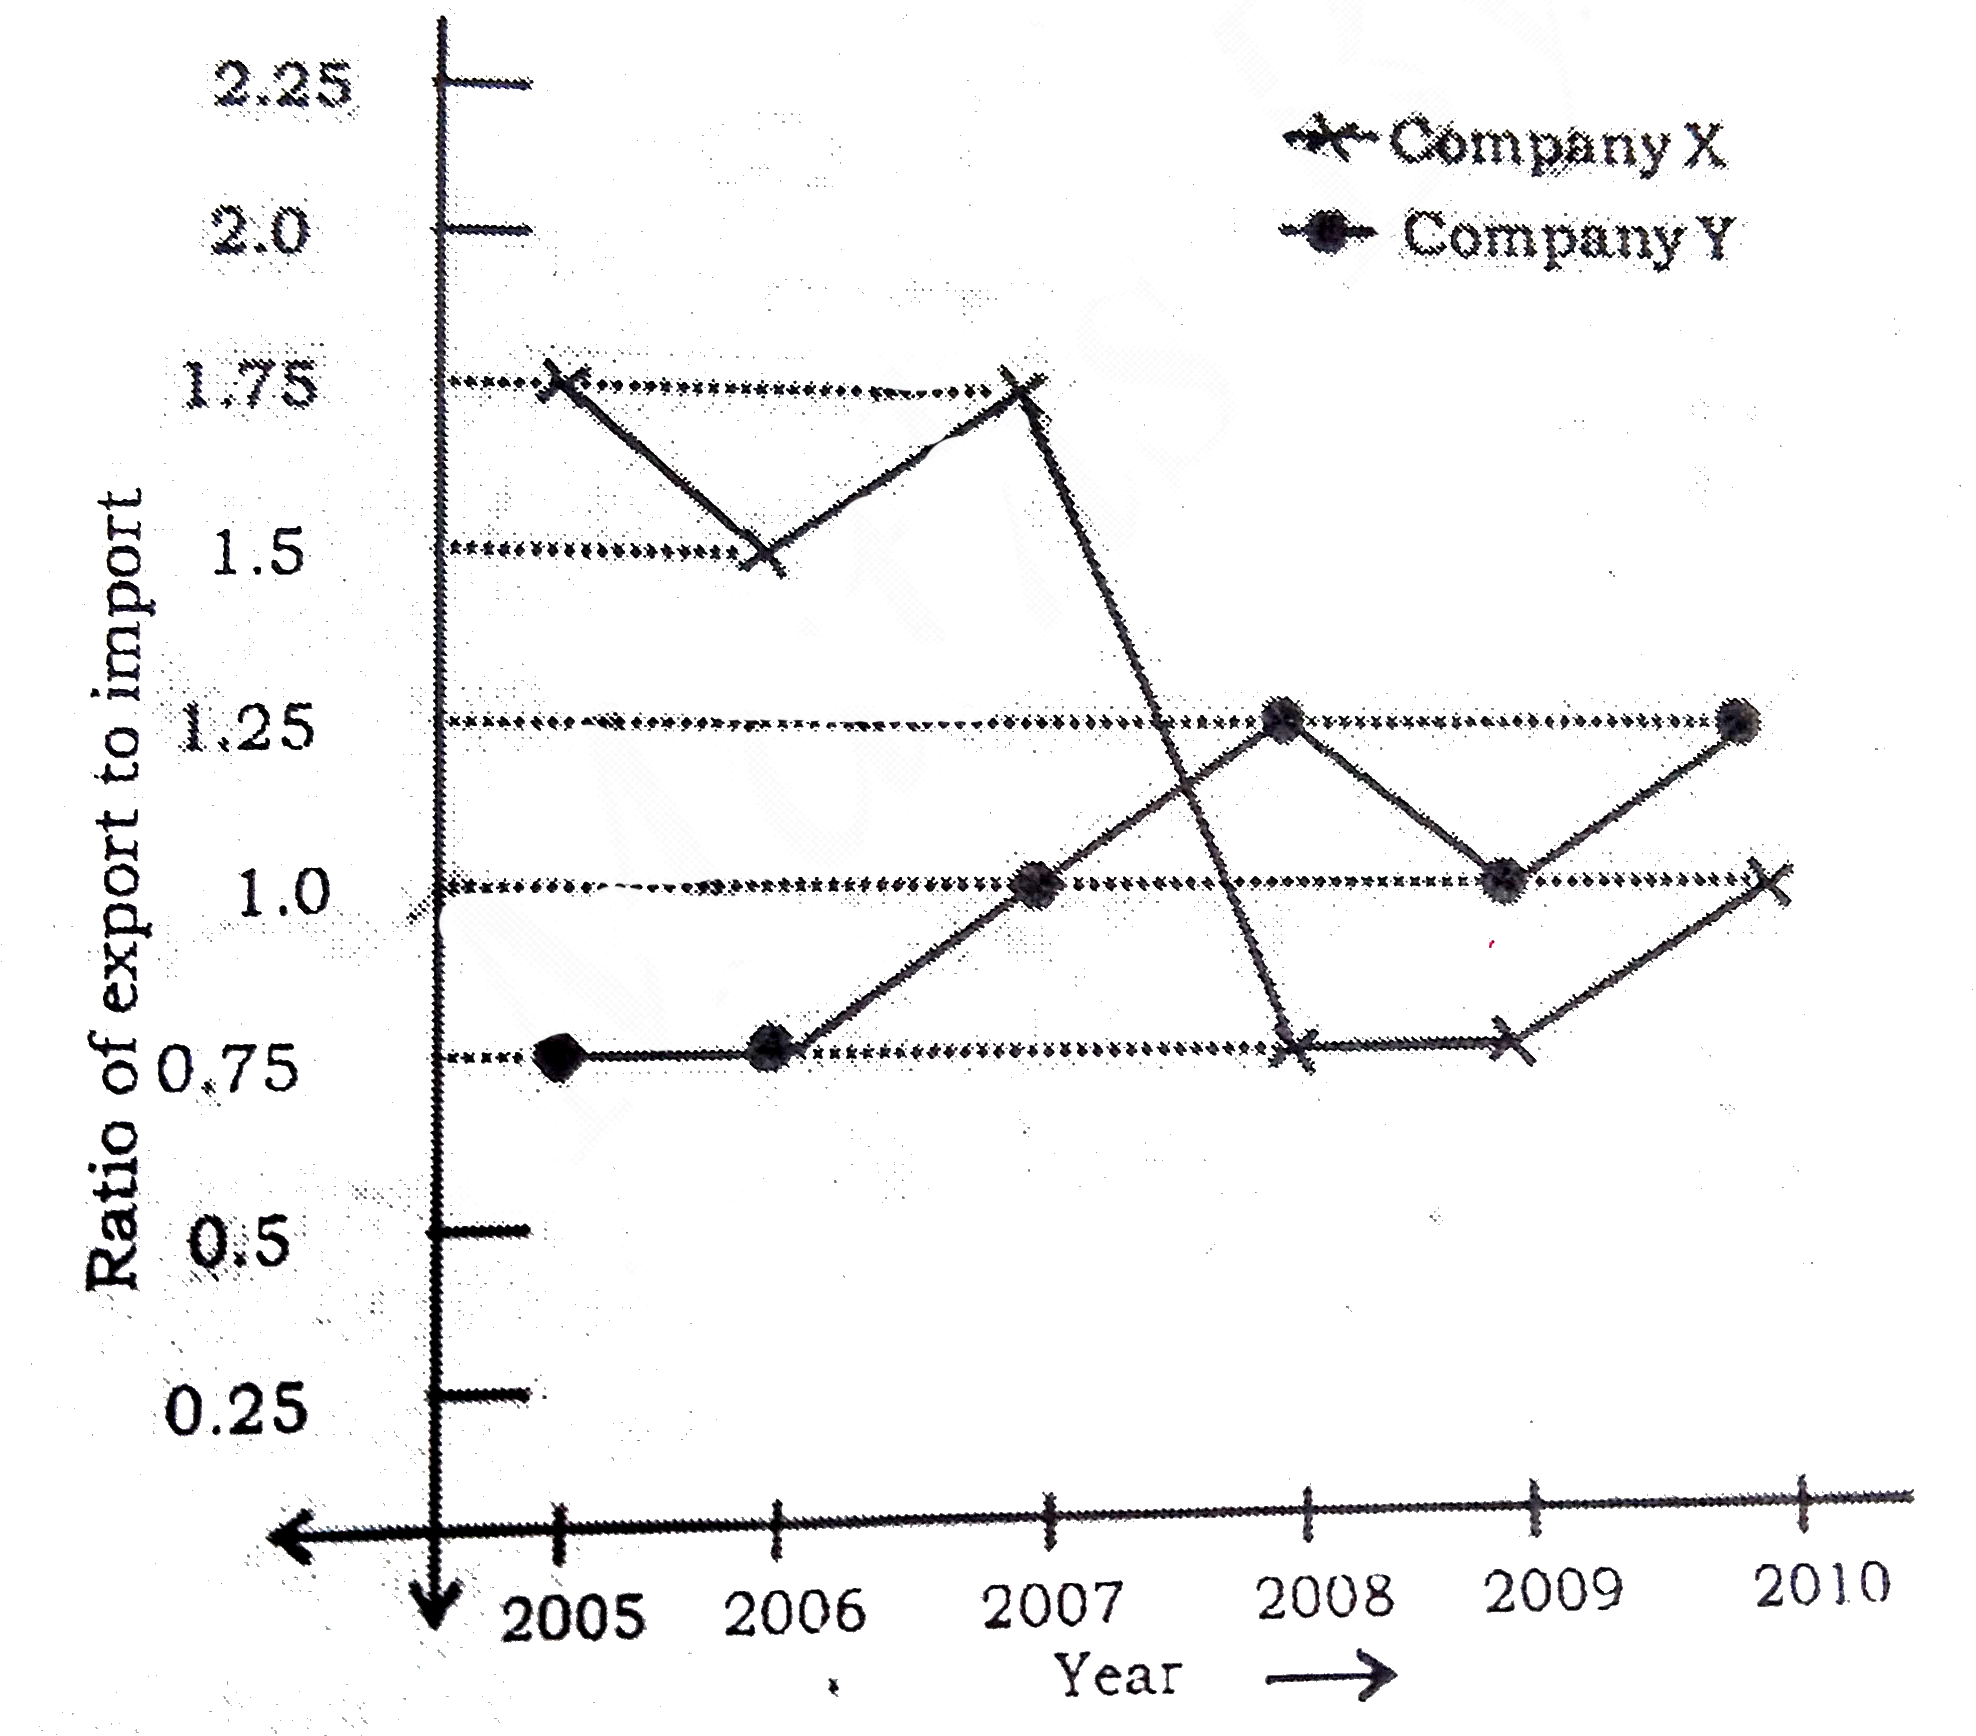
Study the following graph and answer the questions

वर्ष 2005 में कंपनी X का निर्यात कंपनी Y से दुगुना है यदि इस वर्ष में कंपनी 'X' का आयात रू 180 करोड़ था तो बताये इस वर्ष कंपनी Y का आयात कितना था ।(रू करोड़ )
212
210
315
282
In the year 2005
Imports of company y=Rs.157.5 crore
∴ Imorts of compnay y=157.50.75=210 crores
Topper's Solved these Questions
Similar Questions
सरल करें: 1+11+22+31+45
View SolutionA एक काम को 6 दिनों में तथा B उसी काम को 9 दिनों में कर सकता है दोनों मिलकर उस काम को कितने दिन में पूरा करेंगे ?
View SolutionDetermine the point of symmetry of a regular hexagon.
View SolutionMatch the following Column A to Column B

View SolutionMatch the following Column A to Column B

View SolutionMatch the following Column A to Column B

View SolutionThe inequation represented by the graph given below is :
View SolutionThe inequation that best describes the graph given below is _________
View SolutionThe inequation that best describes the following graph is _________
View SolutionIf y-x=180^(@) then find the values of x and y. ltimg src="https://d10lpgp6xz60nq.cloudfront.net/physics_images/ALN_PHY_R05_E01_034_Q01.png" width="80%"gt
View SolutionCBSE|पूर्व में ईस्ट इंडिया कंपनी का आना
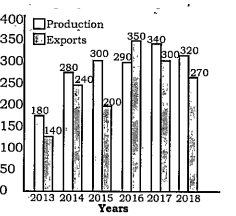
View SolutionStudy the given graph and answer the question that follows.
Production and Exports of Computers (In Thousands) by company XYZ in six years. In which year was the production of computers by the company 16 % more than the average exports of computers in the six year(2013 to 2018)?
दिए गए ग्राफ का अध्ययन करें और इस प्रश्न का उत्तर दें। कंपनी XYZ द्वारा छह वर्षों में कंप्यूटर का उत्पादन और निर्यात कंपनी द्वारा कंप्यूटरों का छह साल (2013 से 2018) में औसत निर्यात से 16% अधिक?
View SolutionThe following line diagram represents the yearly sales figure of a company in the years 2001-2010. Examine the diagram and answer the question. निम्नलिखित रेखा आरेख किसी कंपनी की वर्ष 2007-2010 के दौरान वार्षिक बिक्री के आंकड़ों को दर्शाता है। आरेख का अध्ययन करें और नीचे दिए गए प्रश्नों के उत्तर दें- The ratio of sales in 2002 to that in 2007 is वर्ष 2002 में बिक्री का वर्ष 2007 में बिक्री के साथ अनुपात है-
View SolutionThe following line diagram represents the yearly sales figure of a company in the years 2001-2010. Examine the diagram and answer the question. निम्नलिखित रेखा आरेख किसी कंपनी की वर्ष 2007-2010 के दौरान वार्षिक बिक्री के आंकड़ों को दर्शाता है। आरेख का अध्ययन करें और नीचे दिए गए प्रश्नों के उत्तर दें- ............................................................................................................................................. Total sales (in crore of Rs.) from 2005 to 2008 is वर्ष 2005 से वर्ष 2008 तक कुल बिक्री (रु. करोड में) है-
View Solutionधूमिल का जन्म किस वर्ष हुआ था ?
View SolutionThe following table shows the items of expenditure of a company (in ₹ lakh per annum), from 2015 to 2019.
निम्नलिखित तालिका 2015-2019 तक एक कंपनी के व्यय की मदों को ( लाख रुपये प्रति वर्ष में ) दर्शाती है | What is the average amount of interest per year which the company had to pay during this
period?
इस अवधि के दौरान प्रति वर्ष कंपनी को ब्याज की कितनी औसत राशि का भुगतान करना पड़ा है ?
View Solution
