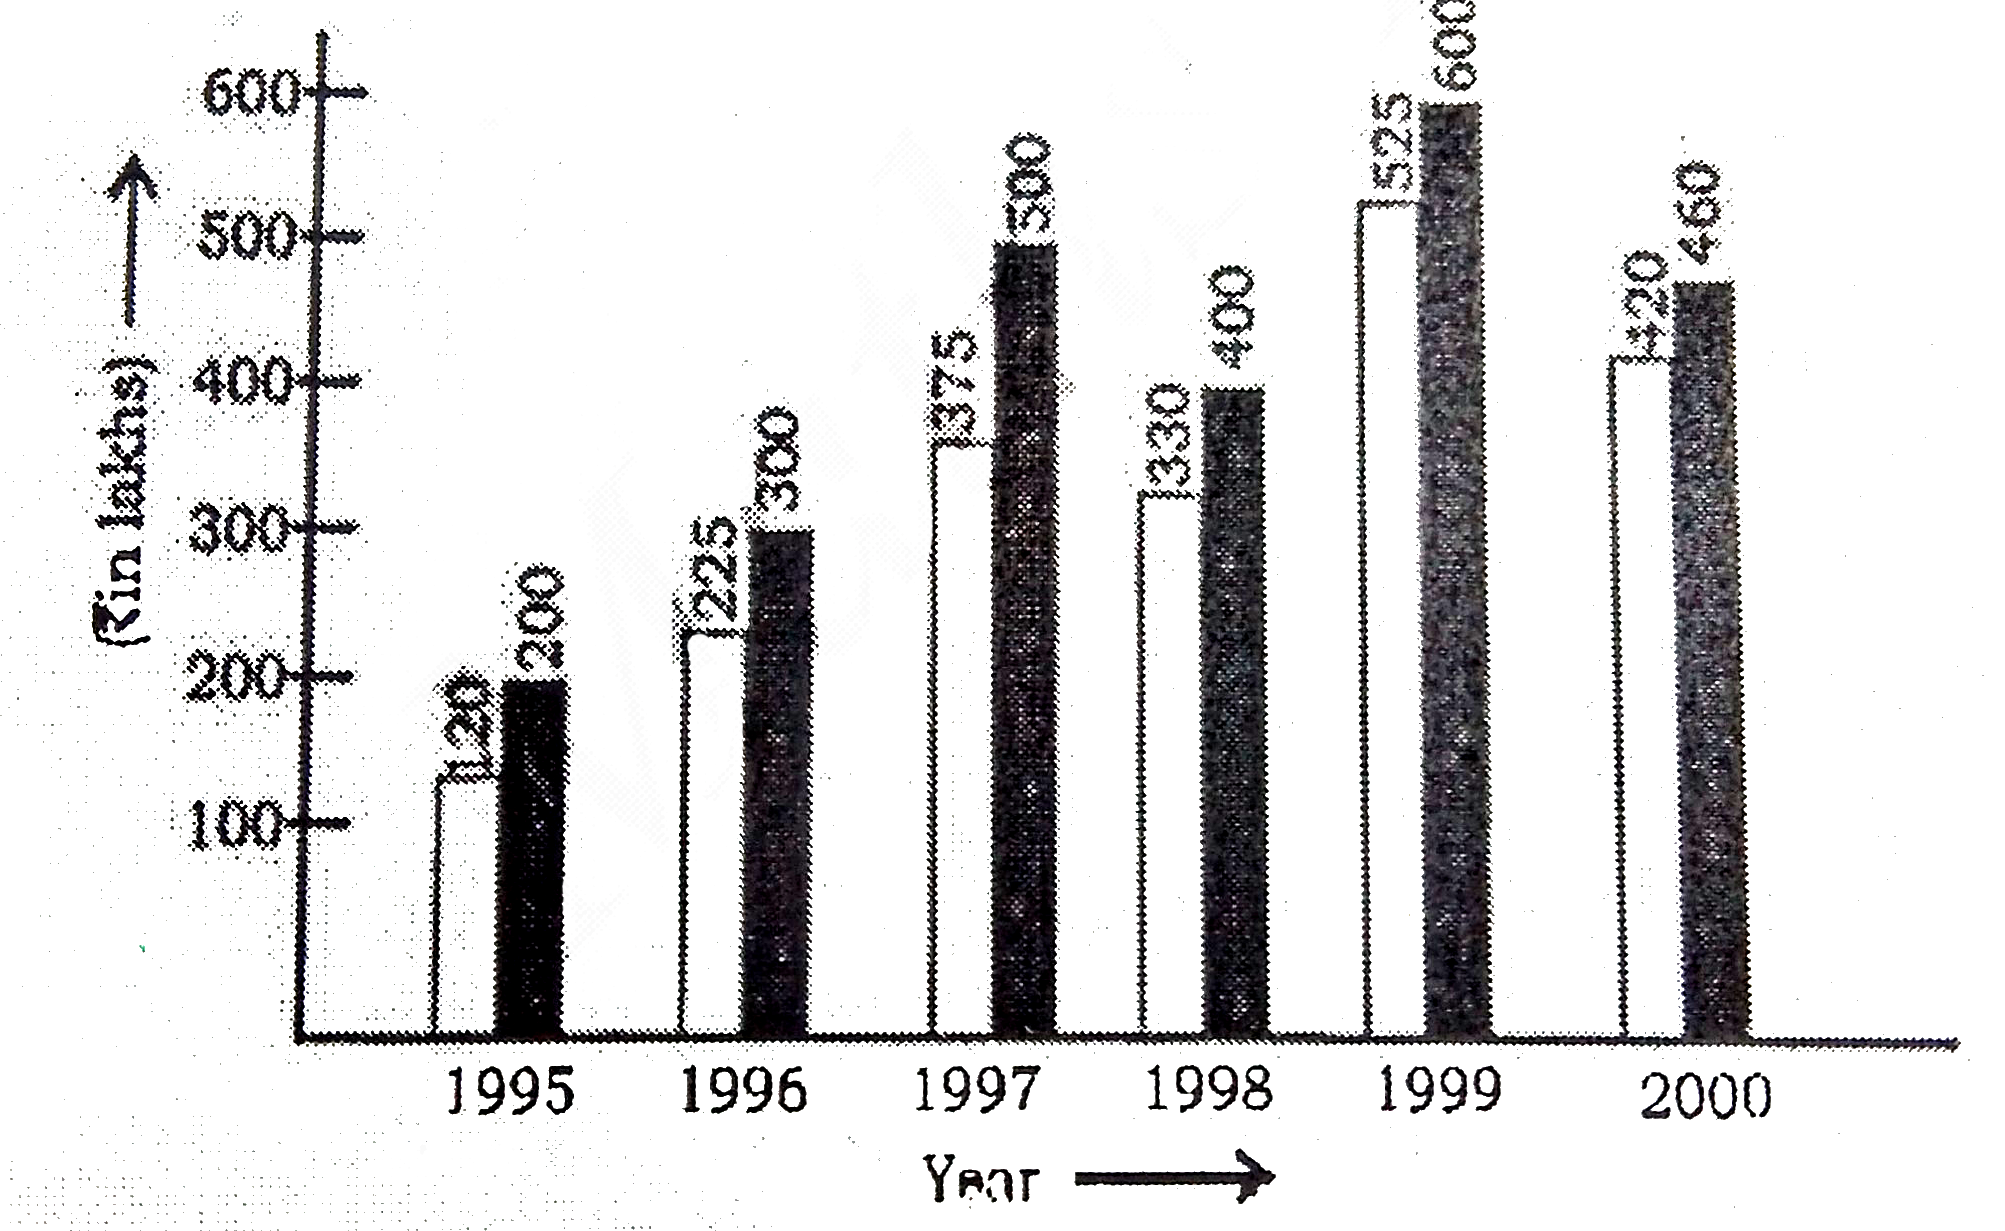
Study the following graph and answer the given questions

निम्न में से किस वर्ष में पिछले वर्ष की तुलना में कच्चे माल पर किये गए निवेश में अधिकतम वृद्धि हुई ।
1996
1997
1998
1999
Percentage increase in year 1996
=225−120120×100=87.5%
percentage increase in year 1997
=(375−225)225×100=67%
Topper's Solved these Questions
Similar Questions
सरल करें: 1+11+22+31+45
View SolutionA एक काम को 6 दिनों में तथा B उसी काम को 9 दिनों में कर सकता है दोनों मिलकर उस काम को कितने दिन में पूरा करेंगे ?
View SolutionWhich of the following are correct chain isomers of butane ? (i)
View SolutionDetermine the point of symmetry of a regular hexagon.
View SolutionDtermine the images of the following figure about the given line :
View SolutionMatch the following Column A to Column B

View SolutionMatch the following Column A to Column B

View SolutionMatch the following Column A to Column B

View SolutionThe inequation represented by the graph given below is :
View SolutionThe inequation that best describes the graph given below is _________
View SolutionThe inequation that best describes the following graph is _________
View SolutionWhich inequations represent the shaded region in the given figure
View SolutionThe given Bar Graph presents the number of students of two schools for six years. दिया गया दंड आरेख छः वर्ष की अवधि में दो विद्यालयों में छात्रों की संख्या को दर्शाता है | In which year, the percentage increase in students in school B is the highest in comparison to its previous year? किस वर्ष में, विद्यालय B में छात्रों की संख्या में प्रतिशत वृद्धि इसके पिछले वर्ष की तुलना में सबसे अधिक रही है?
View SolutionThe given Bar Graph presents the number of students of two schools for six years. दिया गया दंड आरेख छः वर्ष की अवधि में दो विद्यालयों में छात्रों की संख्या को दर्शाता है | In which year, the percentage increase of students in school A is the highest in comparison to its previous year? किस वर्ष, विद्यालय A में छात्रों की संख्या में प्रतिशत वृद्धि पिछले वर्ष की तुलना में सर्वाधिक है ?
View SolutionStudy the given chart carefully and answer the question accordingly:
दिए गए चार्ट का ध्यानपूर्वक अध्ययन करें और उसके अनुसार प्रश्न का उत्तर दें: In which of the following years was the percentage increase in production from the previous year, the maximum among the given years?
पिछले वर्ष की तुलना में निम्नलिखित वर्षों में से किस वर्ष में उत्पादन में अधिकतम प्रतिशत वृद्धि हुई?
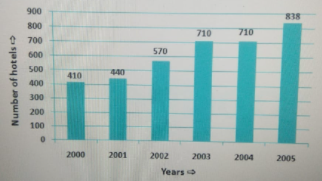
View SolutionStudy the chart and answer the questions:
In which of the given years is the percentage increase in the number of hotels in comparison to the previous year, is the maximum?
चार्ट का अध्ययन करें और प्रश्नों का उत्तर दें:पिछले वर्ष की तुलना में होटलों की संख्या में किस वर्ष में अधिकतम प्रतिशत वृद्धि हुई है?
View Solution
