Pie charts show the expenses on various heads show the expenses on various heads in construction of a house Study the pie chart
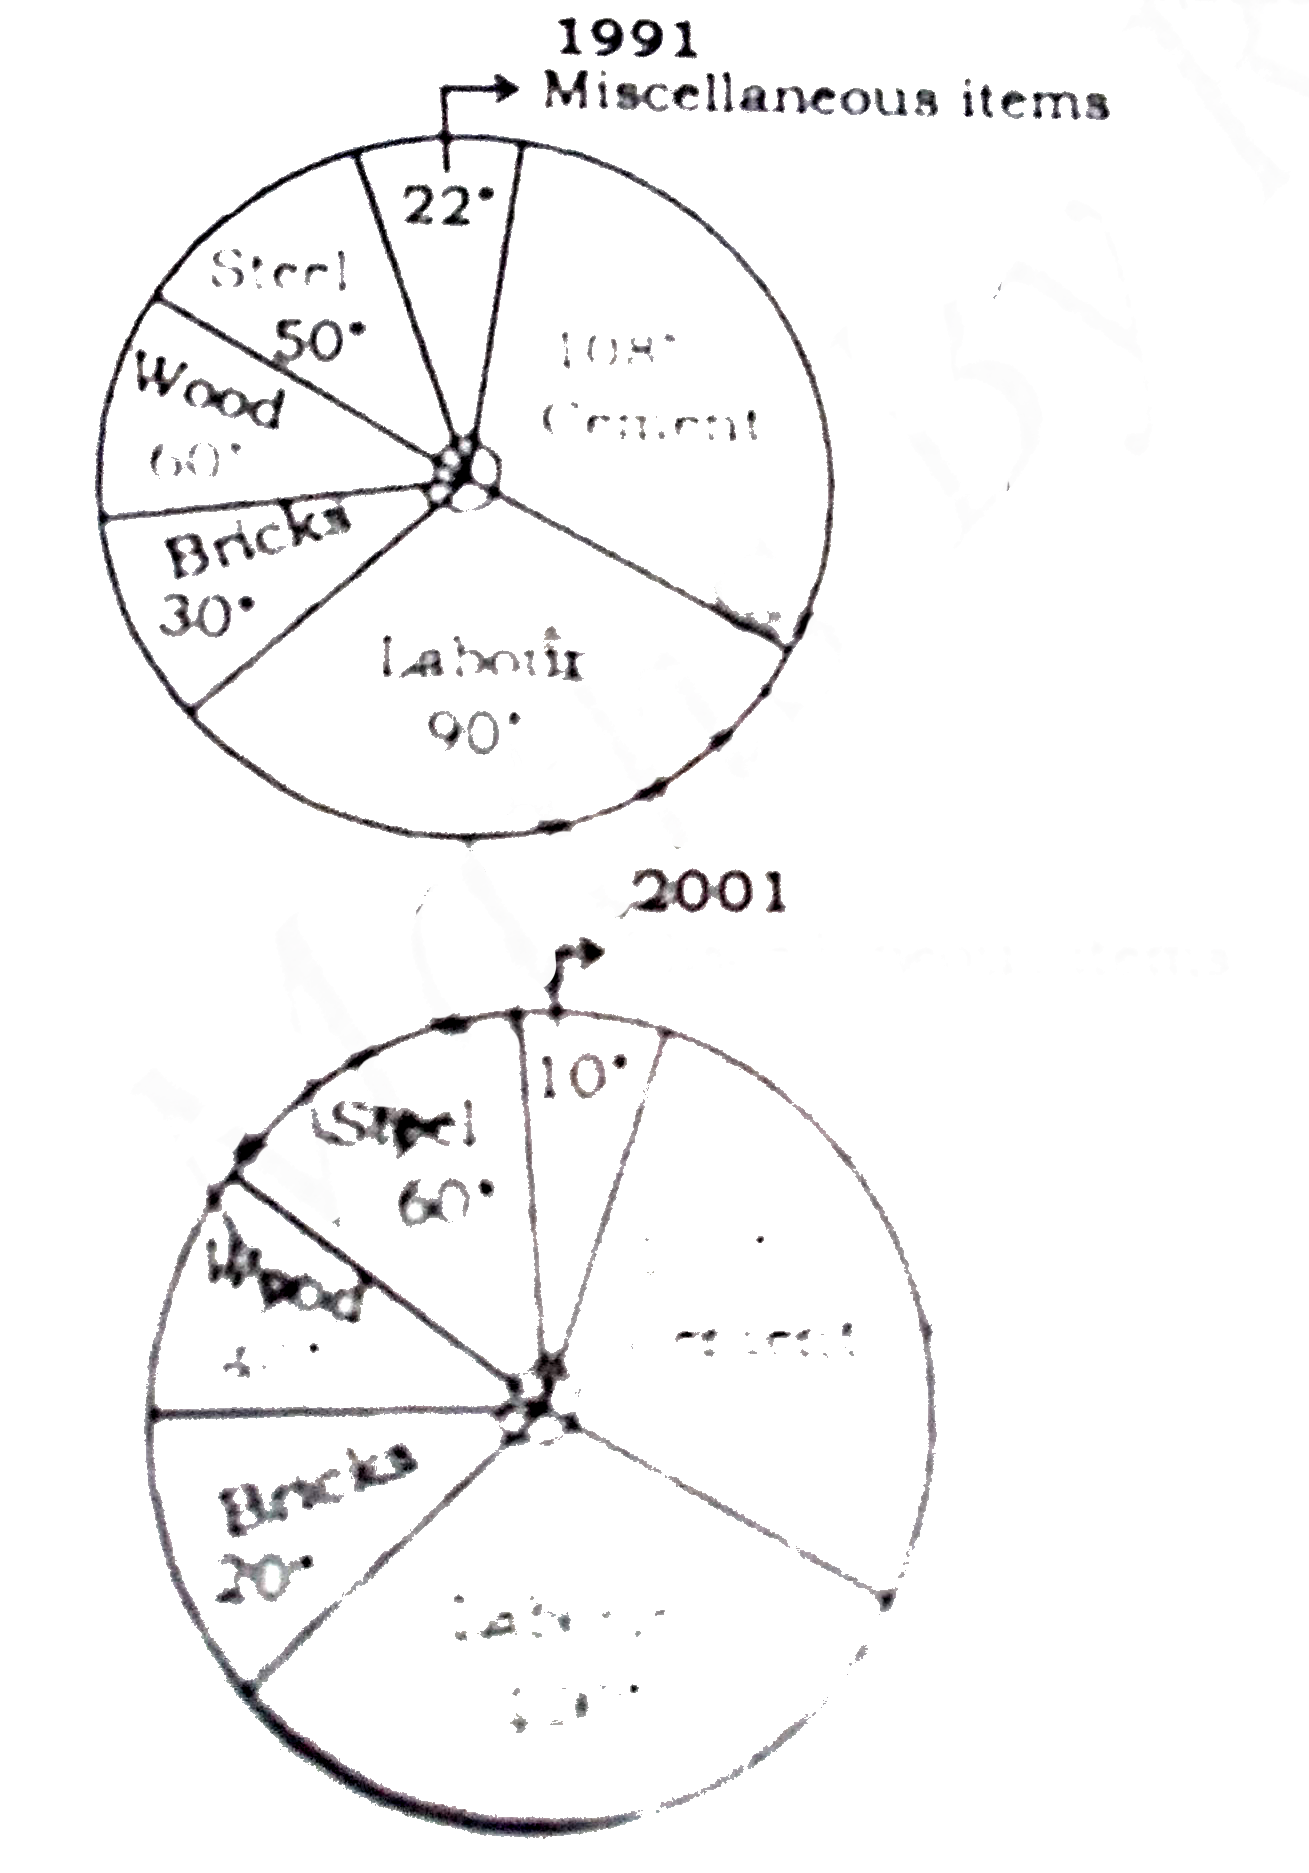
यदि भवन निर्माण की कुल लागत वर्ष 1991 में रू 3,60,000 तथा वर्ष 2001 में लागत रू 8,64,000 हो तो बताये वर्ष 1991 तथा 2001 में इस्पात पर कितने रुपये खर्च किये गए ।
रू 2,16,00 रू 4,32,000
रू 60,000 रू 84,000
रू 80,000 रू 2,10,000
रू 50,000 रू 1,44,000
The correct Answer is:D
Expendtiture on Steel
Year 1991=50∘360∘×360000=Rs.50000
Year 2001 =864000360×60=Rs144000
Topper's Solved these Questions
Similar Questions
सरल करें: 1+11+22+31+45
01:11View SolutionA एक काम को 6 दिनों में तथा B उसी काम को 9 दिनों में कर सकता है दोनों मिलकर उस काम को कितने दिन में पूरा करेंगे ?
02:15View SolutionPie charts show the expenses on various heads show the expenses on various heads in construction of a house Study the pie chart
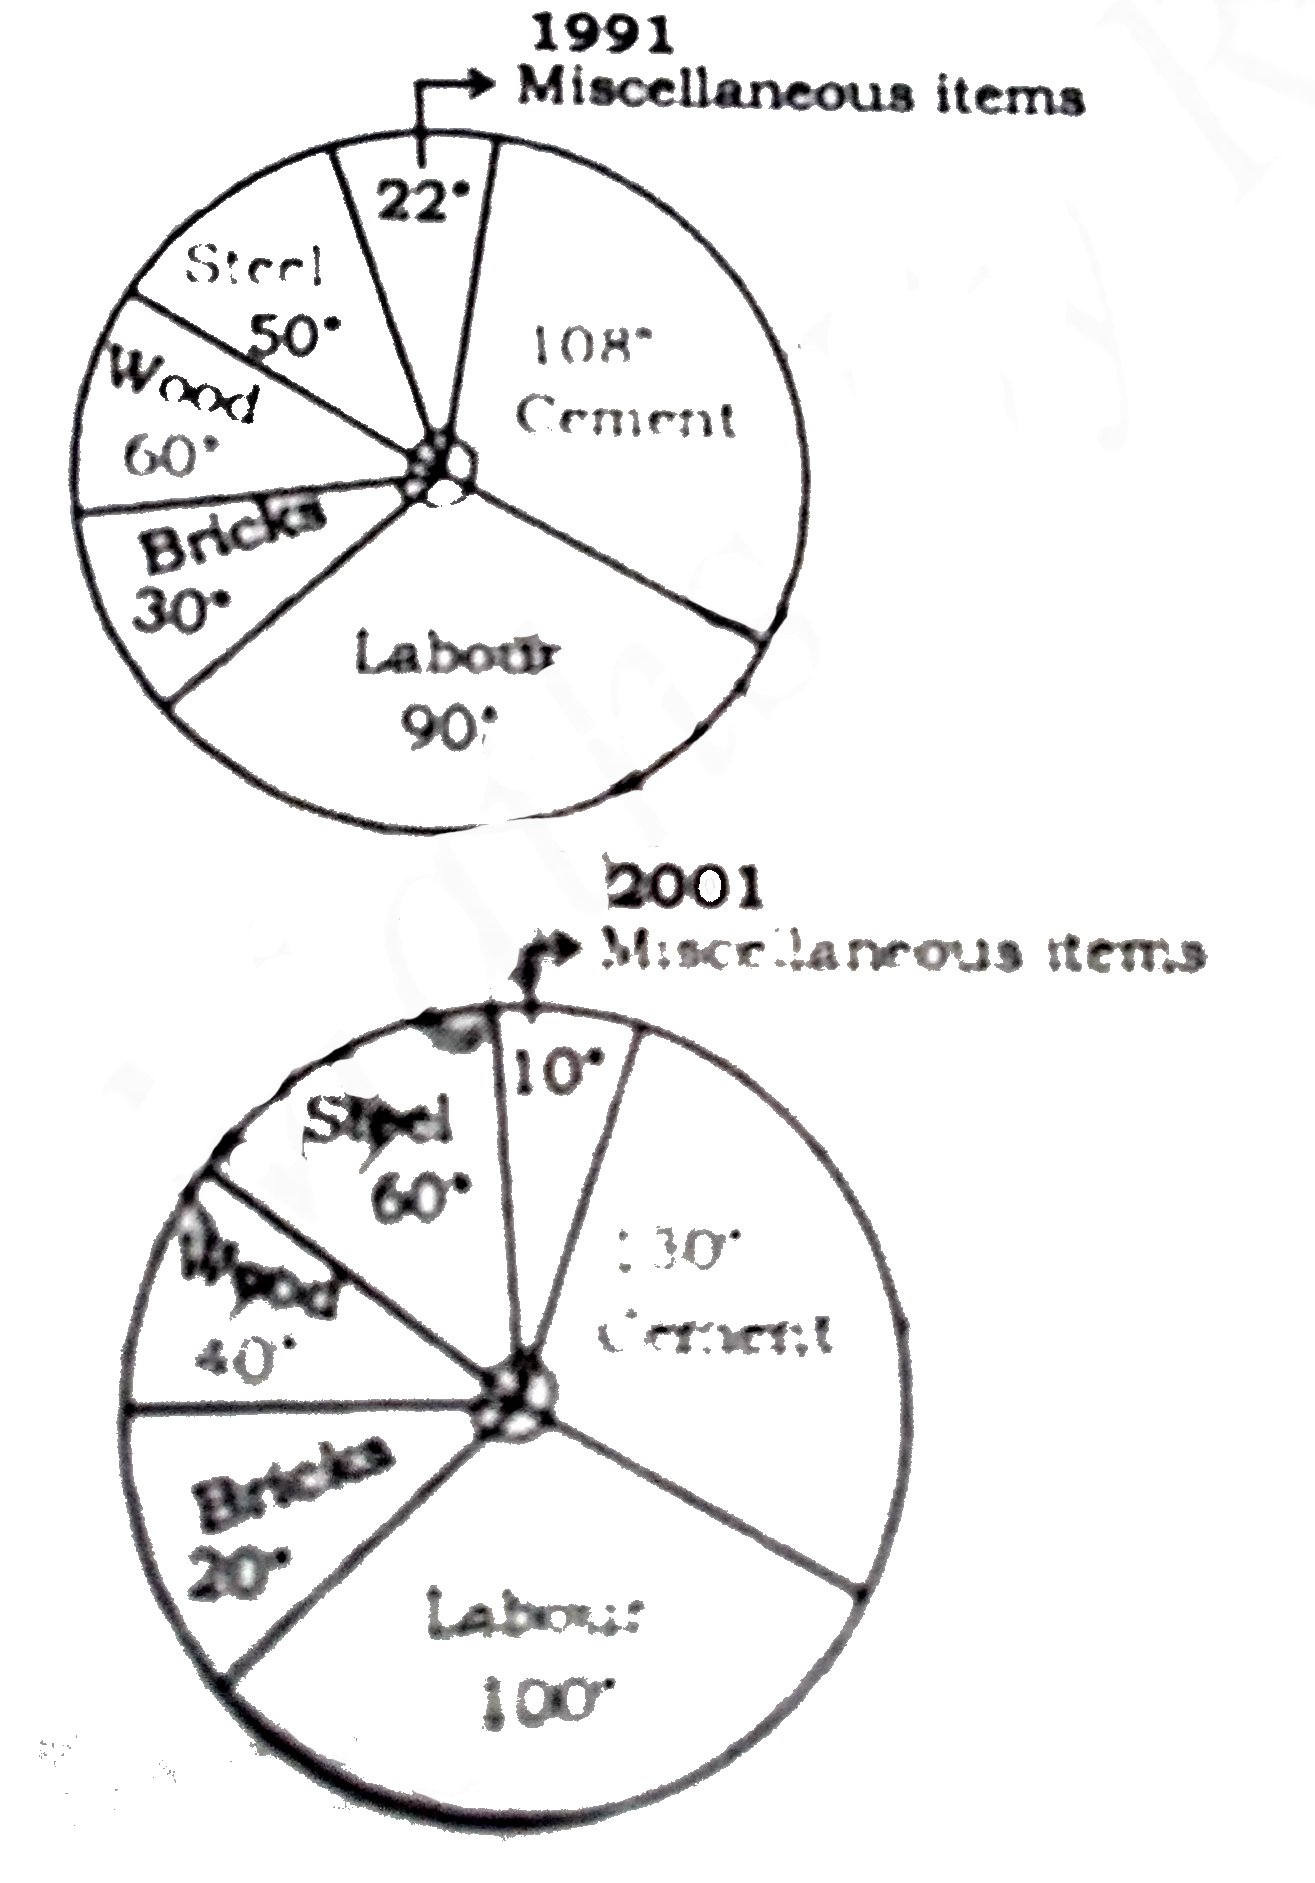
वर्ष 1991 में सीमेंट पर कुल कितने प्रतिशत खर्च किया गया ।02:11View SolutionPie charts show the expenses on various heads show the expenses on various heads in construction of a house Study the pie chart
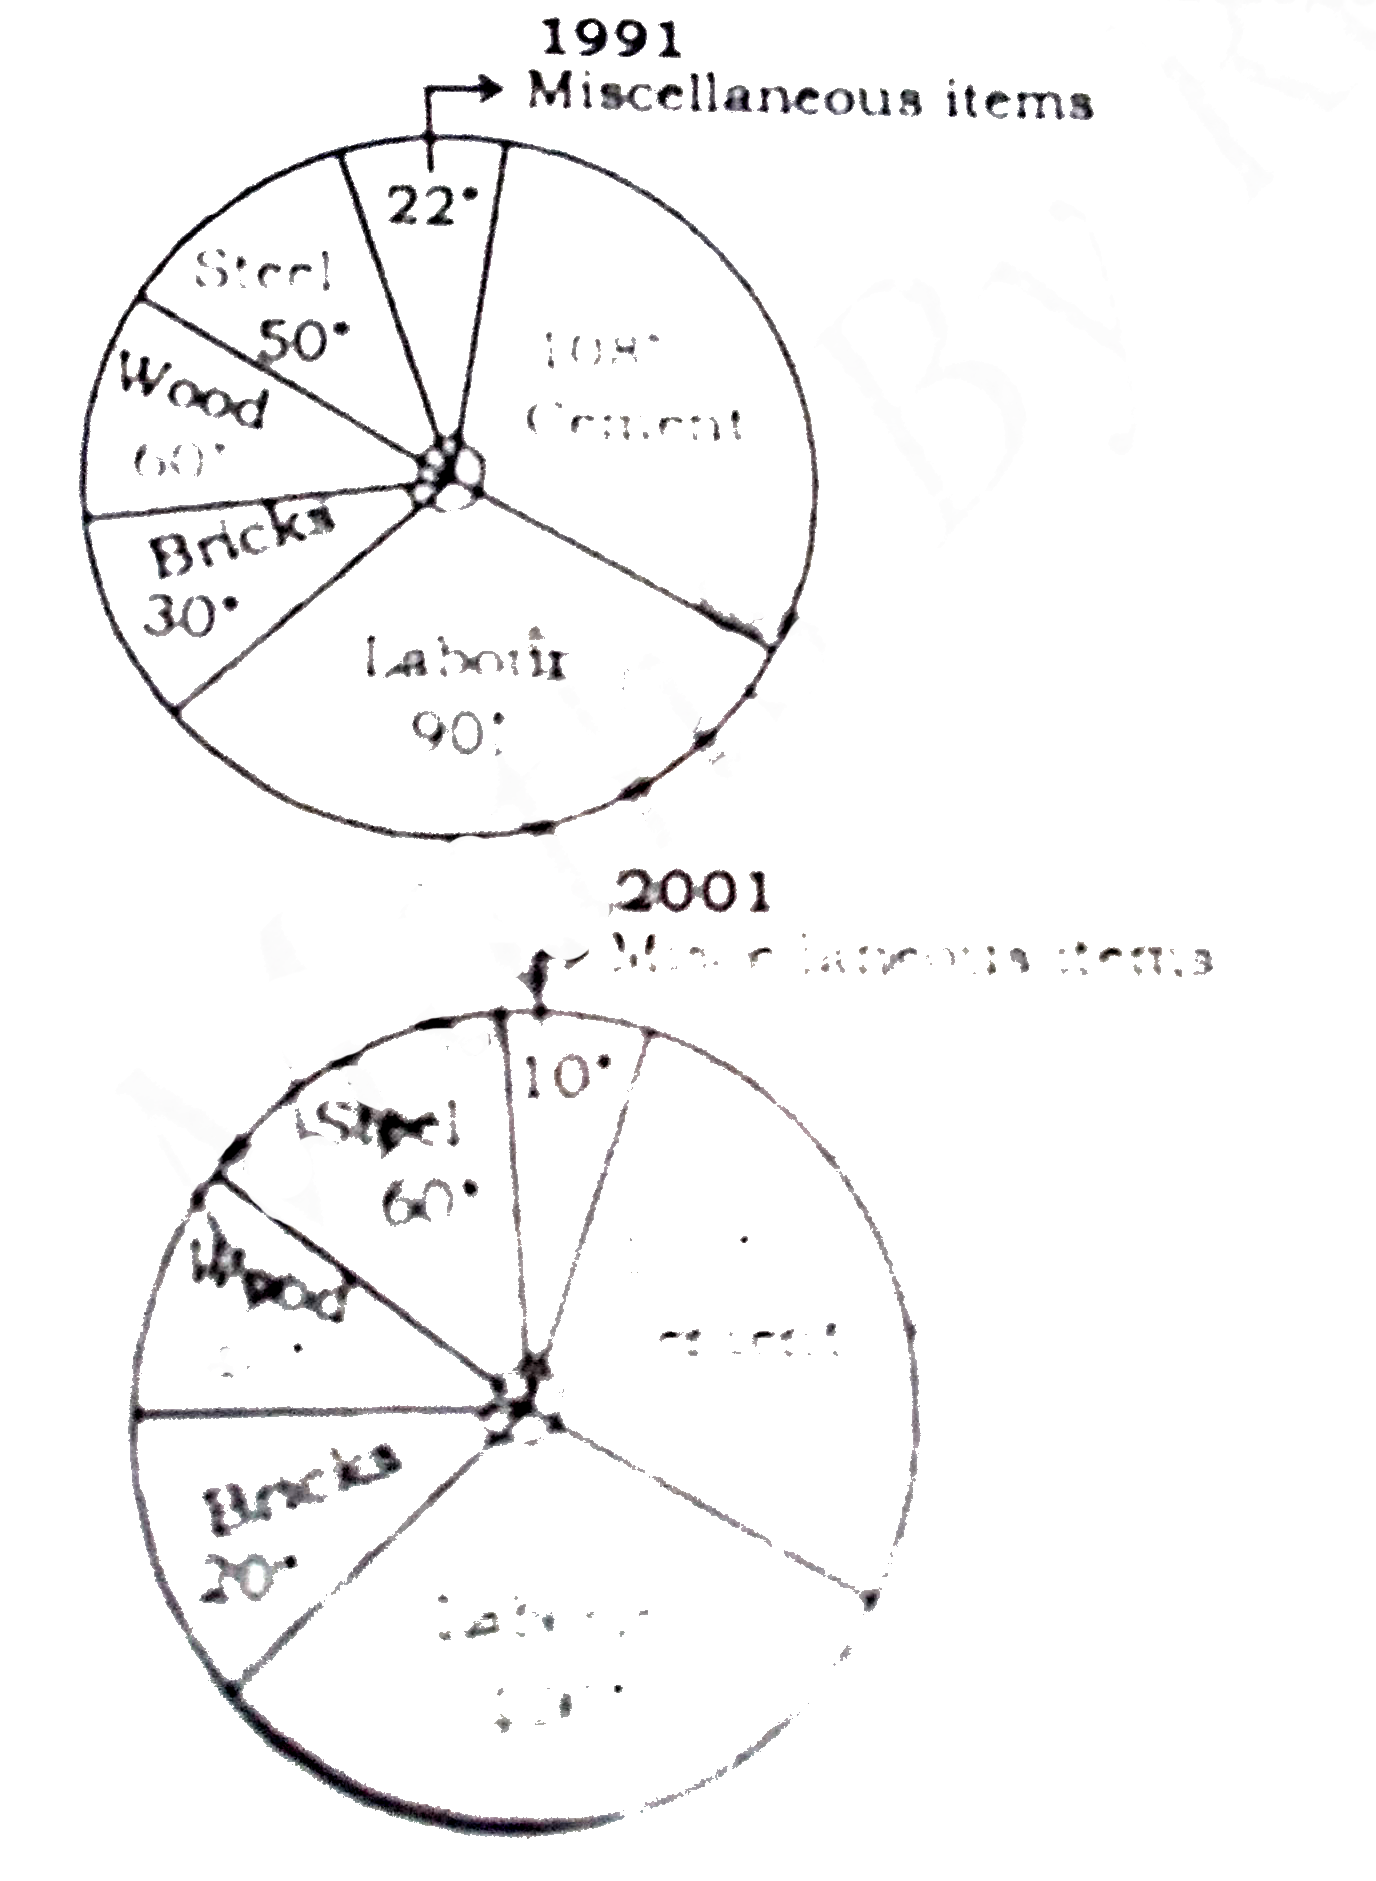
यदि एक घर के निर्माण में वर्ष 1991 में रू 360000 तथा वर्ष 2001 में कुल रू 864000 खर्च किया गया हो तो बताये वर्ष 1991 से 2001 में मजदूरी लागत में कितने % की बढ़ोतरी हुई ।02:45View SolutionDetermine the point of symmetry of a regular hexagon.
02:17View SolutionMatch the following Column A to Column B
 05:41View Solution
Match the following Column A to Column B
 02:10View Solution
Match the following Column A to Column B
 02:17View Solution
The inequation represented by the graph given below is :
02:10View SolutionThe inequation that best describes the graph given below is _________
01:44View SolutionThe inequation that best describes the following graph is _________
02:01View SolutionThe pie chart given below shows the expenditure on various items and savings of a family during the year 2009. Study the pie chart and answer these questions. नीचे दिया गया याई-चार्ट वर्ष २००९ में एक परिवार द्वारा विभिन्न मदों पर व्यय की गई धनराशि तथा बचत को प्रदर्शित करता है। पाईं-चार्ट का अध्ययन कीजिये तथा इस पर आधारित प्रश्नों का उत्तर दीजिये- If the total income of the family for the year 2009 was Rs.1,50,000 then the difference between the expenditures on housing and transport was यदि वर्ष 2009 में परिवार को कुल आय 1,50,000 रुपये रही हो, तो आवास तथा परिवहन पर किये गये व्ययों का अंतर था?
01:24View SolutionThe Pie-chart given below shows the figures of various heads of expenditure incurred by Anurag in a year. In how many heads is his expenditure less than the expenditure he incurred on tax?
नीचे दिया गया वृत्त आरेख अनुराग द्वारा किसी वर्ष में किए गए व्यय के विभिन्न शीर्षों के आंकड़ों को दर्शाता है | उसके द्वारा टैक्स पर किए गए व्यय की तुलना में कितने शीर्षों में उसके व्यय कम हैं ?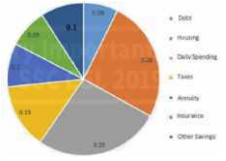 01:45View Solution
The pie chart given here shows the breakup of the cost of construction of a house on various heads. Study the chart and answer the questions.
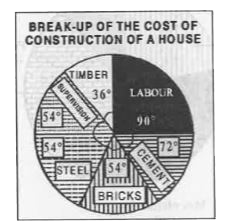
If the total cost of construction of the house is Rs 15,00,000, how much amount of money was spent on labour ?02:28View SolutionPie charts shows the expenses on various heads in construction of a house. Study the pie-chart.
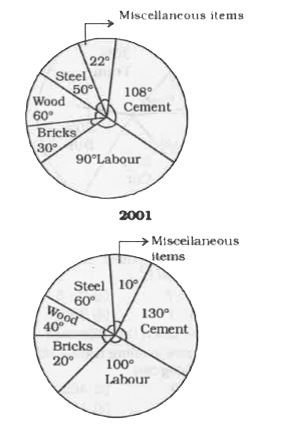
What percentage of the total amount is being spent on cement in 1991 ?02:17View Solution

