The following is a horizontal bar diagram showing the accidents in which two - wheelers are involved with other objects. Study the diagram and answer the question.
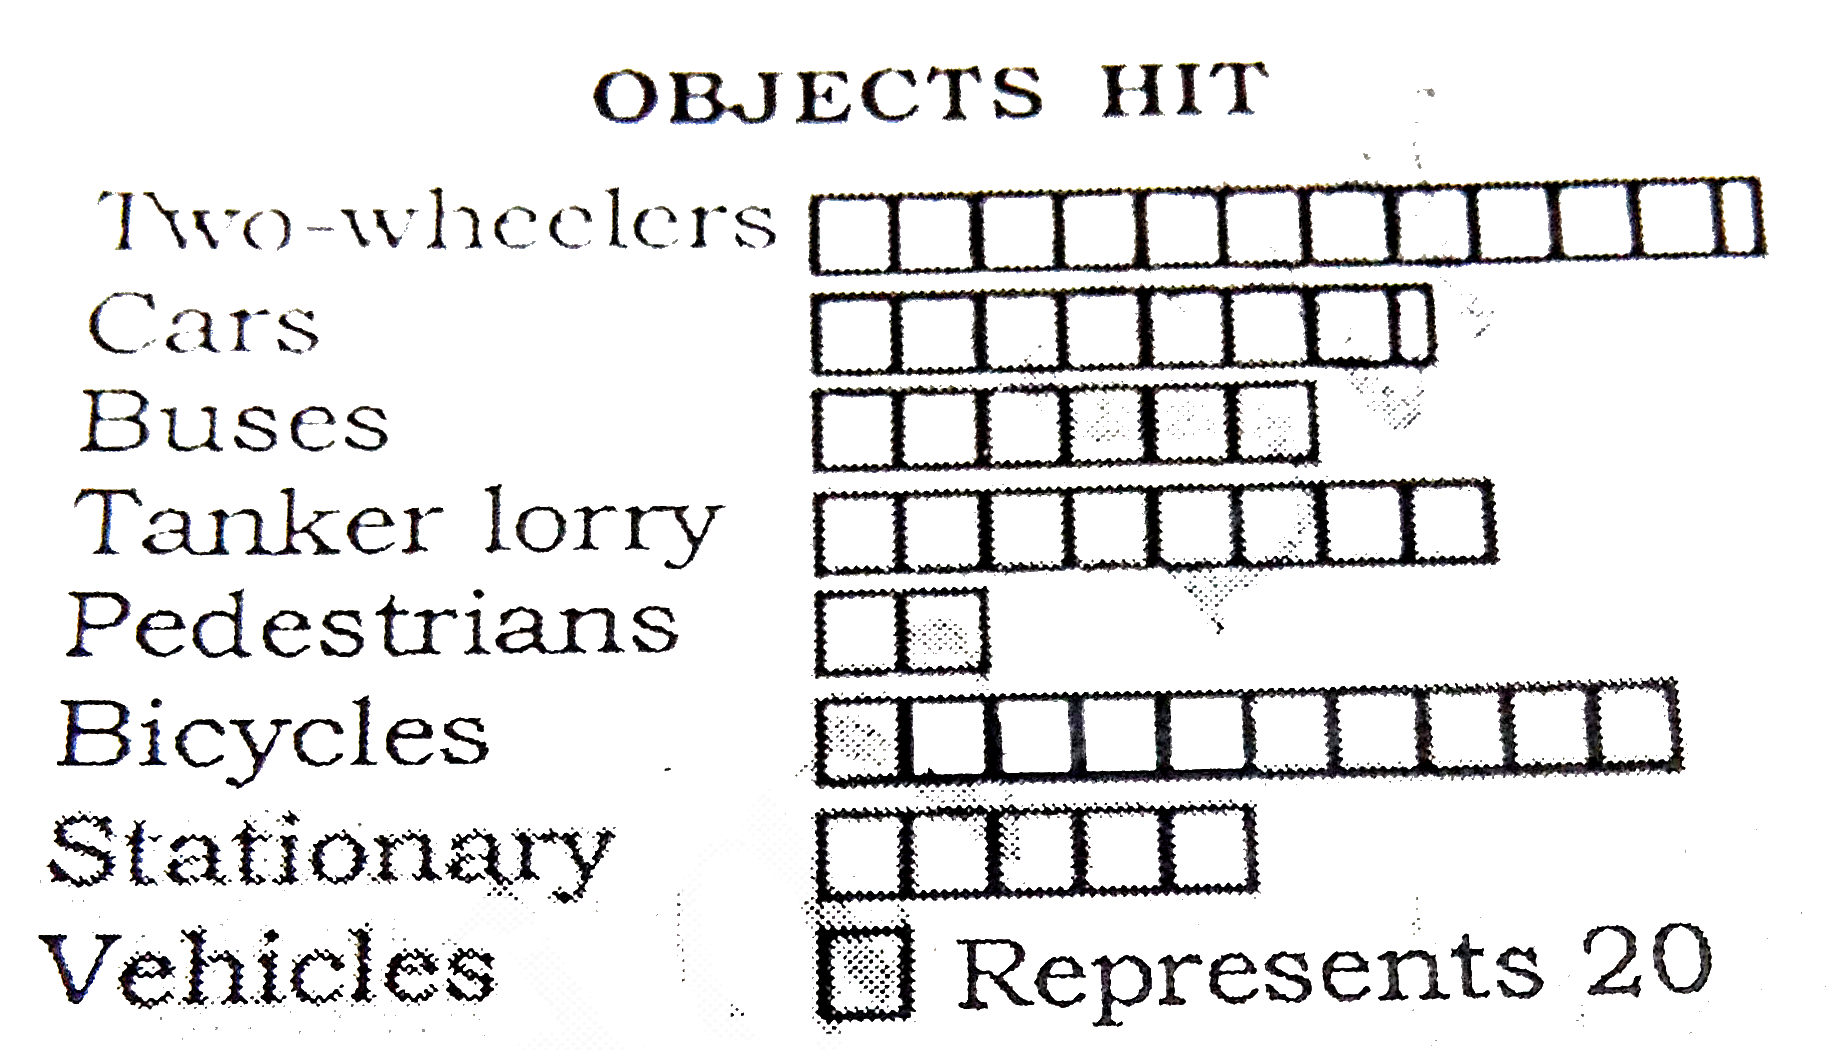
यदि दिए गए वार ग्राफ को पाई चार्ट के द्वारा दर्शाया जाए और पाई चार्ट पर बनने वाला एक कोण हो तो बताये वह कौन सी मद हो सकती है ।
pedestrians
bicycle
busces
stationary vehicles
∴360∘=1000
1∘=1000360∘
36∘=1000360∘×36∘=100
It is the accidents to stationary vehicles
Topper's Solved these Questions
Similar Questions
सरल करें: 1+11+22+31+45
View SolutionA एक काम को 6 दिनों में तथा B उसी काम को 9 दिनों में कर सकता है दोनों मिलकर उस काम को कितने दिन में पूरा करेंगे ?
View SolutionThe following is a horizontal bar diagram showing the accidents in which two - wheelers are involved with other objects. Study the diagram and answer the question.

दो पहिया वाहनों एवं अन्य वाहनों द्वारा होने वाली दुर्घटनाओं के बीच कितने प्रतिशत का अंतर है
View SolutionThe following is a horizontal bar diagram showing the accidents in which two - wheelers are involved with other objects. Study the diagram and answer the question.
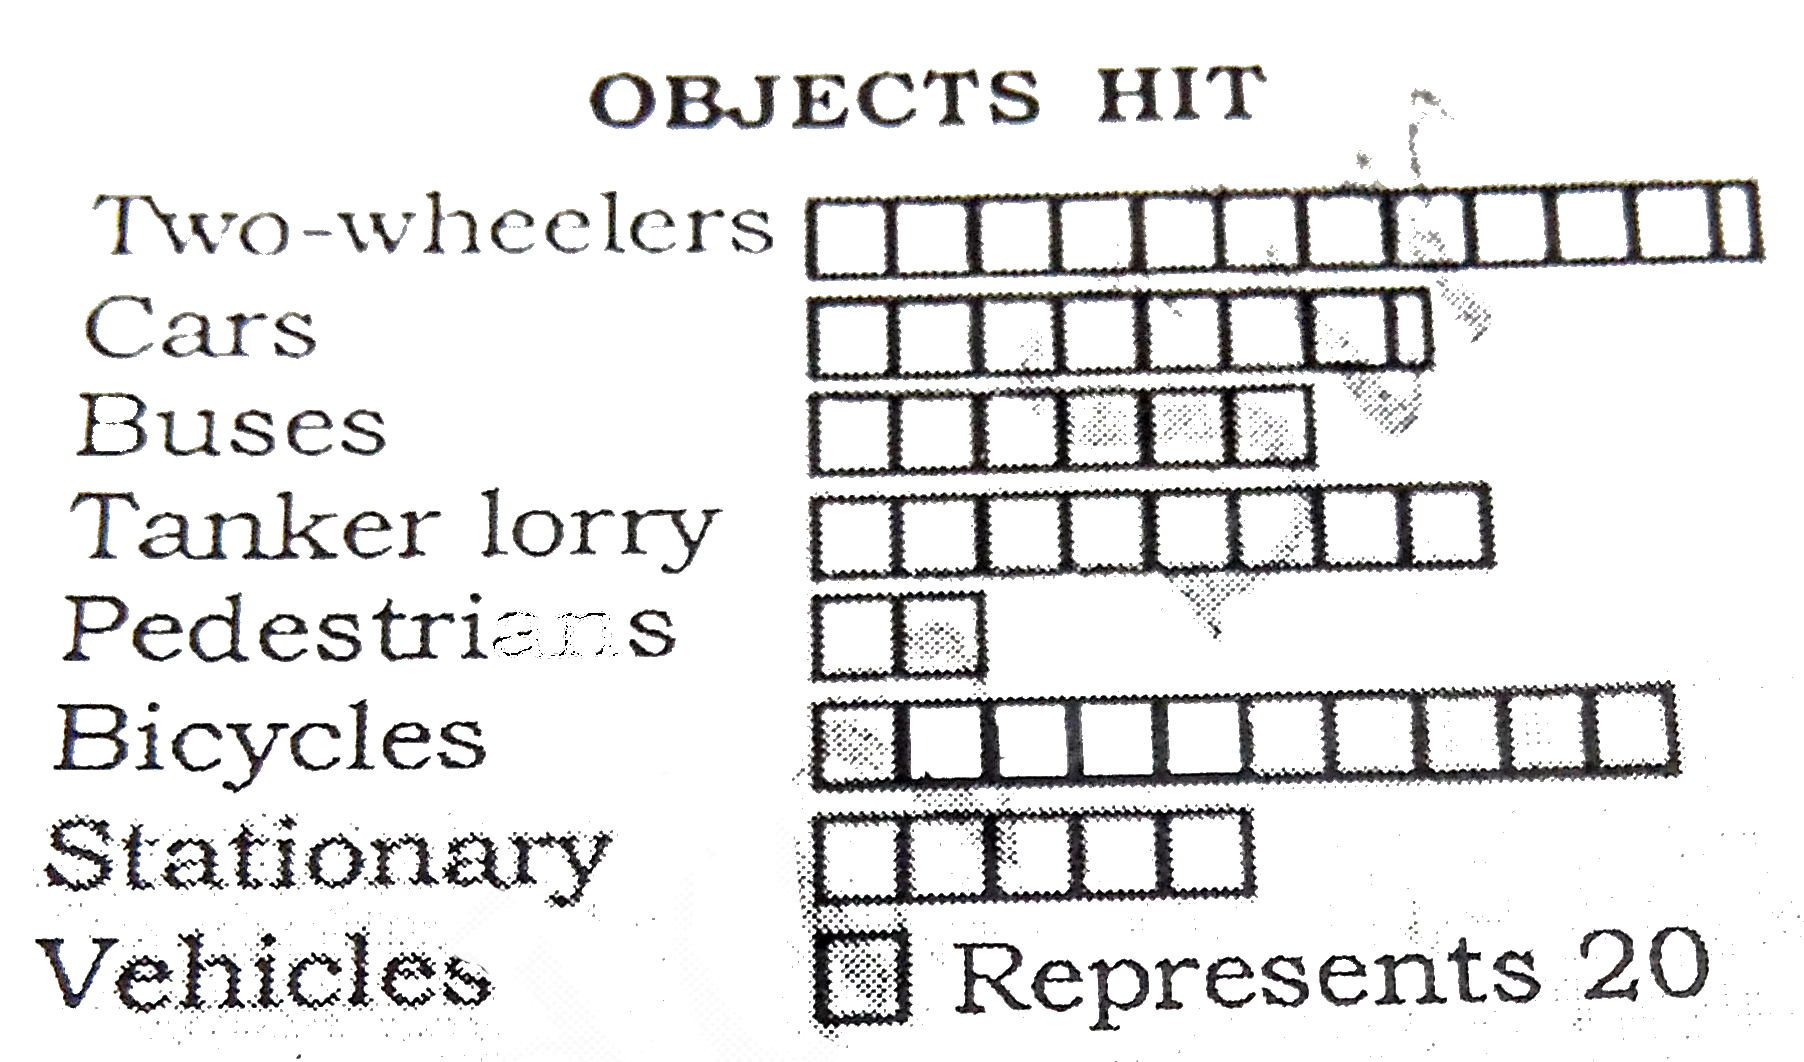
पैदल तथा साइकिल से होने वाली दुर्घटनाओं का कितना है ।
View SolutionThe following is a horizontal bar diagram showing the accidents in which two - wheelers are involved with other objects. Study the diagram and answer the question.
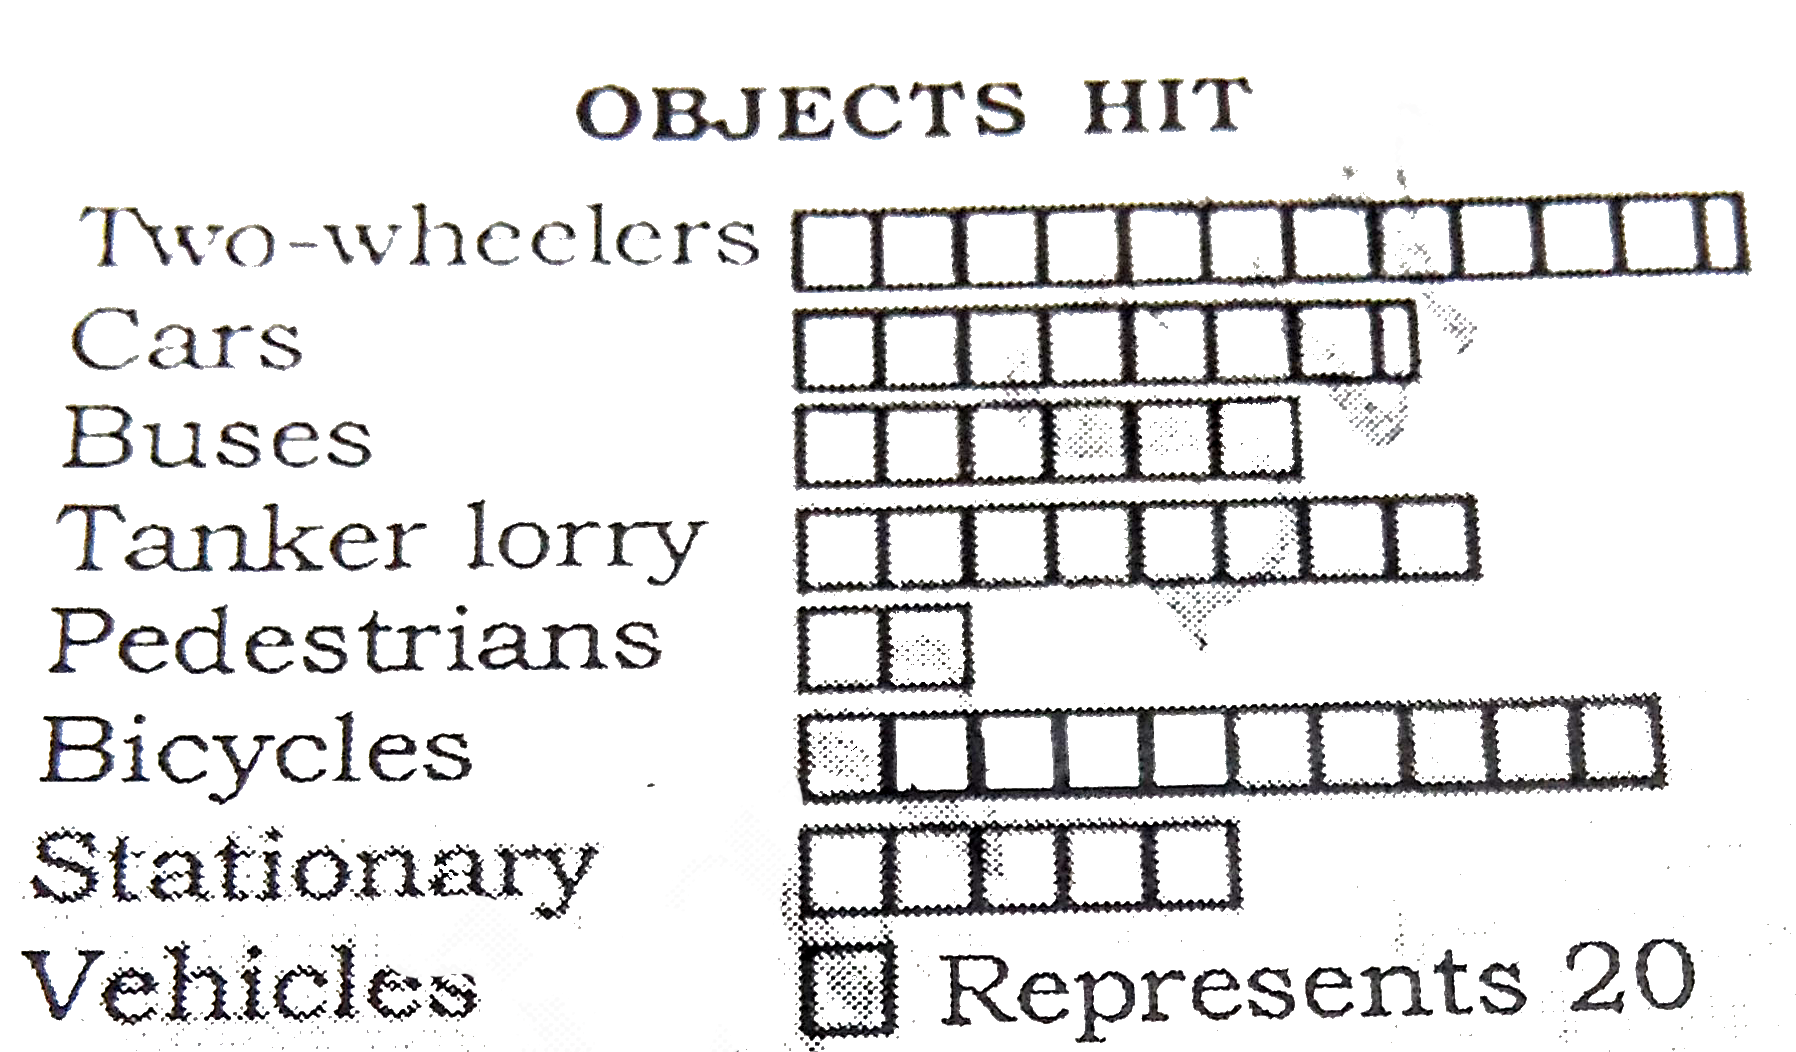
बस द्वारा होने वाली दुर्घटनाओं कार द्वारा होने वाली दुर्घटनाओं से कितने कम है ।
View SolutionWhich of the following are correct chain isomers of butane ? (i)
View SolutionDetermine the point of symmetry of a regular hexagon.
View SolutionMatch the following Column A to Column B

View SolutionMatch the following Column A to Column B

View SolutionMatch the following Column A to Column B

View SolutionThe inequation represented by the graph given below is :
View SolutionThe inequation that best describes the graph given below is _________
View SolutionThe inequation that best describes the following graph is _________
View SolutionWhich of the following best describes the diagram below of a molecular orbital?
ltimg src="https://d10lpgp6xz60nq.cloudfront.net/physics_images/JM_18_CHE_P1_E02_029_Q01.png" width="80%"gt
View SolutionDirections (Q. Nos. 16-20) The fallowing is a horizontal bar diagram showing the accidents in which two wheelers are involved with other objects. Study the diagram and answer the questions.
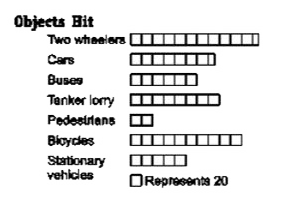
. The percentage of accidents in pedestrians and cyclists are involved is
View SolutionThe following pie chart shows the monthly expenditure incurred by a family on various items, and their savings. Study the chart and answer the question that follows
निम्नलिखित पाई चार्ट विभिन्न मदों पर एक परिवार द्वारा किए गए मासिक खर्च और उनकी बचत को दर्शाता है। चार्ट का अध्ययन करें और फिर पूछे गए प्रश्न का उत्तर दें।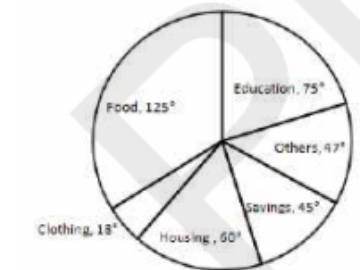 If the monthly income is ₹64,800, then the yearly savings are:
यदि मासिक आय ₹64,800 है, तो वार्षिक बचत होती है:
View Solution
