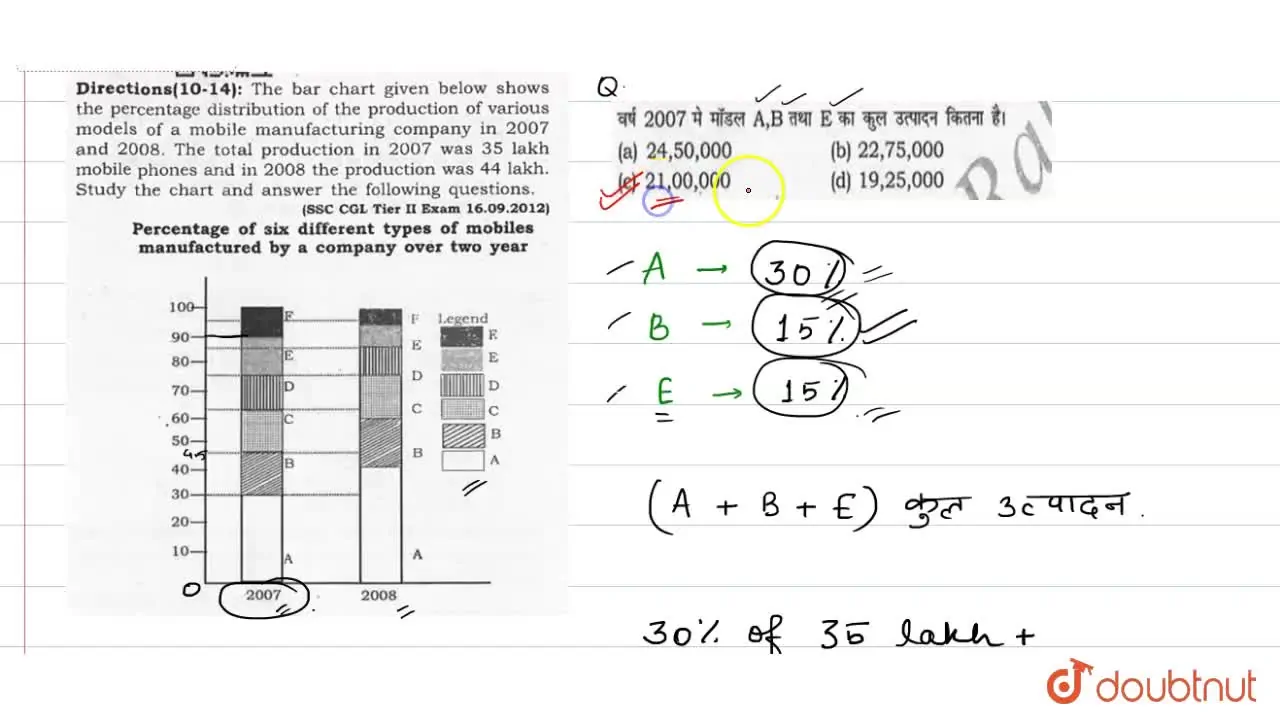
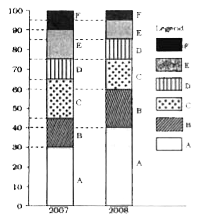
The bar chart given below shows the percentage distribution of the production of various models of a mobile manufacturing company in 2007 and 2008 The total production in 2007 was 35 lakh mobile phones and in 2008 the production was 44 lakh Study the chart and answer the following questions
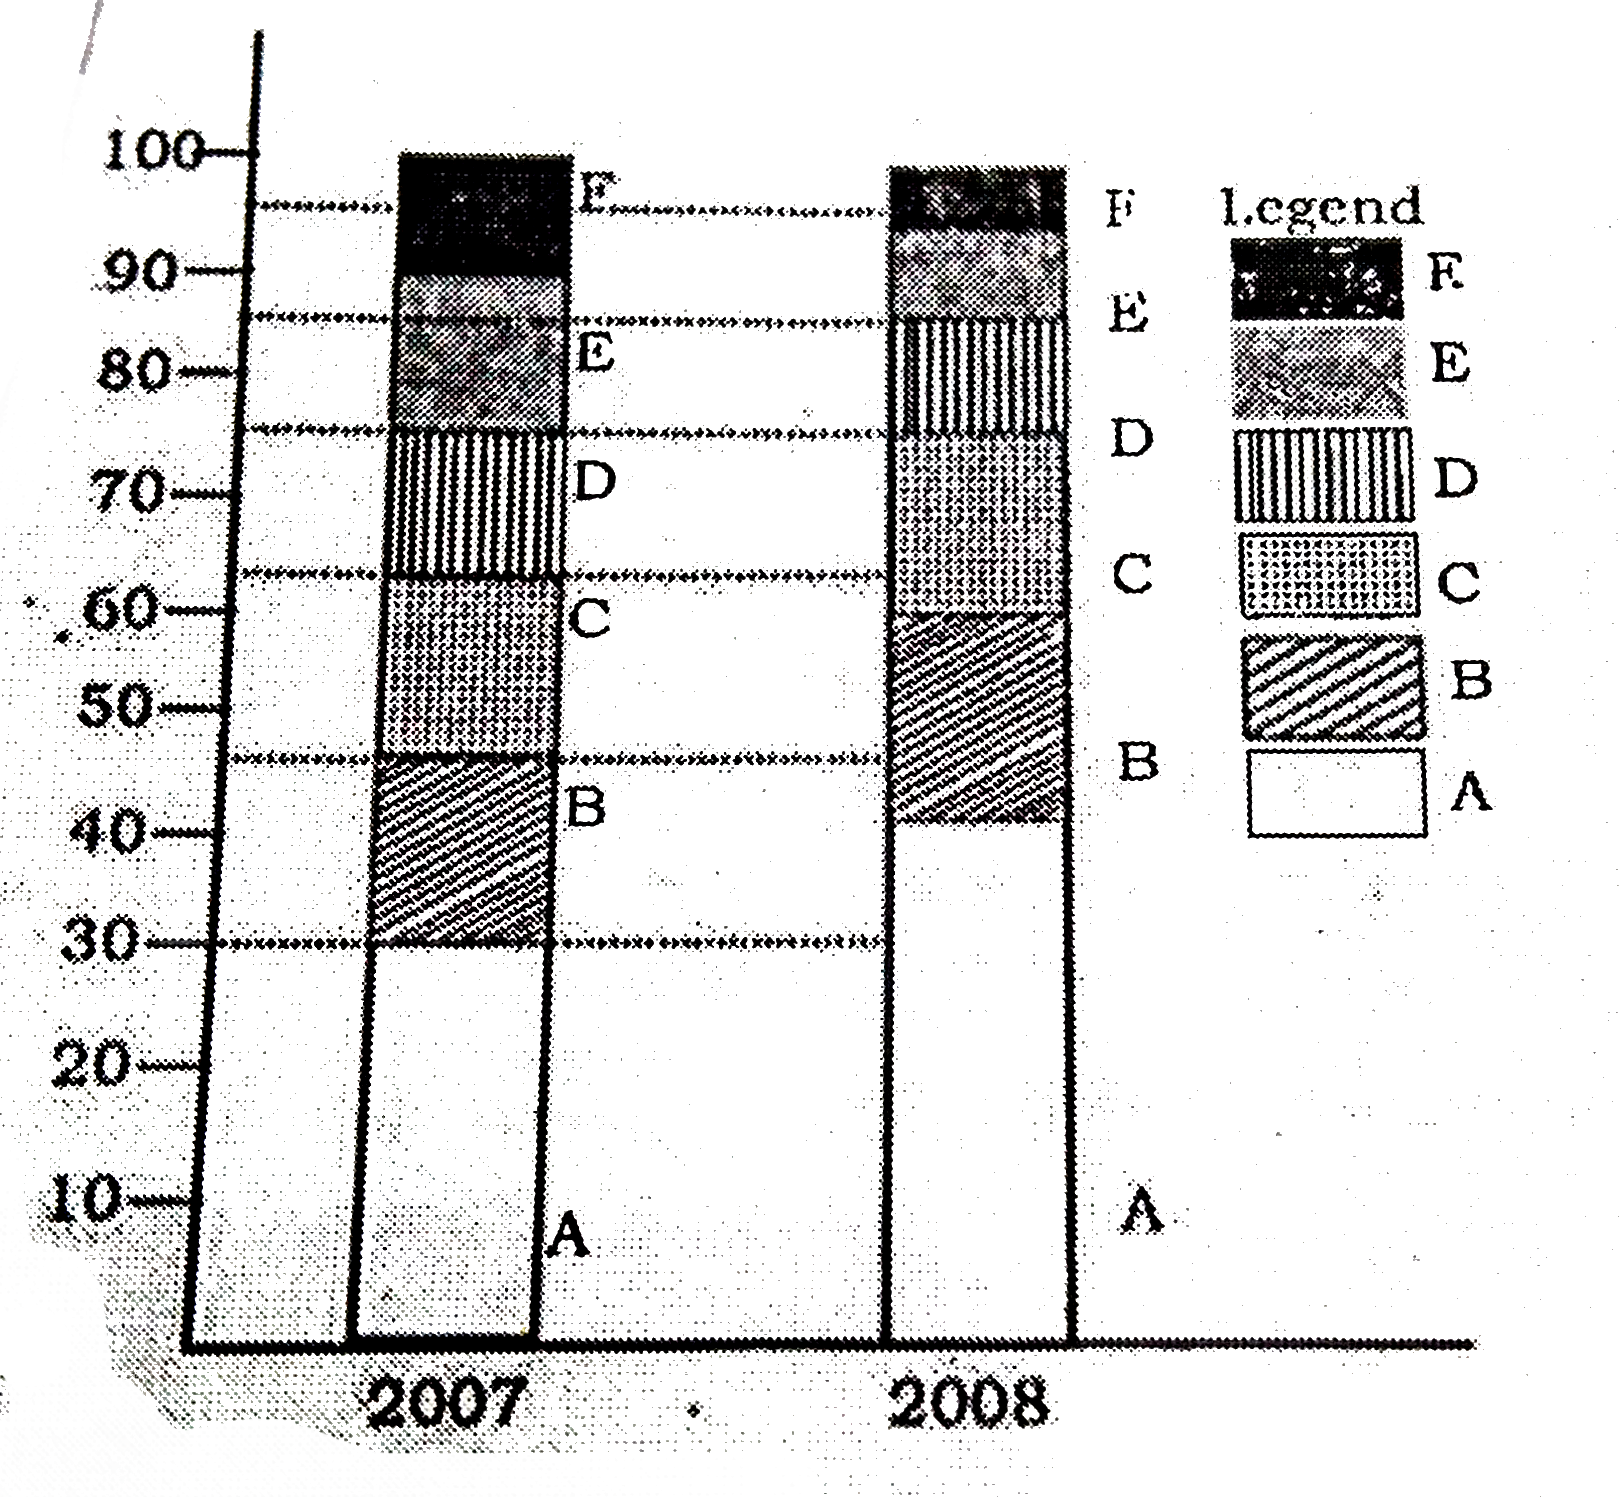
वर्ष 2007 में मॉडल A, B तथा E का कुल उत्पादन कितना है ।
24,50,000
22,75,000
21,00,000
19,25,000
Requried answer=35×30100+35×15100+35×15100
=35100(30+15+15)=35×60100=21 lakes.
Related Playlists
Similar Questions
सरल करें: 1+11+22+31+45
07:08View SolutionA एक काम को 6 दिनों में तथा B उसी काम को 9 दिनों में कर सकता है दोनों मिलकर उस काम को कितने दिन में पूरा करेंगे ?
03:46View SolutionThe bar chart given below shows the percentage distribution of the production of various models of a mobile manufacturing company in 2007 and 2008 The total production in 2007 was 35 lakh mobile phones and in 2008 the production was 44 lakh Study the chart and answer the following questions
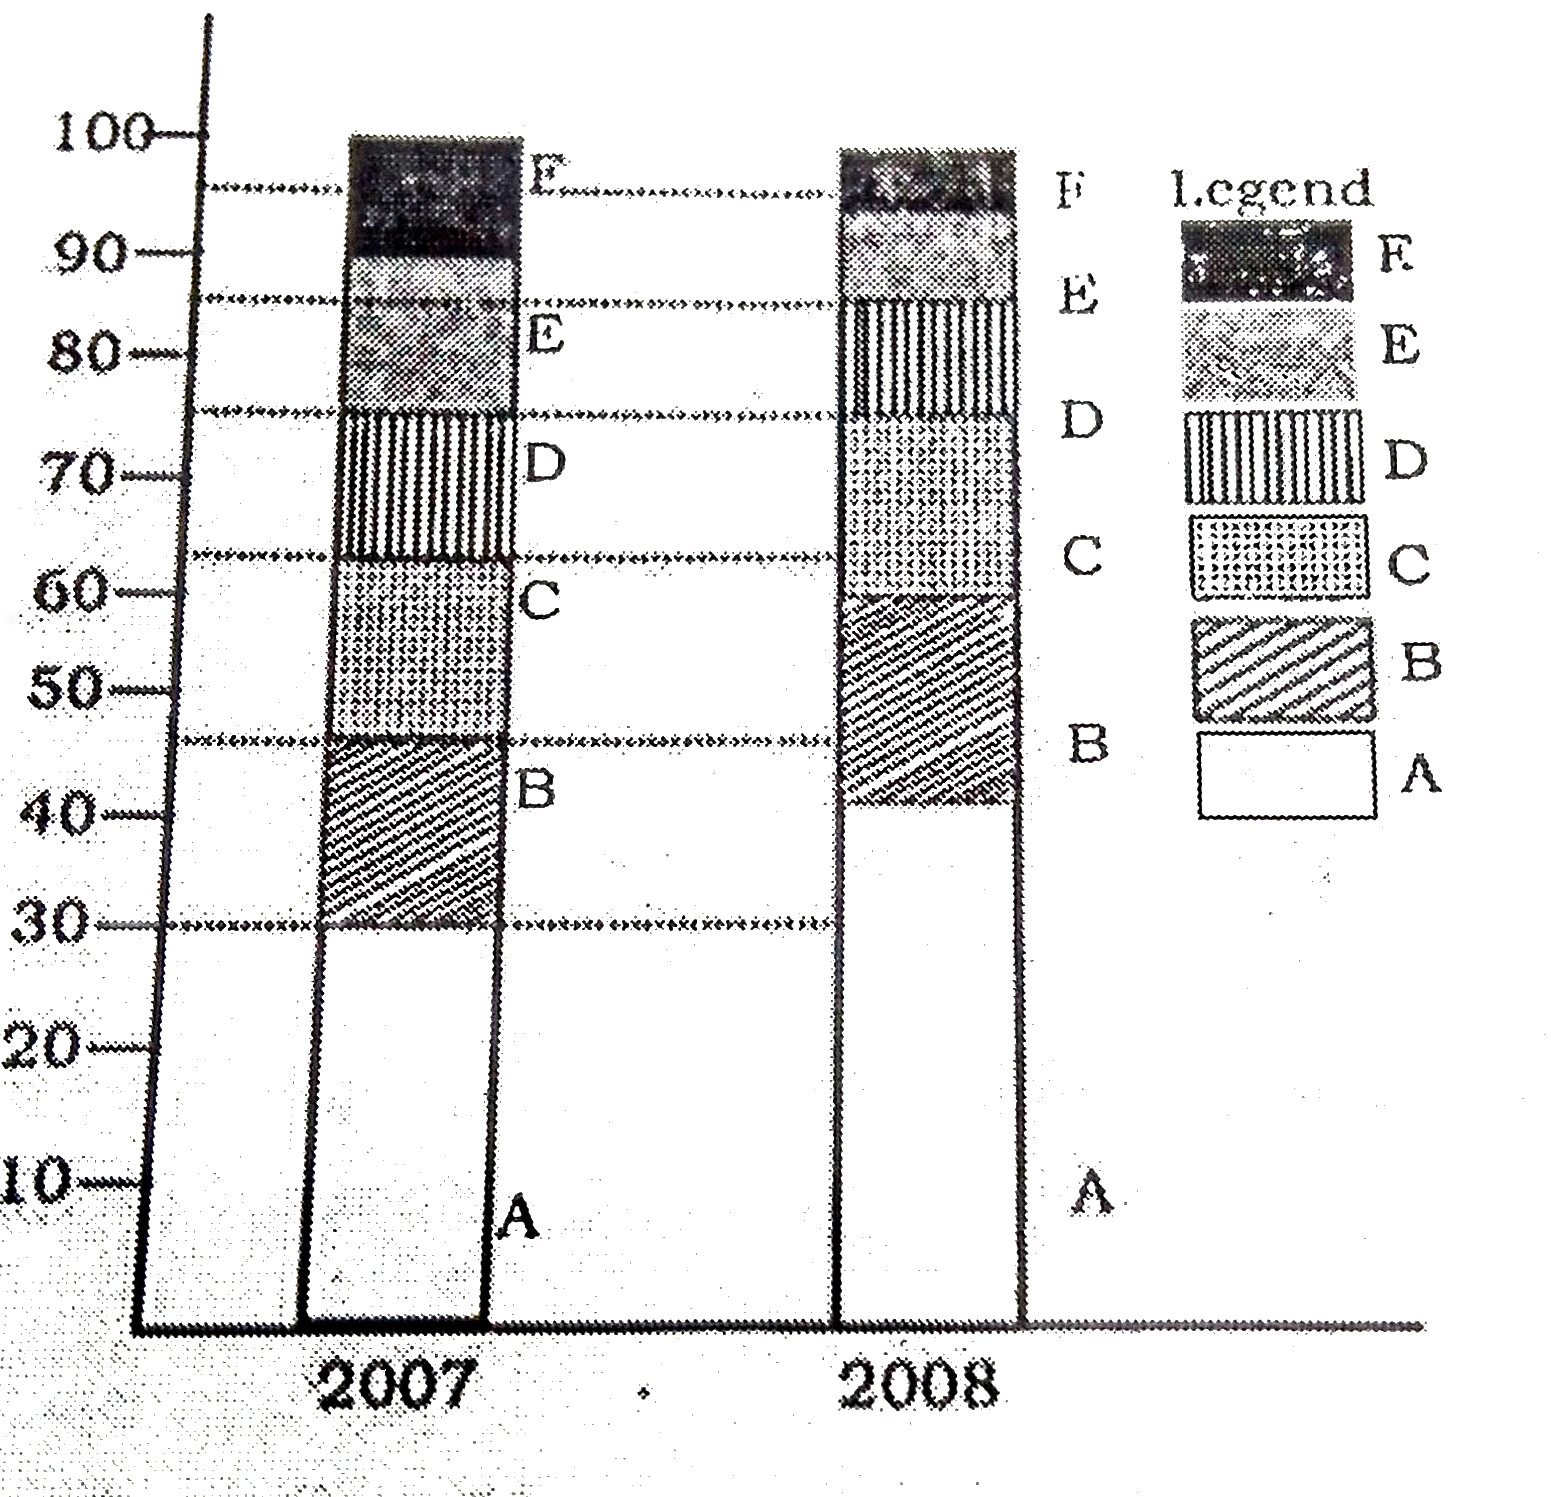
निम्न में से किस नमूनों का वर्ष 2007 से 2008 तक उत्पादन प्रतिशत का अंतर अधिकतम है ।02:43View SolutionThe bar chart given below shows the percentage distribution of the production of various models of a mobile manufacturing company in 2007 and 2008 The total production in 2007 was 35 lakh mobile phones and in 2008 the production was 44 lakh Study the chart and answer the following questions
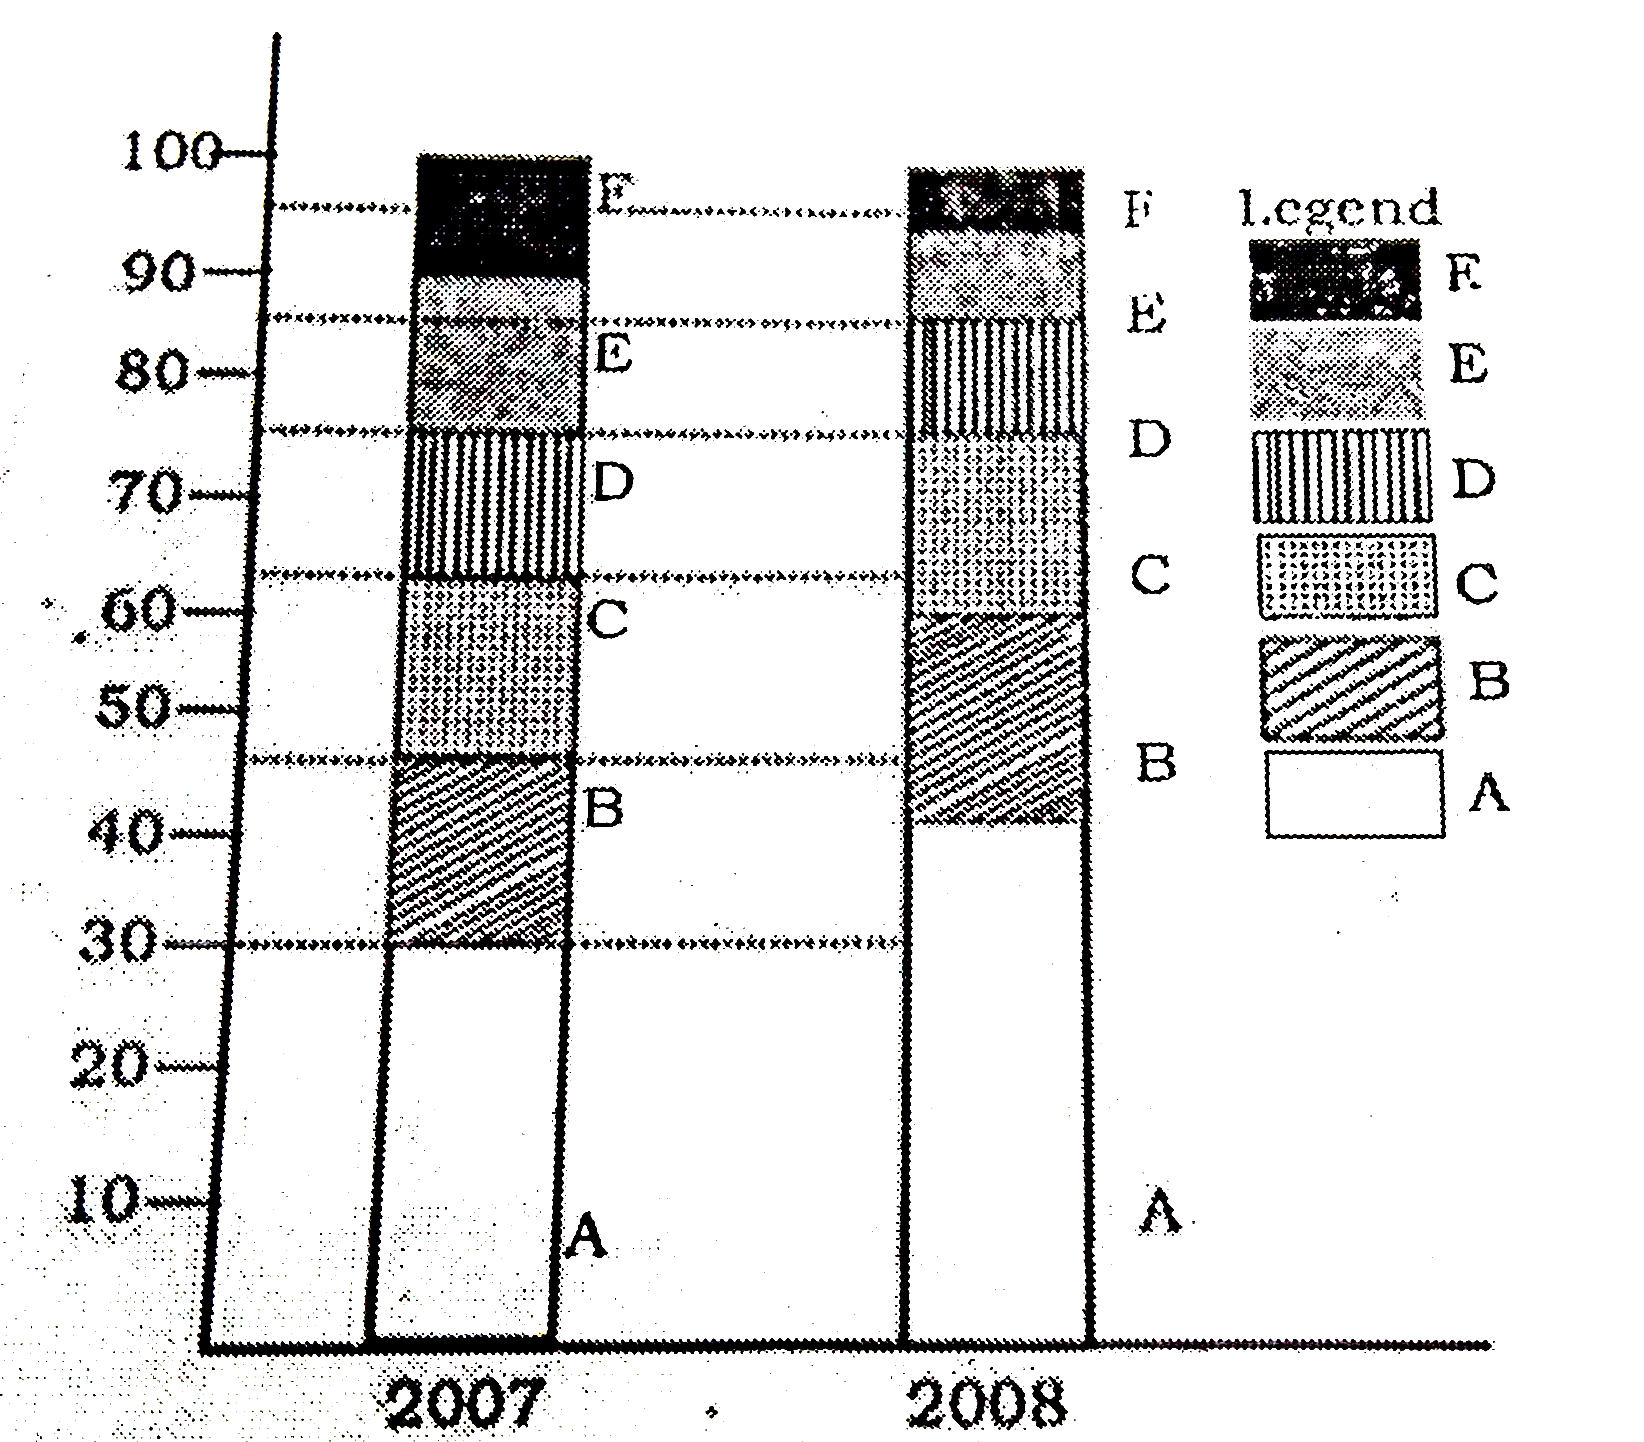
B प्रकार के नमूनों के उत्पादन की संख्या में वर्ष 2007 तथा 2008 में कितना अंतर हो ।03:12View SolutionThe bar chart given below shows the percentage distribution of the production of various models of a mobile manufacturing company in 2007 and 2008 The total production in 2007 was 35 lakh mobile phones and in 2008 the production was 44 lakh Study the chart and answer the following questions
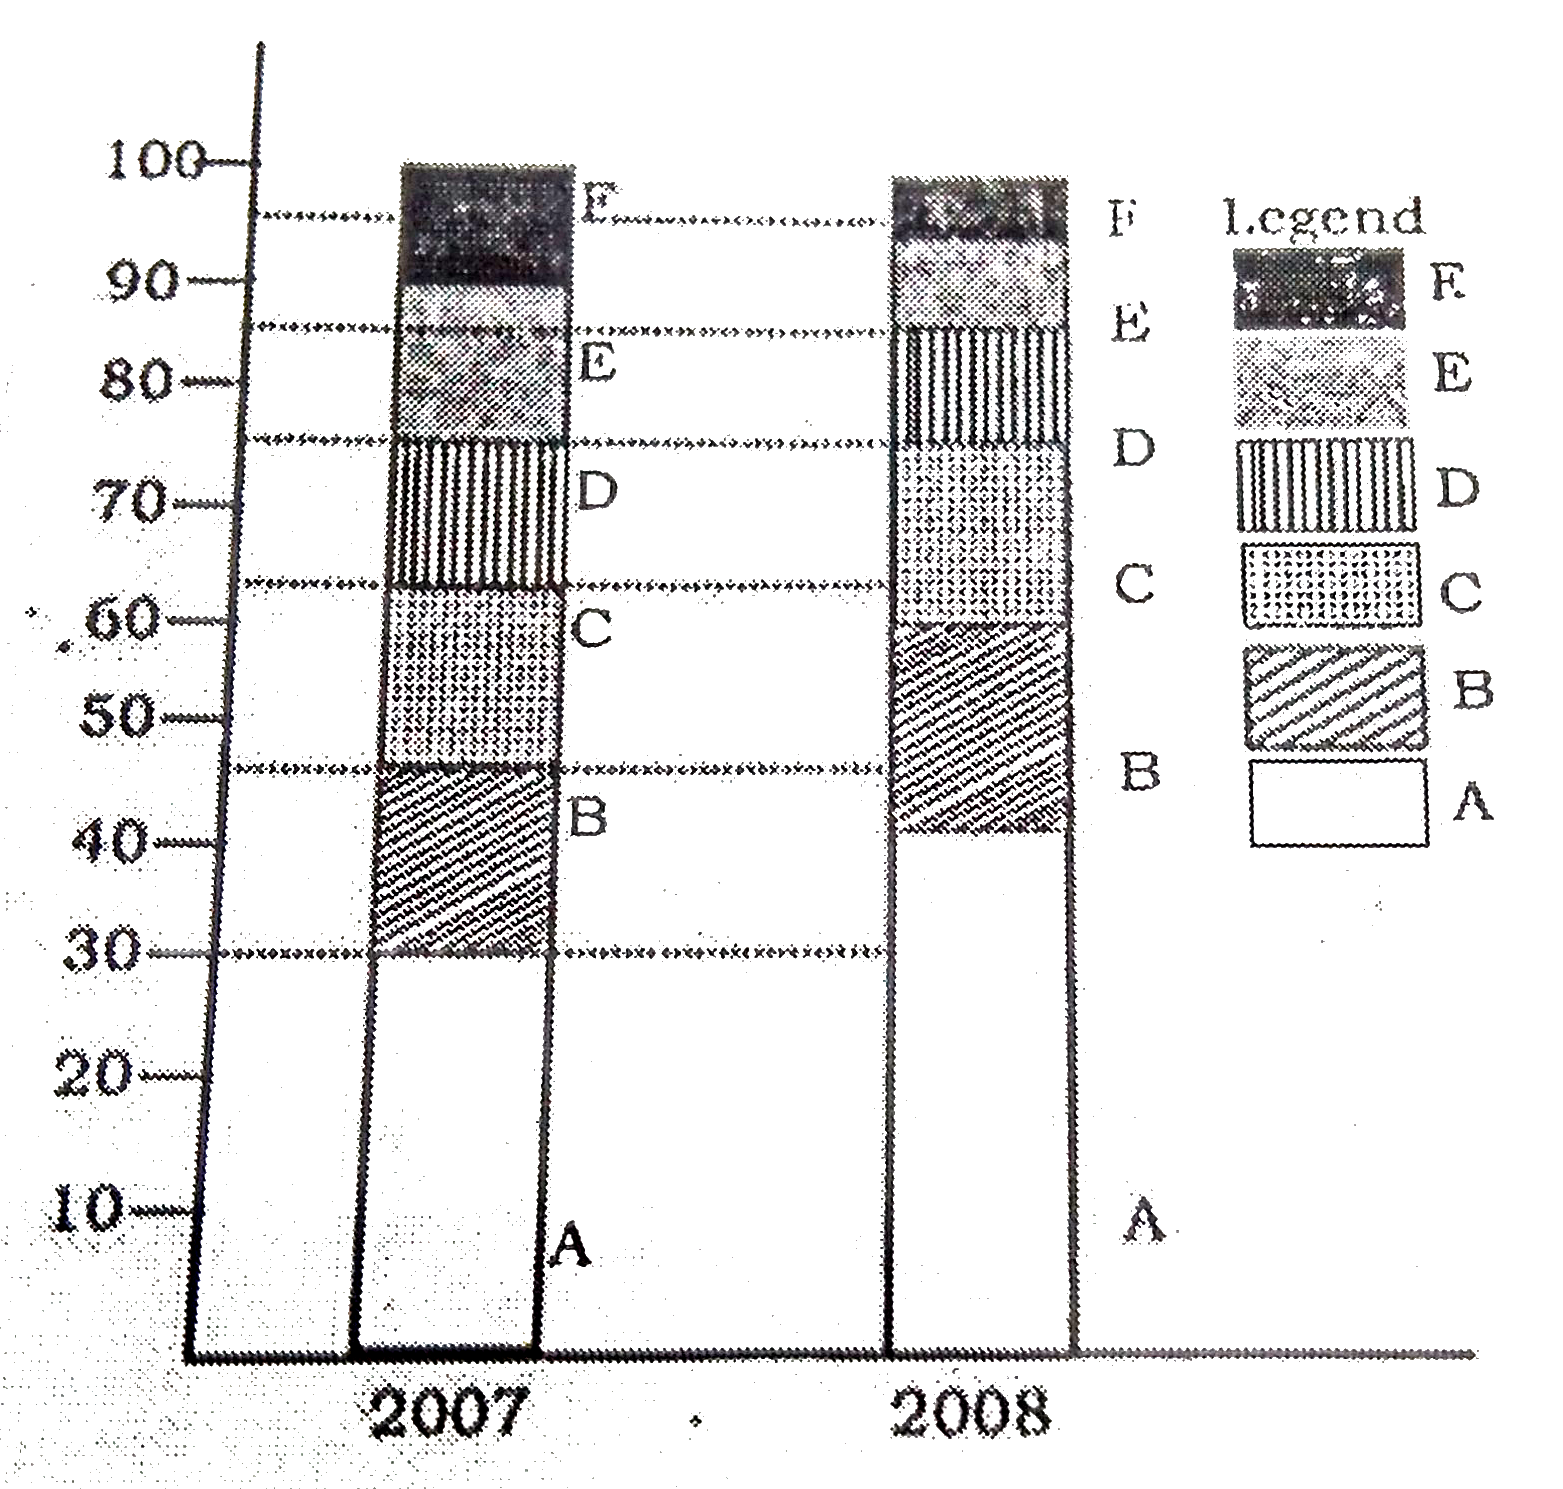
यदि A प्रकार के नमूनों का वर्ष 2008 तथा 2007 में उत्पादन प्रतिशत समान हो तो वर्ष 2008 में A प्रकार के नमूनों का कुल उत्पादन कितना था ।05:49View SolutionThe bar chart given below shows the percentage distribution of the production of various models of a mobile manufacturing company in 2007 and 2008 The total production in 2007 was 35 lakh mobile phones and in 2008 the production was 44 lakh Study the chart and answer the following questions
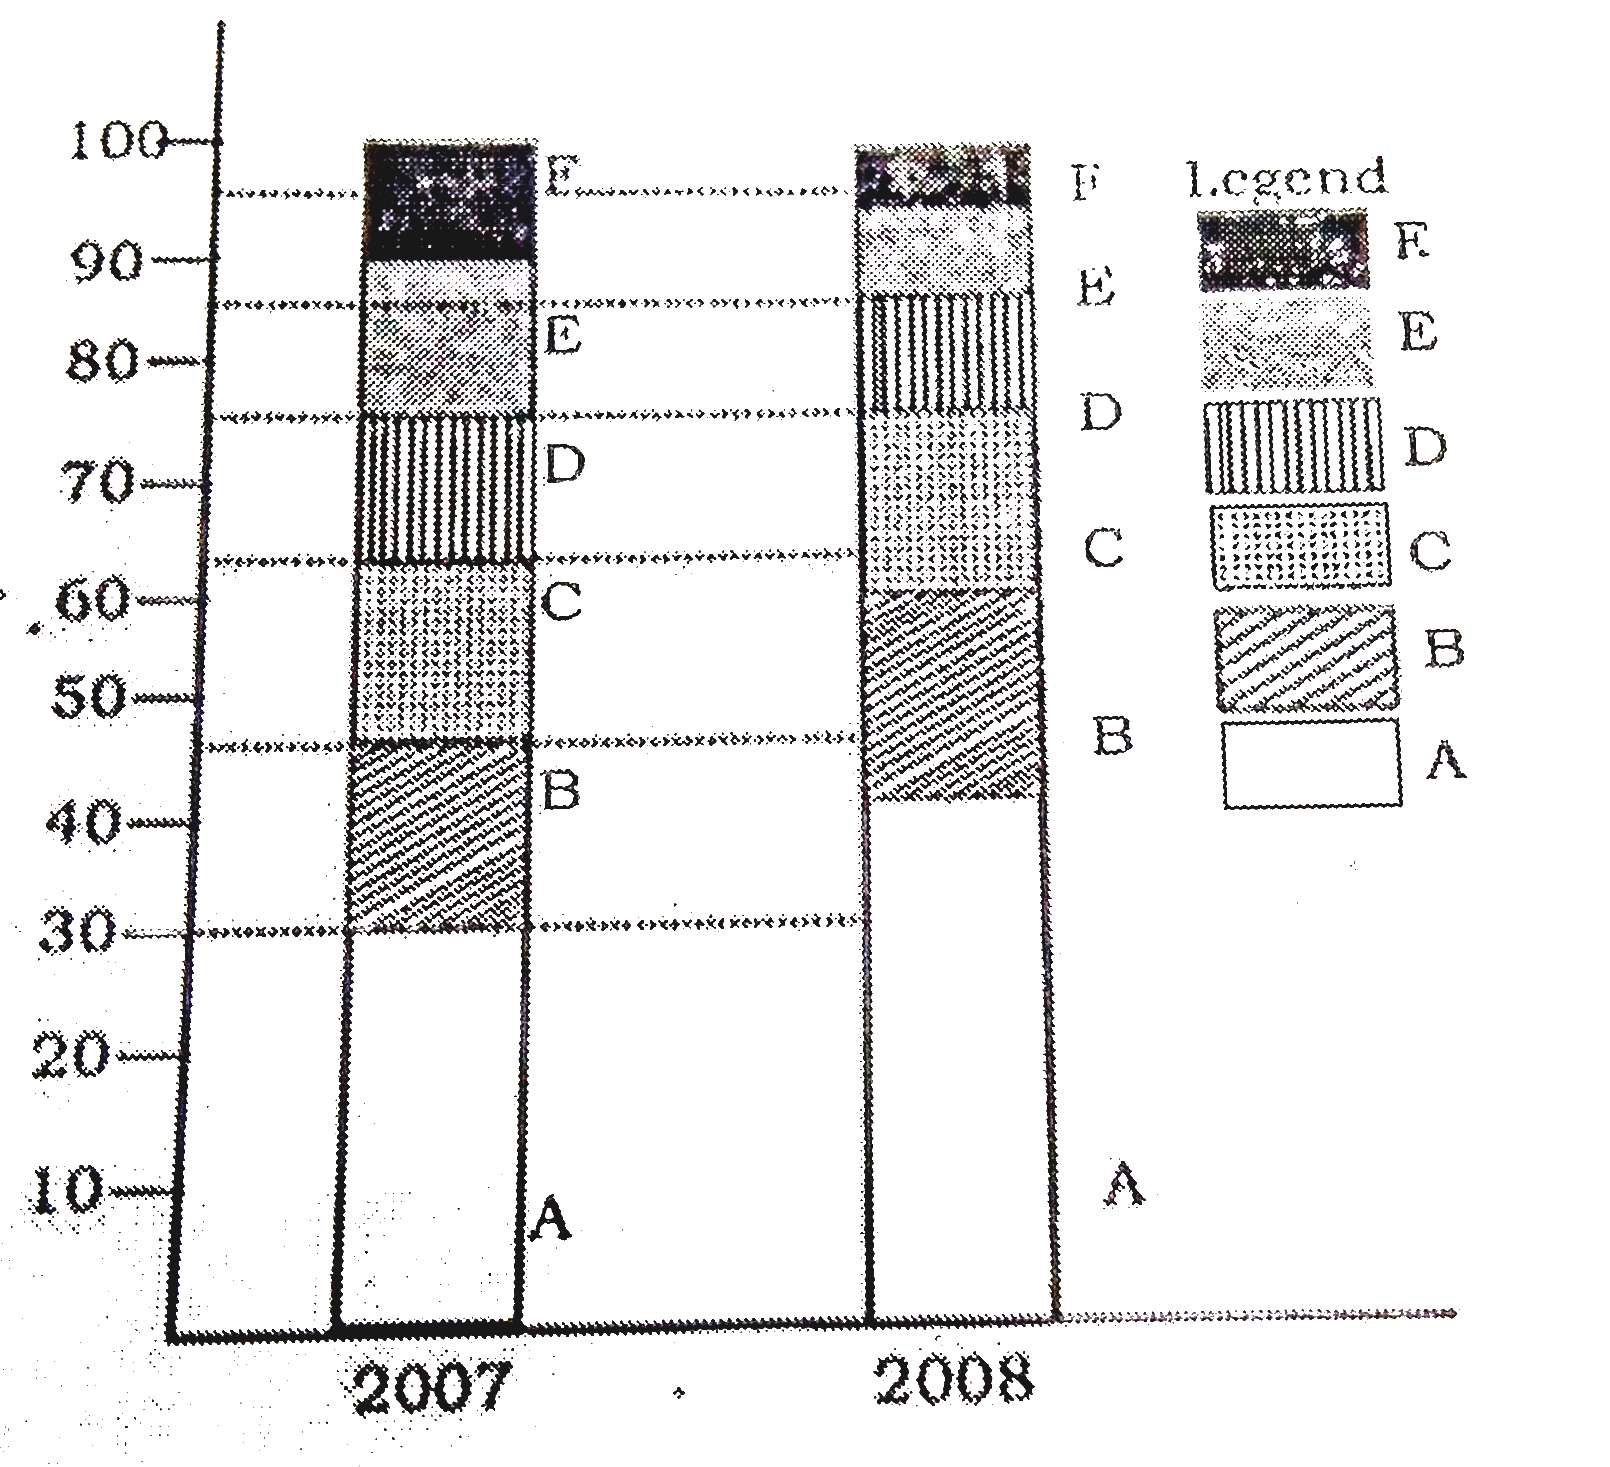
यदि प्रतिवर्ष उत्पादित होने वाले D प्रकार के नमूनों की संख्या का बेच दिया जाता हो तो बताये D प्रकार के मोबाइल जो नहीं बेचे गए की कुल संख्या क्या है ।02:10View Solution
The cost of the living index for 2008, taking 2007 as the base year, is 200. Find y.
(a) 10
(b) 12
(c )14
(d) 802:17View SolutionThe inequation represented by the graph given below is :
03:17View SolutionThe inequation that best describes the graph given below is _________
02:32View SolutionThe bar chart given below shows the percentage distribution of the production of various models of a ,mobile manufacturing company in 2007 and 2008. The total production in 2007 was 35 lakh mobile phones and in 2008 the production was 44 lakh. Study the chart and answer the following questions.
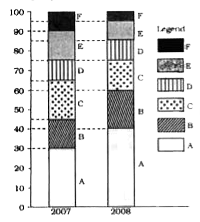
For which models was the percentage variation in production from 2007 to 2008 the maximum ?02:44View SolutionThe bar chart given below shows the percentage distribution of the production of various models of a ,mobile manufacturing company in 2007 and 2008. The total production in 2007 was 35 lakh mobile phones and in 2008 the production was 44 lakh. Study the chart and answer the following questions.
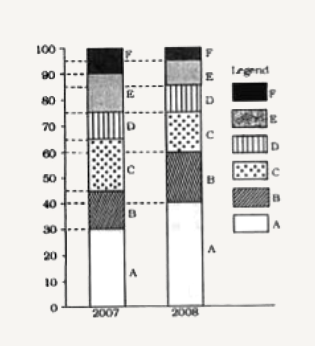
What was the difference in the number of B type mobiles produced in 2007 and 2008 ?02:30View SolutionThe bar chart given below shows the percentage distribution of the production of various models of a ,mobile manufacturing company in 2007 and 2008. The total production in 2007 was 35 lakh mobile phones and in 2008 the production was 44 lakh. Study the chart and answer the following questions.
If the percentage production of A type mobiles in 2008 was same as that in 2007, then the number of A type mobiles produced in 2008 would have been03:05View SolutionThe bar chart given below shows the percentage distribution of the production of various models of a ,mobile manufacturing company in 2007 and 2008. The total production in 2007 was 35 lakh mobile phones and in 2008 the production was 44 lakh. Study the chart and answer the following questions.
If 85% of the D type mobiles prodeced in each year were sold by the company, how many D type mobiles remained unsold ?03:57View SolutionYear by a mobile manufacturer in the column diagram given below. 2007 And 2008 The percentage distribution of mobiles of different models is shown. Year 2007 Total production of mobile phones in 35 was a million and 2008 In that 44 was a million. Percentage of six different types of mobiles manufactured by a company in two years Year 2007 What is the total number of mobiles of models A, B and E manufactured in India?
02:32View SolutionYear by a mobile manufacturer in the column diagram given below. 2007 And 2008 The percentage distribution of mobiles of different models is shown. Year 2007 Total production of mobile phones in 35 was a million and 2008 In that 44 was a million. Percentage of six different types of mobiles manufactured by a company in two years Year 2007 From 2008 Which models produced the maximum percentage of variance till date?
02:18View Solution

